Báo cáo y học: "Refractive Status and Prevalence of Refractive Errors in Suburban School-age Children"
Bạn đang xem bản rút gọn của tài liệu. Xem và tải ngay bản đầy đủ của tài liệu tại đây (733.94 KB, 12 trang )
Int. J. Med. Sci. 2010, 7
342
I
I
n
n
t
t
e
e
r
r
n
n
a
a
t
t
i
i
o
o
n
n
a
a
l
l
J
J
o
o
u
u
r
r
n
n
a
a
l
l
o
o
f
f
M
M
e
e
d
d
i
i
c
c
a
a
l
l
S
S
c
c
i
i
e
e
n
n
c
c
e
e
s
s
2010; 7(6):342-353
© Ivyspring International Publisher. All rights reserved
Research Paper
Refractive Status and Prevalence of Refractive Errors in Suburban
School-age Children
Lian-Hong Pi
1
, Lin Chen
1
, Qin Liu
1
, Ning Ke
1
, Jing Fang
1
, Shu Zhang
1
, Jun Xiao
1
, Wei-Jiang Ye
1
, Yan Xiong
1
,
Hui Shi
1
, Zheng-Qin Yin
2
1. Department of Ophthalmology, Children's Hospital, Chongqing Medical University, Chongqing, People’s Republic of
China
2. Southwest Hospital, Southwest Eye Hospital, The Third Military Medical University, Chongqing, People’s Republic of
China
Corresponding author: Dr Zheng-Qin Yin, Southwest Hospital, Southwest Eye Hospital, Third Military Medical Univer-
sity, Gaotanyan 30, Shapingba District, Chongqing 400038, China; Tel: +86-23-68754401; Fax: +86-23-63622874; Email: hap-
Received: 2010.09.12; Accepted: 2010.10.15; Published: 2010.10.18
Abstract
Objective: T h i s s t u d y investigated the distribution pattern of refractive status and prevalence
of refractive errors in school-age children in Western China to determine the possible en-
vironmental factors. Methods: A random sampling strategy in geographically defined clusters
was used to identify children aged 6-15 years in Yongchuan, a socio-economically repre-
sentative area in Western China. We carried out a door-to-door survey and actual eye
examinations, including visual acuity measurements, stereopsis examination, anterior segment
and eyeball movements, fundus examinations, and cycloplegic retinoscopy with 1% cyclo-
pentolate. Results: A total of 3469 children living in 2552 households were selected, and
3070 were examined. The distributions of refractive status were positively-skewed for
6-8-year-olds, and negatively-skewed for 9-12 and 13-15-year-olds. The prevalence of
hyperopia (≥+2.00 D spherical equivalent [SE]), myopia (≤-0.5 0 D S E ) , a n d a s t i g m a t i s m ( ≥ 1 .00
diopter of cylinder [DC]) were 3.26%, 13.75%, and 3.75%, respectively. As children’s ages
increased, the prevalence rate of hyperopia decreased (P<0.001) and that of myopia increased
significantly (P<0.001). Children in academically challenging schools had a higher risk of myopia
(P<0.001) and astigmatism (≥1.00DC, P =0 .04) than those in regular schools. Conclusion:
The distribution of refractive status changes gradually from positively-skewed to negative-
ly-s k e w e d d i s t r i b u t i o n s a s a g e i n c r e a s e s , w i t h 9 -year-o l d b e i n g t h e c r i t i c a l a g e f o r t h e c h a n g e s .
Environmental factors and study intensity influence the occurrence and development of
myopia.
Key words: refractive error, suburban school-age children, myopia
INTRODUCTION
Childhood visual impairment due to refractive
errors is one of the most common problems among
school-age children and is the second leading cause
for treatable blindness [1]. Vision 2020: The Right to
Sight, a global initiative launched by a coalition of
non-government organizations and the World Health
Organization (WHO) [2], is to eliminate avoidable
visual impairment and blindness on a global scale. In
China, the problem of uncorrected refractive error is
particularly common [3], and the refractive errors
have become one of the leading causes for visual im -
pairment and blindness, especially among children
Int. J. Med. Sci. 2010, 7
343
[4]. In order to reduce the occurrence of avoidable
visual impairment and blindness caused by refractive
errors, there is an urgent need for obtaining the epi-
demiological information on refractive errors and
other eye diseases among school-age children.
There are several epidemiological reports on re-
fractive errors in school-age children from the
Asia-Pacific region and many other countries, such as
Singapore [5], South Korea [6], Japan [7], China [8, 9,
10], Nepal [11], Malaysia [12], India [13, 14], and Chile
[15]. The prevalence rates of refractive errors in these
areas are different from the results of epidemiological
studies from China [8, 9, 10] and the prevalence of
myopia is higher in China, indicating that differences
in ethnicity, regional and economical differences and
development levels could affect the prevalence of
refractive errors. For instance, It has been demon-
strated that different ethnic groups show different
prevalence rates of refractive errors [16].
Although there are some reports in this research
field from China, the subjects are mainly children
attending schools or patients seen in eye clinics [17],
which may not be representative of all school-age
children. Furthermore, the majority of the reported
population-based epidemiological researches on eye
diseases among school-age children [8, 9, 10]
are
conducted in regions near the national capital or in
developed coastal metropolis, which may not be fully
representative of the whole China, especially the de-
veloping regions.
Western China is very vast (6.8 million square
kilometers, accounting for 71% of the area in main-
land China), and includes eleven provinces and one
municipality, but the population is relatively sparse
(360 million, accounting for only 28% of the total
China population) [18]. Compared to other regions in
China, this area is relatively less developed. Becau se
of the relatively low standard of living and low level
o f s o c i a l e c o n o m i c a l d e v e l o p m e n t , t h e r e i s n o t e n o u g h
attention paid to children's vision and refractions in
Western China.
In order to obtain the refractive status in
school-age children in Western China, we selected
Yongchuan District, Chongqing, a representative dis-
trict in Western China, as the study site for our pop -
ulation-based research. The focus of our research was
to determine the environmental factors on the preva-
lence of refractive errors within a single ethnicity. We
a l s o c o m p a r e d t h e p r e v a l e n c e r a t e s o f r e f r a c t i v e e r r o r s
in academically challenging schools with those in
regular schools to determine the effects of academic
demands (study load) among these children on their
vision and eye health. Additionally, with a compari-
son with previous reports [8, 9, 10], our results may
provide a basis for establishing effective strategies for
the prevention and treatment of refractive errors
among school-age children in China.
MATERIALS AND METHODS
Sample Selection
A cross-sectional study was conducted in
Yongchuan District, one of the 40 administrative dis-
tricts in Chongqing City. Chongqing city, with a reg-
istered population of 30.51 million (2000 Census), is
considered an economic and cultural center of West-
ern China [19]. Yongchuan District was chosen for this
study because it had a relatively stable population
(-0.97% annual average growth rate from the 2000
Census), with its socioeconomic status being ranked
middle in Western China and most residents in this
district being Han Chinese.
In this study, clusters were defined by geo-
graphical residential areas, called residence adminis-
trative community (RACs) and villages. Those RACs
and villages with large populations were further di-
vided and those with small populations were com -
bined to create clusters with estimated 100 to 150 eli-
gible children each. T h e c a l c u l a t i o n o f s a m p l e s i z e w a s
based on preliminary studies carried out from Sep-
tember 6, 2006 to October 7, 2006, in which 324 aged
6-15 year-old children were randomly selected. The
prevalence of refractive errors was 20%. The level of
significance was set at 5% (two-t a i l e d ), and the toler-
able error (type B error) was set at 1.5%. The sample
size for this study was calculated as follows:
n≈Z
2
(ρ)(1-ρ)/B
2
, where ρ=0.2, B=0.015, and Z=1.96 for
a 95% confidence interval; and the error bound was
7.5%. After adjusting for an anticipated 10% nonpar-
ticipation rate, the sample size was determined to be
3,005 [20]. Among the 78 clusters that met the study
criteria, 28 were randomly selected for the study, in -
cluding 6 from urban areas, 13 from rural areas, and 9
from suburban areas; in the latter regions approx-
imately 1/3 of people were registered as urban resi-
dents and the remaining 2/3 as rural residents. It was
e s t i m a t e d t h a t 3 4 6 9 e l i g i b l e c h i l d r e n w e r e l i v i n g i n t h e
28 clusters, exceeding the required sample size of
3005.
The inclusion criteria were the following: 1) ac-
t u a l a g e w a s 6 -15-y e a r s o l d o n t h e e x a m i n a t i o n d a y ; 2 )
parents or legal guardians signed an informed con-
sent; and 3) there was no history of systematic cardi-
ovascular or nervous diseases, such as congenital
heart diseases, hypoxic-ischemic encephalopathy, and
learning difficulties. The exclusion criteria were the
following: 1) Children who had eye injuri es or eye
diseases (e.g., corneal opacities, cataracts, fundus pa-
Int. J. Med. Sci. 2010, 7
344
thology, etc) that affected visual functions; 2) children
w h o h a d a h i s t o r y o f u n t r e a t e d c l o s e d -angle glaucoma
or untreated anatomically narrow angles - i n f o r m a-
tion obtained from anterior segment examination and
medical history; 3) children who were allergic to any
ingredient in 1% cyclopentolate solution; 4) children
who refused to continue the examinations due to eye
discomfort during cyclopentolate administration (e.g.,
burning, photophobia, irritation); and 5) children who
moved eyeballs excessively during examination.
Field Survey
According to the 2000 Census, households with
eligible children were chosen based on resident ad-
dress. Children aged 6-15 years having lived in cen-
sus-identified households for at least six months were
selected. Those who were selected but temporarily
absent from the area at the time of selection were also
included. During door-to-door selection interviews, a
parent or legal guardian of the child was informed of
the study details, including the side effects of pupil-
lary dilation and cycloplegia and the assigned time for
eye examination. Parents who had expressed hesi-
tancy or reluctance to participate in this study were
invited to a seminar for further information on the
study. The study only included children whose par-
ents or legal guardians signed the consent form. T he
selection process was completed in one month, from
August 8, 2006 to September 5, 2006. Human subject
research approval f o r t h e s t u d y p r o t o c o l w a s o b t a i n e d
from WHO’s Secretariat Committee on Research In-
volving Human Subjects. The study protocol was also
approved by the local ethics committee. The protocol
adhered to the provisions of the Declaration of Hel-
sinki for research. The Bureau of Education and Bu-
reau of Health in Yongchuan District approved the
implementation of this study.
Eye Examination
Eye examinations were performed by a medical
team consisting of three ophthalmic nurses, two
ophthalmologists, and one optometrist, between Oc-
tober 8, 2006 and January 1, 2007. Examination in-
cluded an assessment of visual acuity, stereopsis, and
ocular motility. A slit lamp assessment of the anterior
segment and a dilated fundus examination was also
performed.
The examination process began with testing
visual acuity at 4 m using ETDRS LogMAR visual
acuity chart (Precision Vision, La Salle, IL) [21]. After
testing stereopsis with digital stereograms, the oph-
thalmologist evaluated the anterior segment with a
s l i t l a m p a n d o c u l a r m o t i l i t y w a s a s s e s s e d u s i n g a p e n
torch. B o t h p u p i l s w e r e t h e n d i l a t e d w i t h t w o d r o p s o f
1% cyclopentolate at five minute intervals, and the
pupillary light reflex was checked 20 min later. If the
pupillary light reflex was still present, a third drop
was administered. Light reflex and pupil dilation
were evaluated an additional 15 min. Cycloplegia was
considered complete if the pupil was dilated to 6 mm
or more and the light reflex was absent. After the
fundus examination was performed with a direct
ophthalmoscope (YZ6E; Six Six Vision Corp., S u zho u ,
China), refraction was performed with a streak reti-
noscope (YZ24; Six Six Vision Corp., Suzhou, China).
Because the examination was carried out in the win -
ter, photophobia after mydriasis was not obvious. All
the examined children did not have assigned home-
work on the examination day, avoiding the difficulties
in reading and writing caused by ciliary muscle pa-
ralysis. Children with refractive errors without cor-
r e c t i o n w e r e r e f e r r e d t o a l o c a l e y e h o s p i t a l f o r f u r t h er
diagnosis and treatment.
Data Management and Analysis
Household selection and clinical examination
data were reviewed for accuracy and completeness
before the computer-aided data entry. Refraction of
astigmatism was expressed by SE (SE = sphere + 0.5 ×
cylinder). The refraction distributions of all age
groups were expressed as mean ± standard deviation
(SD) a n d m e d i a n v a l u e s o f d i o p t e r f o r b o t h e y e s . Since
the refraction distributions of left eyes and right eyes
were similar (Pearson coefficient = 0.90) and the data
from left eyes had fewer outliers, only the data from
left eyes were presented in this report. The distribu-
tions of refractive status were further analyzed by
dividing the children into three age groups:
6-8-year-old (Grades 1-3), 9-12-year-old (Grades 4-6),
and 13-15-year-old (Grades 7-9). The division was
based on different learning stages. One-way analysis
of variance (ANOVA) and least significant difference
(LSD) multiple comparisons were carried out to test
significance of the differences between diopter means
of different age groups. P<0.05 was considered statis-
tically significant. Furthermore, Kolmogoroy-Sm i r n ov
(KS) tests were utilized to perform the normal distri-
bution tests for the refractive distributions of every
age as well as every age group.
Children were considered hyperopic (defined as
≥+1.50 D SE or ≥+2.00 D SE) if one or both eyes were
hyperopic; myopic (defined as ≤-0.50 D SE) if one or
both eyes were myopic; astigmatism (defined as cy-
linder powers ≥0.50 DC or ≥1.00 DC) if one or both
eyes were astigmatism. Astigmatism was further
analyzed by dividing the subjects into three types:
hyperopic astigmatism (simple hyperopic astigmat-
ism and compound hyperopic astigmatism), myopic
Int. J. Med. Sci. 2010, 7
345
astigmatism (simple myopic astigmatism and com -
pound myopic astigmatism), and mixed astigmatism.
Confidence intervals for the prevalence estimates
were calculated. All data were statistically analyzed
with a SPSS software program (SPSS for Windows,
Rel.13.0.0.2004; SPSS, Chicago, IL). Chi -square tests
were applied to compare the prevalence of hyperopia,
myopia, and astigmatism among different groups.
When outcome variables (had refractive error or not)
were used in logistic regression, we analyzed the fac-
tors such as age, gender and school type affecting the
prevalence of refractive errors.
Quality Assurance
All investigators and staff involved in this re-
search participated in an intensive two-day training.
Demographic data were collected by qualified nurses.
During a complete examination, the tested children
went through six separate stations: visual acuity as-
sessment, stereopsis, anterior segment and eye
movement examinations, eye drop instillation, cyc-
loplegic retinoscopy, and fundus examination. The
quality of examination for each station was controlled
by the leading investigators. Because a senior inves-
tigator was assigned for the quality control for each of
the six stations and every station’s record was pro -
duced independently, this research procedure mini-
m i z e d p o s s i b l e s y s t e m a t i c b i a s e s t h a t c o u l d b e p resent
when only one person performed multiple tests or
multiple people performed one test.
RESULTS
Characteristics of the Study Population
The randomly selected 28 clusters included 3611
households, of which 2552 households (70.67%) had a
total of 3469 c h i l d r e n a g e d 6 -15 years. Among the 2552
households, 1713 (67.12%) had one child and 839
(32.88%) had two or more children. Among the 3469
children, 399 children were excluded from the study
for various reasons: 197 refused to participate in the
eye examinations, nine had potential risks for cyclop-
legia, 36 had eye discomforts, 86 had other patholog-
ical conditions (systematic diseases such as congenital
brain diseases and cardiovascular diseases), 63 were
un a ble to continue the examination due to
non-cooperation, and eight had unclear fundus ref-
lexes in eyes with corneal or media opacities. Finally,
3070 children (88.50%) met the study criteria, includ-
ing 1611 boys (52.48%) and 1459 girls (47.5 2 %) , w i t h
the gender ratio (M:F) being 1.1:1.0. Girls had a better
response rate (90.56%) than boys (86.71%). The aver-
age age was 10.41 ± 2.73 years old. Table 1 shows the
demographic makeup of the study population. The
324 children from the pilot study were also included
in the 3070 children.
Refraction distribution
Refractions of both eyes for all the 3070 children
were examined with cycloplegic dilation. The mean
re f r a cti o n wa s 0 .47±1.20 D SE in left eyes. Table 2
shows the detailed information of SE values in left
eyes. F r o m 6 -year-o ld to 15-year-old, the SE means
displayed a decreasing trend from +1.36 D to -0.14 D
SE, but the rate of decrease was not constant. The re-
fraction medians also displayed a decreasing trend as
age increased; refractions for 6-year-old children had
a median of +1.25 D SE, and refractions for
15-year-old children had a median of +0.25 D SE.
These results indicated that as age increases, more
children have negative SE values.
Table 1 Age and sex distribution of the selected and examined population
Age
NO.(%) of All NO. (%) of Boys NO. (%) of Girls
Selected Examined %Exam Selected Examined %Exam Selected Examined %Exam
6 300(8.65) 239(7.79) 79.67 177(9.53) 139(8.63) 78.53 123(7.64) 100(6.85) 81.30
7 362(10.44) 313(10.20) 86.46 195(10.50) 169(10.49) 86.67 167(10.37) 144(9.87) 86.23
8 369(10.64) 339(11.04) 91.87 170(9.15) 156(9.68) 91.76 199(12.35) 183(12.54) 91.96
9 378(10.90) 350(11.40) 92.59 196(10.55) 180(11.17) 91.84 182(11.30) 170(11.65) 93.41
10 373(10.75) 341(11.12) 91.42 166(8.93) 154(9.56) 92.77 207(12.85) 187(12.82) 90.34
11 349(10.06) 319(10.39) 91.40 200(10.76) 180(11.17) 90.00 149(9.25) 139(9.53) 93.29
12 358(10.32) 305(9.93) 85.20 197(10.60) 167(10.37) 84.77 161(10.00) 138(9.46) 85.71
13 325(9.37) 285(9.28) 87.69 181(9.74) 156(9.68) 86.19 144(8.94) 129(8.84) 89.58
14 379(10.93) 354(11.53) 93.40 207(11.14) 187(11.61) 90.34 172(10.68) 167(11.45) 97.09
15 276(7.96) 225(7.33) 81.52 169(9.10) 123(7.64) 72.78 107(6.64) 102(6.99) 95.33
All 3469(100.0) 3070(100.0) 88.50 1858(100.0) 1611(100.0) 86.71 1611(100.0) 1459(100.0) 90.56
Int. J. Med. Sci. 2010, 7
346
Table 2 Descriptive statistics (Mean, Median, SD, Range, Kurtosis and Skewness) of SE diopter in left eyes
Age(yrs) Mean* Median SD Range Kolmogorov-Smirnov test Kurtosis Skewness
z-statistic P-value
Total 0.47 0.75 1.20 -10.00~8.13 11.116 <0.001 10.68 -1.80
6 1.36
a
1.25 0.58 -0.50~4.38 3.011 <0.001 9.29 1.92
7 1.22
b
1.25 0.77 -3.25~8.13 3.808 <0.001 27.48 1.52
8 0.94
c
1.00 0.95 -4.00~6.25 3.898 <0.001 12.91 -0.43
9 0.66
d
0.75 0.87 -4.38 ~3.25 3.785 <0.001 10.06 -2.34
10 0.56
d
0.75 1.04 -10.00~5.00 4.391 <0.001 34.37 -3.84
11 0.21
e
0.50 1.11 -8.50~2.50 4.299 <0.001 17.58 -3.26
12 0.13
ef
0.37 1.06 -5.38~5.50 3.793 <0.001 6.46 -1.43
13 -0.00
f
0.37 1.30 -7.50~6.00 4.524 <0.001 11.15 -2.32
14 -0.23
g
0.25 1.52 -8.00~8.00 4.843 <0.001 6.40 -1.36
15 -0.14
g
0.25 1.21 -5.13~3.50 3.641 <0.001 2.90 -1.36
6-8 1.15 1.25 0.82 -4.00~8.13 5.639 <0.001 17.65 0.15
9-12 0.41 0.62 1.05 -10.00~5.50 7.238 <0.001 16.81 -2.67
13-15 -0.13 0.25 1.38 -8.00~8.00 7.717 <0.001 7.21 -1.64
* Means in the same column with different letters (a, b, c, d, e, f, g) were significantly different (P<0.05, ANOVA, LSD).
T h e n t h e f r e q u e n c y d i s t r i b u t i o n s o f t h e r e f r a c t i v e
status for children at various ages were studied. T he
normal distribution tests showed that every age’s re-
fractive distribution was abnormal (Kolmogo-
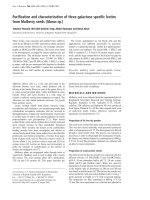
rov-Smirnov test, P<0.001). Figure 1 shows the fre-
quency distribution of SE refraction in the three age
groups. Every age group’s frequency distribution
clearly showed a SE peak. In t he 6 -8-year-o l d g rou p,
the SE varied from -4.00 to +8.13 D and peaked be-
tween +1.25 D and +1.50 D (24.50 % of the children in
t h e g r o u p ) . In the 9-12-year-old group, the SE varied
from -10.00 to +5.50 and peaked between +0.75 D and
+1.00 (20.80%). In the 13-15-year-old group, the SE
varied from -8.00 to +8.00 D and peaked between
+0.50 D and +0.75 D (20.80%). The refractive fre-
quency distributions for ages 6-8 were positive-
ly-skewed (skewness=0.15), but the frequency distri-
butions for ages 9-12 (skewness= -2.67) a nd 13-15
(skewness=-1.64) showed negatively skewed du e t o
increased myopia in the two groups.
Prevalence of refractive errors
Table 3 shows the prevalence of hyperopia,
myopia, and astigmatism at different ages. Among the
3070 children, 384 (12.51%) had hyperopia if the ≥
+1.50 D SE standard was used or 100 (3.26%) had
hyperopia if the ≥ +2.00 D SE standard was used; 422
(13.75%) had myopia (≤ -0.5 D SE); 343 (11.17%) had
a s t i g m a tism if the ≥ 0.50 DC standard was used or 115
(3.75%) had astigmatism if the ≥1.00 DC standard was
used. These results demonstrated that age had a sig-
nificant influence on the prevalence of hyperopia and
myopia: as age increased, the prevalence of hyperopia
markedly decreased, and that of myopia significantly
increased. The prevalence of hyperopia was 48.12% (≥
+1.50 D SE) and 9.21% (≥ +2.00 D SE) among
6-year-o lds . The prevalence of hyperopia was s i g nif i-
cantly decreased to 1.33% (≥ +1.50 D SE, χ
2
=133.762,
P<0.001) and 0.89% (≥ +2.00 D SE, χ
2
=16.341, P<0 .001)
among 15-year-ol d s. Furthermore, the prevalence of
myopia significantly increased from 0.42% to 27.11%
from 6 to 15-year-olds (χ
2
=71.329, P<0.001). Figure 2A
shows the prevalence of refractive errors in different
groups.
Age did not significantly affect the prevalence of
astigmatism (≥ 0.50 DC, χ
2
=11.548, P=0.24; ≥ 1.00 DC,
χ
2
=8.806, P=0.46). The prevalence of astigmatism was
11.30% (≥ 0.50 DC) and 4.18% (≥ 1.00 DC) in
6-year-olds, and 14.22% (≥ 0.50 DC) and 4.89% (≥ 1.00
DC) in 15-year-olds.
Gender did not significantly affect the preva-
lence rates of hyperopia (≥ +1.50 D SE, χ
2
=1.079,
P=0.3 0 ; ≥ +2 .00 D SE, χ
2
=2.977, P=0.08), myopia
(χ
2
=0.458, P=0.50), and a s t i g m a t i s m (≥ 0.50 DC,
χ2=0.472, P=0.49; ≥ 1.00 DC, χ
2
=0.684, P=0.41), al-
though girls had slightly higher prevalence of refrac-
tive errors than boys (Figure 2B).
The prevalence of hyperopia (≥ +1.50 D SE,
χ
2
=0.02, P= 0 .88; ≥ +2.00 D SE, χ
2
=1 .65, p=0.20) did n ot
differ between children in academically challenging
schools and those in regular schools. The prevalence
of myopia and astigmatism among children in aca-
demically challenging schools, however, were signif-
icantly higher than that in regular schools. T h e pre-
valence of myopia in academically challenging
schools and regular schools were 32.68% and 9.78%
(χ
2
=85.53, P< 0 .001), respectively. The prevalence of
astigmatism (≥ 1.00 DC) in academically challenging
schools and regular schools were 6.32% and 3.54%
(χ
2
=4.41, P=0.04), respectively (Figure 2C).