Differential response of rice hybrids and varieties to nitrogen fertilization and their exploitation in Andaman and Nicobar islands
Bạn đang xem bản rút gọn của tài liệu. Xem và tải ngay bản đầy đủ của tài liệu tại đây (349.47 KB, 15 trang )
Int.J.Curr.Microbiol.App.Sci (2019) 8(9): 1382-1396
International Journal of Current Microbiology and Applied Sciences
ISSN: 2319-7706 Volume 8 Number 09 (2019)
Journal homepage:
Original Research Article
/>
Differential Response of Rice Hybrids and Varieties to Nitrogen
Fertilization and their Exploitation in Andaman and Nicobar Islands
B. Gangaiah*, Adamala Sirisha, S. Swain and T. Subramani
Division of Natural Resource Management, ICAR-Central Island Agricultural Research
Institute, Port Blair, Andaman & Nicobar Islands, India
*Corresponding author
ABSTRACT
Keywords
Rice, Hybrid,
Nitrogen, Net
income, High
yielding variety
Article Info
Accepted:
20 August 2019
Available Online:
10 September 2019
In Andaman and Nicobar Islands, India, rice productivity is low due to traditional long
duration variety (C-14-8) cultivation on poorly fertile soils with minimal or no fertilizer
use due to heavy rains. In this context, ability of rice hybrids and high yielding varieties
(HYV) under varying nitrogen supplies to adopt and enhance rice productivity and profits.
Field study was made during 2015 rainy season in split plot design with three replications.
Treatments formed by combination of 5 rice cultivars (3 hybrids: KRH-4, 28P09 &
DRRH-3 and two HYV: WGL-14 and CARI Dhan-6) in main plot and four nitrogen (N)
rates (0, 50, 100 and 150 kg/ha) as sub-plot treatments. Best performing cultivars (KRH-4
hybrid and WGL-14 variety) and nitrogen rate (100 kg) were evaluated in 2016 and 2018
seasons. Results (2015 season) have indicated that KRH-4 and 28P09 hybrids have 39.2
and 28.2% yield improvements over local HYV CARI Dhan-6 (2.09 t/ha). Above higher
yields of hybrids with similar cost of cultivation as that of a variety have brought 3.16-4.52
times more profits. Grain yield exhibited linear response to nitrogen up to 150 kg rate,
however, its application beyond 100 kg was not economically rewarding. Rice cultivar and
nitrogen interaction indicated that KRH-4 hybrid was suitable for both no, low and high N
inputs. Rice hybrid „28P09‟ required N fertilization (100 kg) for its potential performance.
Confirmatory trails of KRH-4 for two seasons (2016 & 2018) have shown 17.1% yield
advantage over HYV „WGL-14‟ over 3 seasons at 100 kg N rate. The study proved that
hybrids are better candidates for Island ecosystem where response to N fertilization is
rainfall dependent and soils have inherent fertility.
Introduction
Andaman and Nicobar Islands (ANI), an
Union Territory of India lies as a separate land
mass (0.8249 m km2) from mainland in the
midst of Bay of Bengal at a distance of over
1100 km. ANI is inhabited by 0.38 m people
as per 2011 census and is frequented by 0.487
m tourists during 2017. Farming is practised
on 40506 ha of which rice (Oryza sativa L.)
crop accounts for 13.2% acreage (DOES,
2018). Rice is the only cereal staple grown in
ANI as a transplanted crop of rain fed
lowlands near the coast on acidic soils with
salinity dimension (acid-saline, acid-sulphatesaline) with high phosphorus fixation and low
available nitrogen and potassium (Singh et al.,
1988). Excess monsoon rains (~200 cm in ~90
days) of islands results in flash flooding; deep
water submergence of paddy soils (Courtois et
1382
Int.J.Curr.Microbiol.App.Sci (2019) 8(9): 1382-1396
al., 2001) and have poor crop yields
(Amanullah et al., 2007). Untimely rains
during rice season often hamper timely
nitrogen fertilizer top dressing. Even if applied
timely, its efficacy is reduced with subsequent
rains through various losses especially run off.
Nutrient omission studies of NPK have
indicated a yield penalty of 60.7% in the study
region (Gangaiah et al., 2016) that would be
still higher in no soil amelioration
(amendments) scenario of islands. In such
edapho-climatic condition of ANI, long
duration, tall, photosensitive varieties (C-14-8)
requiring minimal or no fertilizer nitrogen
inputs have been cultivated on as high as 70%
total acreage (Subramani et al., 2014) with
low yields and thus profits. Poor economic
prospects of rice crop has resulted in loss of
patronage with its cultivation as evident from
the decreased area from 12000 ha in late
1990s (Mandal et al., 2004) to the current
5340 ha (DOES, 2018). Indian Ocean
Tsunami of 26th December, 2004 has further
reduced the rice crop prospects due to
deteriorated soil and water quality (Ganesh
Kumar et al., 2009) that however, were
restored to normalcy owing to leaching
/washing of the soils of salts by copious
rainfall of the islands (Velmurugan et al.,
2015) and have overcome the constrained
yields and profits as in states of Tamil Nadu
and Pondicherry (Shanmugasundaram and
Ponnusamy, 2009) that have low rainfall.
Attempts are made to improve the yield
potential of local rice varieties through
breeding (Singh et al., 2014) and also
introduction of high yielding varieties from
mainland to some extent. Starting from 1995
with release of first hybrid (APRRH-1), India
has released 97 hybrids till 2017 (DRD, 2018)
with 15-20% yield gains (FAO, 2014).
Hybrids with higher and more vigorous root
systems (Yang and Sun 1986; Zhang et al.,
2009) than a variety were found to contribute
to more soil N tapping (Hunag et al., 2017)
makes them ideal candidates for low N input
farming of islands. It is in this context, hybrids
were introduced and tested in Islands and is
aimed at understanding the rice cultivar and N
interactions and tapping the same for islands
where 100 kg/ha N (Damodaran et al., 2012)
is recommended dose for a rice variety.
Materials and Methods
Experimental location
Field studies on rain fed lowland transplanted
rice was conducted during July- November,
2015 -2018 at the Bloomsdale farm, ICARCentral Island Agricultural Research Institute,
Andaman, & Nicobar Islands, India located at
110 38‟ 06” N latitude and 920 39‟ 15‟‟ E
longitude at an altitude of 14 m above mean
sea level. This study region has Udic moisture
and Isothermic temperature regime.
Experimental soil characteristics
The experimental clay loam soil, at start of
study in 0 -20 cm depth has 6.3 pH (measured
in a 1:2.5 soil-water suspension), non-saline
(ECe<0.58 dS/m), 6200 kg/ha organic carbon
(Walkley and Black method, Jackson, 1973),
258 kg/ha alkaline permanganate hydrolysable
N (Subbiah and Asija,1956), 11.0 kg/ha 0.5M
NaHCO3 extractable P (Olsen‟s method, Olsen
et al., 1954) and 132 kg/ha 1N NH4OAC
exchangeable K (Flame photometer method,
Jackson, 1973) as determined by using the
procedures described by Singh et al., (2005).
Treatments
Treatments during 2015 study consisted of
five recently improved rice cultivars (28P09,
DRRH-3, KRH-4 rice hybrids; WGL-14 a
high yielding varieties from mainland and
CARI Dhan-6 a local improved variety) as
main plot and four nitrogen rates (0, 50, 100
and 150 kg/ha) in sub-plot. These nitrogen
rates represented 0, 50, 100 and 150% of
1383
Int.J.Curr.Microbiol.App.Sci (2019) 8(9): 1382-1396
recommended dose of rice crop in
experimental region. Treatments were
replicated thrice in a split plot design. Best
performing hybrid (KRH-4) from 2015 study
was re-evaluated against the variety „WGL14‟ at 4 N levels (2016) and during 2017:
28P09 and CARI Dhan-6 and during 2018:
KRH-4 and WGL-14 at recommended dose of
N i.e. 100 kg/ha were evaluated as a part new
hybrids screening trials. Package of practices
remained the same.
Crop nutrition
Nitrogen as prilled urea (46.4% N) was
applied in three equal splits on 5th, 27th and
47th day after transplanting (DAT) rice crop. A
sub-plot size of 5 m x 3 m with a 1 m channel
between plots on all sides was formed by 30
cm high soil levee to contain inter plot N
movement. Main plots and replications were
separated by 2 m alleys of bunds and a
channel. Irrigation water was also applied to
each plot separately. Thus, inter-plot
movement of N was fully controlled. The
experimental area received uniformly 60 kg/ha
each of P2O5 and K2O as single super
phosphate (16% P2O5) and potassium chloride
(60% K2O) applied in last puddling prior to
levelling and field layout. Land preparation
The experimental soil was thoroughly
prepared by three times power tiller puddling
after saturating the soil with water for a week.
First puddling was done with no standing
water that inverted and incorporated the
existing natural grasses and other plants. In
second and third puddling, 2-5 cm standing
water was maintained for pulverising the soil.
Soil was allowed to settle for a day, was
manually levelled and experimental lay out
was done.
Nursery and main field crop management
Clean paddy seeds were soaked in water for
24 hours in a bucket followed by placing them
in gunny bag for 24 hours for promoting
germination with frequent watering. In a
thoroughly prepared nursery field, five raised
beds of 1 m width, 5 m length and 0.20 m
height were made with drainage channels on
all sides. Seeds (0.5 kg) of each variety were
sown on separate bed on 1st July, 2015.
Nitrogen (urea) was applied @ 2 g N/m2 on 5
and 20th day. Nursery was watered daily and
weeds were removed once on 25th day after
seeding. Thirty (30) day old seedlings were
uprooted and transplanted in main field on
30thJuly, 2015 using 2 seedlings/ hill located
at 20 x 15 cm spacing. During 2016, Rice crop
was grown under rain fed conditions and faced
no moisture stress during its life cycle as need
based irrigations were given. Manual weeding
was done twice at 25 and 45 days after
transplanting (DAT) prior to 2nd and 3rdN
topdressing.
Data recording
Days to 50% flowering (visible observation)
and physiological maturity were recorded
(from seed soaking to flowering / maturity)
and reported. Plant height (cm) of 10
randomly selected hills from ground to tip of
the top most leaf (flag leaf) was measured and
the panicles were counted prior to harvest
treatment wise. The same hills were harvested
5 cm above the ground level and weight (g)
was recorded. Grains were separated by hand
from the above 10 hills and counted manually.
Average number of grains/panicle was
estimated by dividing number of grains with
panicle number. Grain and straw was oven
dried to bring down the moisture contents to
14 and 10% respectively and weight was
recorded. Harvest index was estimated as ratio
of weight of 10 hills grain (14% moisture) to
weight of straw (10 moisture) + grain. Weight
of 1000 oven dried grains was recorded and
reported as test weight (g). Crop was
harvested plot wise and biomass yield (kg)
was recorded. It was allowed to dry in the
shade of threshing floor for two days and
1384
Int.J.Curr.Microbiol.App.Sci (2019) 8(9): 1382-1396
threshed by manually operated pedal thresher.
Grain yield was recorded plot wise. Grain and
straw yields were adjusted to 14 and 10%
moisture level and their total weight is taken
as biological yield /plot. From plot yields, per
ha yields were estimated.
Nitrogen uptake and use efficiency
Nitrogen (N) concentration of grain and straw
was estimated as per procedures Singh et al.,
(2005) and uptake was estimated as product of
grain/ straw yield (t/ha) x nutrient
concentration (%) / 100. Nitrogen use
efficiencies were calculated as per Fageria and
Baligar (2011).
AE: Agronomic efficiency (kg grain/ kg N
applied): Grain yield in N applied plot (kg/ha)
- grain yield in no N applied plot/ N fertilizer
applied (kg/ha)
PE: Physiological efficiency (kg biomass/ kg
N uptake): Biomass (grain + straw) yield in N
applied plot (kg/ha) - Biomass yield in no N
applied plot /N uptake in N applied – No N
applied plot
AR: Apparent recovery (%): (N uptake by
biomass in fertilized-N uptake by biomass in
unfertilized plot/ nitrogen applied) x 100
UE:
Utilization
Efficiency
(kg/kg):
Physiological efficiency x Apparent recovery
NHI: Nitrogen harvest index: (Grain uptake /
biomass uptake) x 100
Economics
Economics for 2015 study were estimated
based input prices of market and output price
of rice grain as announced by Government of
India as minimum support price (Rs.
14,100/tonne, 2015-16) and assumed straw
price of Rs. 2,000/tonne. Benefit Cost ratio as
worked out as ratio of gross income {grain
yield (t/ha) x 14100 +straw yield (t/ha) x
2000} to cost of cultivation (Rs/ha). A
fertilizer price of 12.87/ kg N was used.
Statistical analysis
The analysis of variance was done in Split Plot
Design and significance of treatment
differences was compared by critical
difference at 5% level of significance (P=0.05)
and statistical interpretation of treatments was
done as per Gomez and Gomez (1984).
Results and Discussion
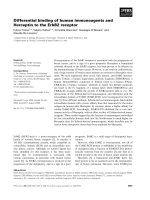
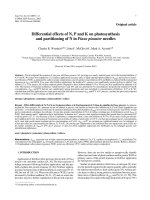
Weather during study period
Weather data during the experiment period
was highly congenial for rice cultivation
(Figure 1). A rain fall of 140.2 cm was
received in 62 rainy days. A mean maximum
and minimum temperature of 30.2 and 24.7OC
and relative humidity of 75- 90% was
recorded at the Indian Meteorological
Department (IMD)weather station at Port
Blair during crop life cycle (July-November).
Crop required irrigations during October
month to maintain 3-5 cm standing water and
were given through ground water. Required
plant protection measures were given to go
crop free of pest induced losses. Weeds were
taken take through manual weeding.
Recommended P, K fertilizers were applied
uniformly to exclude their yield limitations in
rice crop. There was uniform bird damage to
grains at experimental site that could not be
controlled as the birds are under Forest
Protection (wild life) laws. It is a common
factor for all treatments like P and K
fertilizers. Thus all biotic and abiotc stresses
of rice crop were taken care and any
differences in crop performance was solely
ascribed to cultivars (hybrid/ variety), nitrogen
fertilization and their interaction. The results
of study were presented in order of cultivar,
nitrogen and their interaction effects.
1385
Int.J.Curr.Microbiol.App.Sci (2019) 8(9): 1382-1396
Rice cultivars
Plant height and yield attributes
Rice cultivars differed greatly for plant height
and yield attributes (Table 1). „KRH-4‟ hybrid
being at a par with „28P09‟ hybrid has
produced significantly taller plants than other
cultivars. CARI Dhan-6 has produced the
shortest plants. Cultivars differed by 2-6 days
for reaching to 50% flowering and
physiological maturity stage, however, these
differences were statistically insignificant.
Significantly higher number of panicles/m2
(317.5), grains/panicle (123.8) and 1000 grain
weight (25.07 g) was recorded by KRH-4,
28P09 and CARI Dhan-6, respectively.
Panicles/m2 of „KRH-4‟ & „WGL-14 and
„28P09‟ & „DRRH-3‟ were at par. CARI
dhan-6 has produced the least panicles/m2.
Based on 1000 grain weight, WGL-14 (16.63
g) has lowest values, 28P09 and KRH-4
(19.33 and 19.90 g) and DRRH-3 and CARI
dhan-6 (23.9 and 25.07 g) formed two
separate groups. Significantly higher number
of grains/ panicle was recorded by KRH-4
than other four cultivars which in turn have at
par values among themselves.
Grain and biomass yield
Rice hybrid „KRH-4‟ has out yielded all other
cultivars significantly for grain and biomass
(2.91 and 9.20 t/ha) yields (Table 2) and
„CARI Dhan-6‟ stood at the bottom with
significantly lower values (2.09 and 6.64 t/ha).
Hybrid „28P09‟ is the second best performer
for grain and biomass yields. DRRH-3 hybrid
and „WGL-14‟ variety have at par yields.
Cultivars did not differ for harvest index and
have a mean value of 32.18.
Nitrogen uptake and use efficiency
Rice cultivars differed for grain and biomass
(grain + straw) N uptake (Table 3). „KHR-4‟
hybrid has significantly higher N uptake
values (grain and biomass) than all other
cultivars; however, its grain N uptake was at
par with „28P09‟ hybrid. „DRRH-3‟ hybrid
and „WGL-14‟ variety have at par N uptake
values while CARI Dhan-6 has the least
uptake values (grain and biomass) and its
grain N uptake was at par with WGL-14.
Nitrogen harvest index (NHI) remained
unaffected by cultivars. For N use efficiency
indices, 28P09 and CARI Dhan - 6 have
significantly higher and lower values,
respectively. However PE values are least in
„WGL-14‟ variety.
Economics
Economics (Rs/ha) of rice cultivation (Table
4) revealed that hybrids have Rs. 3600/ha
higher cost of cultivation than a variety (Rs.
34851) on account of high seed price (Rs. 200
and 30 per kg of hybrid and variety) while
seed rate used remained same for both. Net
income (Rs/ha) of „KRH-4‟ was significantly
higher (Rs.16616) than all other cultivars.
Other cultivars in descending order of net
income are: 28P09> WGL-14>DRRH3>CARI Dhan-6. Benefit cost ratio (BCR)
followed the net income and was the highest
in „KRH-4‟ (1.38) and CARI Dhan-6 has the
least BCR (1.10) which in turn was at par with
DRRH-3 (1.12).
Nitrogen fertilization impacts
Plant height and yield attributes
Plant height and yield attributes (except 1000
grain weight) of rice varied greatly due to N
fertilization (Table 5). Successive increase of
50 kg N fertilization from 0 to 100 for plant
height and panicles/m2, and from 0 to 50 kg in
case of grains / panicle have brought marked
improvements in their values over immediate
preceding N rate.
1386
Int.J.Curr.Microbiol.App.Sci (2019) 8(9): 1382-1396
Fig.1 Weather data of study site (rainfall, rainy days on y1 & temperature on y2 axis).
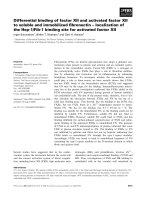
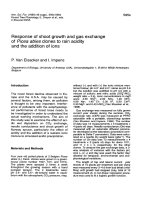
Fig.2 Nitrogen concentration of rice grain and under varying nitrogen rates
1387
Int.J.Curr.Microbiol.App.Sci (2019) 8(9): 1382-1396
Table.1 Growth and yield attributes of rice as affected by its cultivars
Rice hybrid /
variety*
Plant height
(cm) at harvest
Days to 50%
flowering
Days to Panicles/
maturity
m2
123.6c
103a
129 a
274.0b
28P09
b
a
a
110.8
101
125
258.6b
DRRH-3
125.0c
100a
123 a
317.5c
KRH-4
112.7b
100a
126 a
303.7c
WGL-14*
a
a
a
105.3
98
123
223.2a
CARI Dhan-6*
5.15
NS
NS
17.02
CD (P=0.05)
Note: same superscript alphabets represent statistically similar values
Grains
/panicle
123.8c
100.4 a
105.0 ab
108.7b
107.0b
5.11
Test
weight
(g)
19.33b
23.90c
19.91b
16.62 a
25.07c
2.101
Table.2 Grain, biomass yield and harvest index of rice – cultivars
Rice hybrid /
variety*
Yield (t/ha)
Grain
Biomass
2.68 c
8.27 c
28P09
2.36 b
7.32 b
DRRH3
2.91 d
9.02 d
KRH-4
2.32 b
7.19 b
WGL-14*
a
2.09
6.48 a
CARI-6*
0.094
0.374
CD (P=0.05)
Note: same superscript alphabets represent statistically similar values
Table.3 Nitrogen uptake and use efficiency of rice as influenced by cultivars
Hybrid /
Variety*
N uptake (kg/ha) N Harvest
Nitrogen use efficiency*
index
Grain Biomass
AE
PE
AR
UE
bc
c
a
c
d
d
31.91
67.30
47.42
9.42
81.80
28.18
22.90c
28P09
28.67b
60.01b
47.77 a
6.31b
69.23c
19.67c 13.68b
DRRH3
c
d
a
ab
a
35.21
73.62
47.83
4.90
48.34
15.55 b 7.48a
KRH-4
27.69 ab
58.22b
47.56 a
6.00b
69.49c 18.55 c 12.75b
WGL-14*
24.98 a
52.33 a
47.73 a
3.78 a
52.81b 11.83 a 6.22 a
CARI-6*
3.443
5.129
NS
4.01
CD (P=0.05)
*AE: Agronomic efficiency (kg grain/ kg N applied): PE: Physiological efficiency (kg biomass/
kg N uptake): AR: Apparent recovery (%); UE: Utilization Efficiency (kg/kg)
Note: same superscript alphabets represent statistically similar values
1388
Int.J.Curr.Microbiol.App.Sci (2019) 8(9): 1382-1396
Table.4 Economics of rice cultivation and cultivars
Rice hybrid /
variety*
Economics (Rs/ha)
Benefit
Cost
Ratio
Cost of
Gross
Net
cultivation
returns returns
38601
48848
10247c
1.26c
28P09
a
38601
43271
4670
1.12 a
DRRH3
38601
53265
14664d
1.38c
KRH-4
35000
42524
7524b
1.21b
WGL-14*
a
35000
38247
3247
1.09a
CARI Dhan-6*
2008
0.072
CD (P=0.05)
Note: same superscript alphabets represent statistically similar values
Table.5 Growth and yield attributes of rice as affected by nitrogen rates
Nitrogen rate
(kg/ha)
Plant height
(cm) at
harvest
96.9a
113.7 b
124.3 c
127.2 c
7.94
NS
Days to 50%
maturity
Days to
maturity
Panicles/
m2
Grains
/panicle
Test
weight
(g)
20.28 a
21.00 a
21.28 a
21.32 a
NS
NS
94 a
121 a
225.8 a
99.7 a
0
99 ab
124 ab
272.0 b
108.3 b
50
102 b
127 ab
296.1 c
113.2 b
100
105 b
130 b
299.6c
114.8 b
150
7.2
8.0
13.36
7.91
CD (P=0.05)
NS
NS
NS
NS
Interaction
(Cultivar x N)
Note: same superscript alphabets represent statistically similar values; NS: Not significant
Table.6 Grain, biological yield, harvest index of rice as affected by nitrogen rates
Nitrogen rate
(kg/ha)
Yield (t/ha)
Grain
Biological
Harvest
index
2.03 a
6.74 a
30.12 a
0
2.33 b
7.39 b
31.53 ab
50
2.71 c
8.01 c
33.90 c
100
c
c
2.81
8.47
33.20 bc
150
0.145
0.579
2.02
CD (P=0.05)
Note: same superscript alphabets represent statistically similar values
1389
Int.J.Curr.Microbiol.App.Sci (2019) 8(9): 1382-1396
Table.7 Nitrogen uptake and use efficiency of rice under varying nitrogen rates
Nitrogen
rate (kg/ha)
N uptake (kg/ha
N Harvest
Nitrogen use efficiency*
index
Grain Grain
AE
PE
AR
UE
+
(kg/kg) (kg/kg)
(%)
(kg/kg)
Straw
21.86 a 49.02 a
44.59 a
∞
∞
∞
∞
0
28.32 b 59.75b
47.41 ab
6.16b 57.55 a
21.82a 12.56 ab
50
33.33bc 67.33b
49.50 b
6.86c
65.80b
18.37b 12.09b
100
c
bc
b
a
b
35.25
73.08
48.23
5.23
69.55
16.08c 11.20 a
150
7.922
3.942
6.22
CD (P=0.05) 5.367
*AE: Agronomic efficiency (kg grain/ kg N applied): PE: Physiological efficiency (kg biomass/
kg N uptake): AR: Apparent recovery (%); UE: Utilization Efficiency (kg/kg)
Note: same superscript alphabets represent statistically similar values
Table.8 Economics of rice cultivation under varying nitrogen rates
Nitrogen rate
(kg/ha)
Economics (Rs/ha)
Benefit
Cost
Ratio
Cost of
Gross
Net
cultivation returns returns
35745
38006
2241a
1.06 a
0
36589
43044
6535b
1.17b
50
37433
48851
11418c
1.30c
100
c
38277
50965
12688
1.32c
150
3128
0.113
CD (P=0.05)
Note: same superscript alphabets represent statistically similar values
Table.9 Grain yield (t/ha) of rice as influenced by cultivar x nitrogen rate
Rice hybrid / variety*
28P09
DRRH3
KRH 4
WGL 14*
CARI Dhan 6*
SEm±
CD (p=0.05)
abc
Nitrogen rate (kg/ha)
0
50
100
150
1.98aA
2.45cB1
3.04cC
3.22cC
1.93aA
2.32 bcB1
2.57 bC1 2.64 bC1
bA1
dB
2.55
2.79
3.12cC
3.18cC
1.88aA
2.16bB1
2.60 bC1 2.66 bC1
aA
aA
1.80
1.96
2.24 aB1 2.36 aB1
V at same N
V at different N
0.092
0.101
0.188
0.221
denotes V at same N; ABCdenotes V at different N; 1at par yields of N0 and Nx treatments.
Note: same superscript alphabets represent statistically similar values
1390
Int.J.Curr.Microbiol.App.Sci (2019) 8(9): 1382-1396
Table.10 Biomass yield (t/ha) of rice as influenced by cultivar x nitrogen rate
Rice hybrid /
variety*
28P09
DRRH3
KRH 4
WGL 14*
CARI Dhan 6*
Nitrogen rate (kg/ha)
0
50
100
150
b
c
c
6.58
7.75
8.97
9.70 c
6.42ab
7.34bc
7.58b
7.95b
8.48c
8.83 d
9.20 c
9.58c
ab
b
b
6.25
6.83
7.67
8.01b
5.99a
6.20a
6.61a
7.11a
V at same N
V at different N
0.284
0.309
0.579
0.676
SEm±
CD (p=0.05)
abc
denotes V at same N
Note: Same superscript alphabets represent statistically similar values
Table.11 Net income (Rs/ha) of rice as influenced by cultivar x nitrogen rate
Rice hybrid /
variety*
28P09
DRRH3
KRH 4
WGL 14*
CARI Dhan 6*
Nitrogen rate (kg/ha)
0
50
100
150
-99a
7099b 15646c 18343c
-1035a
4699 ab
7186a 7831 ab
b
c
10578
13376
17086c 17618 c
1628a
5347ab 11327b 11794 b
130a
1655a
4847a
6357 a
V at same N
V at different N
1969
2157
SEm±
4016
4721
CD (p=0.05)
ab
denotes V at same N; Same alphabets for data represent at par values
Table.12 Performance of hybrid and variety at recommended nitrogen (2016 season)
Hybrid /
Variety*
Grain Yield (t/ha)
Mean
2015
2016*
2018**
a
a
3.12
5.24
4.15 a
4.17a
KRH-4
a
b
b
2.60
4.31
3.76
3.56b
WGL-14*
0.188
0.519
0.298
0.335
CD (P=0.05)
*CD values based on 20 cultivars trial; **CD values based on 7 cultivars trial
Days to 50% flowering and maturity were
significantly increased with N fertilization
thus 100 and 150 kg N rate have significantly
more values than no N. Nitrogen rates failed
to alter 1000 grain weight of rice markedly.
Interaction effects of variety and N rate on
growth and yield attributes were nonsignificant.
1391
Int.J.Curr.Microbiol.App.Sci (2019) 8(9): 1382-1396
Grain, biomass yield and harvest index
Economics of nitrogen fertilization
Each successive increase of 50 kg N fertilizer
from 0 to 100 kg/ha has significantly pushed
up the grain, biomass yield and harvest index
of rice (Table 6). Nitrogen fertilization (mean
of 50, 100 and 150 kg N) has improved the
grain and biomass yield by 29.7 and 18.2%
over no N control (2.03 and 6.74 t/ha). Grain
(biomass) yield increases have a quadratic
improvement
pattern
i.e.14.8
(9.18),
16.31(8.68) and 3.69% (5.74%) increase with
50, 100 and 150 kg N fertilization over
immediate preceding rate. Harvest index
improved with 100 kg N application over no N
control only. Slight decline in harvest index
was observed with increase in N dose from
100 to 150 kg and this decrease has made it to
have at par values as 50 kg N rate. Grain yield
exhibited linear response as determined by
regression equation: y = 0.272x + 1.79 (y and
x are yield in t/ha and N rate in kg/ha) with a
R2 value of 0.957.
Nitrogen fertilization has significantly altered
the economics (Rs/ha) of rice cultivation
(Table 8). Cost of cultivation increased by
Rs.944 for each 50 kg N fertilization. Net
income and benefit cost ratio increased
significantly with each successive increase of
50 kg N rate up to 100 kg /ha. Application of
150 kg N failed to enhance net income and
BCR values significantly over 100 kg N.
Nitrogen uptake and use efficiency
Nitrogen concentration in grain and straw
were markedly altered by N fertilization
(Figure 2). Application of 50 kg and 150 kg N
has markedly improved N concentration of
grain and straw over no N and 50 kg N,
respectively. Nitrogen uptake of grain,
biomass and N harvest index varied with N
rate (Table 7).
Gran (biomass) N uptake (kg/ha) was
increased by 6.46 (11.09), 5.01 (7.33) and
1.92 (5.75) kg with 50, 100, 150 kg N
application as compared to their immediate
preceding rate. Nitrogen harvest index
increased with N application and thus 100 kg
N rate has markedly higher value than no N
control. All N use efficiency indices increased
with N fertilization. AE and PE values are
highest with 100 and 150 kg N/ha, while AR
and UE was highest at 50 kg N rate.
Cultivar and nitrogen interaction for grain,
biological yield and net income
Grain, biomass yield and net income of rice
differed significantly due to cultivar and N
fertilization interaction (Table 9, Table 10 and
Table 11). All cultivars have significant yield
response to N fertilization up to 100 kg with
the exception that biomass yield of „28P09‟
responded up to 150 kg rate. „KRH-4‟ hybrid
performance without N was as good as
„DRRH-3‟, „WGL-14‟ and „CARI Dhan-6‟
receiving 150 kg N. Its superiority continued
with N fertilization over other varieties with
the exception that „28P09‟ has attained at par
performance as KRH-4 at 100 and 150 kg N
rate. Net income has brought out clear utility
of N fertilization. Without N application, rice
cultivation is economical with „KRH-4‟
hybrid only and at 50 kg N also, it has no
comparable treatment while 3 other cultivars
have moved into profits (CARI Dhan-6
uneconomical). Application of 100 kg N has
brought 28P09 hybrid on at par net income
level as that of KRH-4. Potential performance
of 28P09 was exhibited with N fertilization
only and at 100 kg N, gave its best
performance. CARI Dhan-6 cultivation
became economical with 100 kg N application
only. WGL-14 variety has better economics
than CARI Dhan-6 and DRRH-3 at 100 and
150 kg N. Application of N beyond 100 kg
was wasteful in all cultivars though grain yield
response to N fertilization was linear.
1392
Int.J.Curr.Microbiol.App.Sci (2019) 8(9): 1382-1396
Reassessment of hybrids performance over
HYV
Evaluation of best performing hybrid „KRH-4‟
as compared to a high yielding variety WGL14 at recommended N dose (100 kg/ha) during
2016 and 2018 (Table 12) and the data
indicated consistent and significant yield
improvement over WGL-14 variety. On an
average at 100 kg N application KRH-4 has
17.14% yield advantage over the high yielding
variety This data confirms that even at
recommended dose of nitrogen, hybrids have
exhibited their superiority.
Rice cultivars produced plants with a mean
height of 115.5 cm that have 273.4 panicles/
m2, each panicle had 109 grains and 1000
grains weighed 20.97 g during the year 2015.
Rice hybrids „KRH-4‟ and „28P09‟ have
produced 9.5 and 8.1 cm taller plants than the
mean value of 115.5 cm. On the contrary,
CARI Dhan-6 has 10.2 cm shorter plants than
the mean value. Other two varieties have
similar to mean plant height values. For
panicles//m2, KRH-4 and WGL-14 have
produced 44.1 and 33.1 more numbers than
the mean (273.4) whereas CARI Dhan-6 has
recorded 22% number of panicles than the
mean. Grains/ panicle of 28P09 hybrid was
13.6% higher number of grains than the mean
value (109) and DRRH-3 hybrid has 7.9%
lesser values than the mean. Huge variation
was seen for 1000 grain weight (16.63 25.07g) among cultivars. WGL-14 and CARI
Dhan-6 have -20.7% and 19.6% deviations
from the mean value (20.97 g).
Rice crop has a mean grain, biological yield
(t/ha) and harvest index values of 2.47 7.65
and 32.3, respectively. Taller plants (9.5 cm)
of KRH-4 hybrid coupled with 16.13% higher
number of panicles/m2 (with grains/ panicle
and test weight values at par with mean
values) together has brought in 17.9% higher
(biomass and grain) yields over the mean. rice
hybrid „28P09‟ too on account of 8.1 cm taller
plants and 13.6% higher grains/panicle than
the mean values (with panicles/m2 and 1000
grain weight remained at par with mean
values) have exhibited 8.5 and 8% grain and
biomass yield improvements. Rice variety
„WGL-14‟ despite of producing 11.1% higher
number of panicle/m2, owing to 20.7% lower
1000 grain weight than the mean (20.97 g) has
recorded significantly lower yields (6.1%)
than the mean yield. Similarly, the lower
panicle production of DRRH-3 (5.4%) got
compensated by 18.7% higher seed weight
than the mean has brought its performance at
par with WGL-14. Local improved variety
CARI Dhan-6 remained the poor performer
due to 10.2 cm shorter plants and 25.7% lesser
panicle/m2 production than the mean. Its
heavier grains (19.6% higher than mean)
failed to compensate the lesser panicle/m2 and
thus had 15.4% lower yield than the mean and
thus was a poor performer. In general, rice
crop took 25 day time from 50% flowering
stage to reach physiological maturity. As
cultivars tested belonged to same medium
group of maturity (120-130 days), the
differences remained non significant. Superior
performance of hybrids and varieties over
traditional and local improved variety of the
current study was corroborated by the findings
of Singh et al., (2009) with hybrids and
Sharma et al., (2016) with HYV.
The current experimental research farm site
was located in a place surrounded by forest
trees and the small birds (sparrows) are eating
the grains. As per Forest law, they can‟t be
controlled as comes under protected category.
Current yields reported are such uniformly
bird damaged study. In general, the yields are
25% lower than the actual and yields. In
farmers‟ fields, where paddy is grown in
continuous stretches, yield losses due to birds
was quite lower and in significant as spread
over many fields. Cultivars varied for their N
use efficiency indicators vastly and are highest
with 28P09.
1393
Int.J.Curr.Microbiol.App.Sci (2019) 8(9): 1382-1396
Current experimental site clay loam soil was
low for available nitrogen (258 kg/ha) and was
subjected to heavy rains in August and
September months coinciding with N top
dressings that might have washed the
mineralised N out of the field. Nitrogen
response of rice to N fertiliser was assessed
with uniform recommended P2O5 and K2O
fertilizers (60 kg each) and micronutrient
deficiency and response (iron, zinc etc.) was
not reported. Thus N responses were clearly
captured. Nitrogen nutrition of rice has
enhanced the plant height, panicles/m2 and
grains/panicle production greatly. Plant height
was increased by 16.8, 10.6 and 2.9 cm with
addition of 50, 100 and 150 kg N fertilizer
over their immediate preceding rate. The
figures for panicles /m2 were 46.2, 24.1 and
7.5 and for grains/panicle were 8.6, 4.9 and
1.6. Test weight did not vary much with N
dose. On account of 5.8, 2.8 and 11% higher
panicles /m2, grains/panicle and 1000 grain
weight, N fertilization has increased grain
yields by 25.2% over no N control (2.09 t/ha).
This increase was 15.3, 16.3 and 3.7 with 50,
100 and 150 kg N application over 0, 50 and
100 kg N, respectively. On account of above
increases in yield attributes along with 5.4%
taller plants in N fertilized crop has brought in
17.8% increases in biomass yield than no N
control (6.75 t/ha). Per cent increase in grain
yield was far ahead of biomass yield up to 100
kg N and at 150 kg N, biomass yield surpassed
grain yield increases indicating luxury
consumption of N. Nitrogen fertilization has
increased the time taken for 50% flowering by
8 days as compared no N control (94 days).
Maturity time is increased by 6 days. The
above increases in yields (straw and grain)
have translated into net income and 100 kg N
is ideal. Mean nitrogen harvest index of the
current study are (44.59) is quiet lower than
the reported values of 64% by Fageria and
Baligar (2001). This was ascribed to loss of
25% grain yield by bird damage. Nitrogen
harvest index (NHI) of rice increased in N
fertilized crop by 3.71 as compared to no N
control (44.64). This indicates that for better
yields, a NHI of 49.5 is required that is
attained with 100 kg N fertilization at the
study region. N uptake of rice increased on
account of increased straw / grain yield and
their N concentrations with N dose (Figure 2).
Agronomic efficiency (AE) of N increased
with N fertilization up to 100 kg and thereafter
declined. The grain yield increase was 0.30,
0.38 and 0.11 t/ha for 1st, 2nd and 3rd 50 kg N
addition. The decreasing rate of yield
increases with constant rate of N increase (50
kg) has resulted in decrease in AE.
Physiological Efficiency (PE) dependent on
ratio of biomass increases to N uptake
increases in fertilized plot over no N
application.
Both biomass and N uptake increased with N
fertilization over control and thus have highest
values at 150 kg N application. Apparent
recovery (AR) was highest with 50 kg N
(22.18%) and decreased with increased N rate
to the lowest of 16.12 with 150 kg N on
account of increasing numerator (N dose).
Utilization Efficiency (UE), a product of AR
and PE followed their trend.
Better performance of KRH-4 hybrid even
with no N fertilization of current study may be
ascribed to their larger, deeper, and more
vigorous root systems (Yang and Sun 1986;
Zhang et al., 2009) generated with P and K
fertilizers in current study. The large volume
of roots might have enabled hybrid to draws
more soil N (Hunag et al., 2017) while
fertilizer N contributions remained similar for
a hybrid and high yielding variety. Superior
performance of hybrid (KRH-4) at 100 kg N
dose over WGL-14 variety for 3 seasons
(2015, 2016 and 2018) has confirmed that
hybrids have efficient nutrient absorption and
use mechanisms for higher performance at
both low and optimum dose of nitrogen. This
was proved by studies of Hunag et al., (2017).
1394
Int.J.Curr.Microbiol.App.Sci (2019) 8(9): 1382-1396
From the above study it is concluded that
scope lies for replacing local variety „CARI
Dhan-6‟ by new high yielding cultivars (KRH4 and 28P09) with a yield gain of 28.2-39.2%.
There is linear response to N fertilization up to
150 kg/ha at the site, but 100 kg N was
economically optimum. Cultivar and nitrogen
interaction reveal that scope lies for attaining
current yields with low or no N fertilization by
choosing KRH4 hybrid. KRH-4 and 28P09 are
promising with low and recommended dose of
N, respectively. Above hybrids have exhibited
yield superiority over varieties even at
optimum N dose (100 kg) in experimental
region.
References
Amanullah, M., Natarajan, S., Vanathi, D.,
Ramasamy, S. and Sathyamoorthi, K. 2007.
Lowland rice in coastal saline soils – a
review. Agricultural Science Digest. 28 (4):
235-238.
Courtois, B., Bartholome, D. Chaudhary, G.
McLaren, C.H. Misra, N.P. Mandal, S.
Pandey, T. Paris, C. Piggin, K. Prasad, A.T.
Roy, R.K. Sahu, V.N. Sahu, S. Sarkarung,
S.K. Sharma, A. Singh, H.N. Singh, O.N.
Singh, N.K. Singh, R.K. Singh, R.K. Singh,
S. Singh, P.K. Sinha, B.V.S. Sisodia and R.
Takhur. 2001. Comparing farmers and
breeders rankings in varietal selection for
low-input environments: A case study of
rainfed rice in eastern India. Euphytica. 122:
537–550.
Damodaran, V., Saren, B. K. ; Ravisankar, N. ;
Bommayasamy, N. 2012. Influence of time
of planting, spacing, seedling number and
nitrogen
management
practices
on
productivity, profitability and energetics of
rice (Oryza sativa) in island ecosystem.
Madras Agricultural Journal. 99 (7/9): 538544.
DOES (Directorate of Economics and Statistics).
2018. Agriculture: Major Crops in A&N
Islands. DOES, Andaman and Nicobar
Administration, Port Blair.
DRD (Directorate of Rice Development). 2018.
Hybrid Varieties of Rice in India.
Directorate of Rice Development, Patna.
drdpat.bih.nic.in/
Hybrid-RiceVarieties.htm.
Fageria, N. K. and Baligar, V. C. 2001. Lowland
rice response to nitrogen fertilization.
Communications in Soil Science and Plant
Analysis. 32 (9): 1405-1429.
FAO (Food and Agriculture Organization of the
United Nations). 2004. Hybrid rice for food
security. . org/rice2004/en/fsheet/factsheet6.pdf
Gangaiah, B., Subramani, T., Swain. S.,
Velmurugan, A., Nanada, B.K., Damodaran,
V., Lohit Kumar, K and Hundu, M.S. 2016.
Vulnerability assessment and adaptation led
mitigation strategies of Andaman and
Nicobar islands farming to claimte change.
Pp. 54-55. In: Annual Report 2015-16.,
ICAR- Central Island Agricultural Research
Institute, Port Blair, Andaman and Nicobar
islands.
Ganesh Kumar, B., R. Sendhil, P. Venkatesh, R.
Raja, V. Jayakumar and S. Jeyakumar.
2009. Socio-economic Impact Assessment
of Livelihood Security in Agriculture,
Animal Husbandry and Aquaculture on the
Tsunami-hit
Lands
of
Andaman.
Agricultural Economics Research Review.
22: 483-494.
Gomez, K. A. and Gomez, A. A. 1984. Statistical
Procedures for Agricultural Research. John
Wiley and Sons, Inc. London, UK, (2nd Ed).
Huang, M, Peng Jiang, Shuanglü Shan,Wei Gao,
Guohui
Ma,Yingbin
Zou,
Norman
Uphoff and Longping Yuan. 2017. Higher
yields of hybrid rice do not depend on
nitrogen fertilization under moderate to high
soil fertility conditions. Rice (N Y): 10: 43.
Jackson, M.L. 1973. Soil Chemical Analysis,
Prentice Hall Publication, New Delhi, p.184.
Mandal, A.B., Elanchezhian, R. and Majaumdar,
N.D. 2004. Genetic management for
increased productivity of rice in Andaman
and Nicobar Islands. ICAR- Central
Agricultural Research Institute, Port Blair,
Andaman and Nicobar Islands, 196 p.
Olsen, C.R., Cole, C.V., Wantanabe, F.S. and
Dean, L.A. 1954.Estimationofavailable
phosphorus in soils by extraction with
1395
Int.J.Curr.Microbiol.App.Sci (2019) 8(9): 1382-1396
sodium bicarbonate. USDA Circ. No. 939
Washington. pp. 19.
Shanmugasundaram, B. and Ponnusamy, K.A.
2009. Effect of tsunami on the socioeconomic condition of rice farmers.Indian
Res. J Ext. Edu. 9 (2): 120-124.
Sharma, S. K., Singh, Y.V., Suruchi Tyagi and
Arti Bhatia. 2016. Influence of rice
varieties, nitrogen management and planting
methods on methane emission and water
productivity. Paddy Water Environment,
14:325–333.
Singh, A.K., Birendra Kumar, Baghel, R.S. and
Singh, R.B. 2009 Sustainability of Hybrid
Rice Technology vis a vis Inbred Rice in
Uttar Pradesh. Indian Research Journal of
Extensuon Education. 9 (2): 22-25.
Singh Dhyan, Chhinkar, P.K. and Dwivedi, B.S.
2005. Manual on Soil, Plant and Water
Analysis. Westville Publishing House, New
Delhi.
Singh, P.K., Gautam, R.K., Zamir Ahmed, S.K.,
Singh, K. Awnindra, Sakthivel, K and Dam
Roy S., 2014. Farmers‟ participatory seed
production and adoption of rice varieties in
Andaman and Nicobar Islands: a success
story, Bulletin, CIARI, Port Blair pp.1-32.
Singh, N.T., Mongia, A.D. and Ganeshmurthy,
A.N. 1988. Soils of Andaman and Nicobar
Islands. CARI Technical Bulletin1. 1-64 pp.
Central Agricultural Research Institute, Port
Blair, Andaman & Nicobar Islands.
Subbiah, B.V. and Asija, G.L. 1956. A rapid
procedure for estimation of available
nitrogen in soils. Current Science. 5: 656659.
Subramani, T., Raje, R., Ambast, S.K,
Ravishankar, N., Zamir Ahmed, S.K.,
Damodaran, V. and Bommayasamy. N.
2014. Evaluation of long duration rice
varieties for enhancing productivity and
profitability under Island ecosystem.
Journal of the Andaman Science Association
19(1): 14-18.
Velmurugan, A., Swarnam, T.P. and Rattan Lal.
2015. Effect of land shaping on soil
properties and crop yield in tsunami
inundated coastal soils of Southern
Andaman Island. Agriculture, Ecosystems &
Environment. 206: 1-9.
Yang, X. and Sun, X. 1986. Physiological
characteristics of hybrid rice roots. In:
Hybrid Rice. International Rice Research
Institute, Los Baños, p 281.
Zhang, H., Xue, Y., Wang, Z,, Yang, J. and Zhang,
J. 2009. Morphological and physiological
traits of roots and their relationships with
shoot growth in “super” rice. Field Crops
Research. 13:31–40.
How to cite this article:
Gangaiah, B., Adamala Sirisha, S. Swain and Subramani, T. 2019. Differential Response of
Rice Hybrids and Varieties to Nitrogen Fertilization and their Exploitation in Andaman &
Nicobar Islands. Int.J.Curr.Microbiol.App.Sci. 8(09): 1382-1396.
doi: />
1396