Impact of plant growth promoting rhizobacteria with FYM on the growth, yield attribute and yield of tomato (Lycopersicon esculentum Mill.)
Bạn đang xem bản rút gọn của tài liệu. Xem và tải ngay bản đầy đủ của tài liệu tại đây (329.74 KB, 14 trang )
Int.J.Curr.Microbiol.App.Sci (2019) 8(9): 2219-2232
International Journal of Current Microbiology and Applied Sciences
ISSN: 2319-7706 Volume 8 Number 09 (2019)
Journal homepage:
Original Research Article
/>
Impact of Plant Growth Promoting Rhizobacteria with
FYM on the Growth, Yield Attribute and Yield of
Tomato (Lycopersicon esculentum Mill.)
Gagendra Singh Rajput* and P.W. Ramteke
Department of Biological Sciences, Sam Higginbottom Institute of Agriculture, Technology &
Sciences (Deemed-to be University), Allahabad-211007, India
*Corresponding author
ABSTRACT
Keywords
Tomato, PGPR,
FYM and N.P.K.
Article Info
Accepted:
22 August 2019
Available Online:
10 September 2019
PGPB are free-living soil, rhizosphere, rhizoplane, and phylosphere bacteria that, under
some conditions, are beneficial for plants Most of the activities of PGPB have been studied
in the rhizosphere. PGPB promote plant growth by directly affect the metabolism of the
plants by providing substances that are usually in short supply. The present investigation
was conducted at Department of Biological Sciences, Sam Higginbottom Institute of
Agriculture, Technology and Sciences (Deemed-to-be University) Allahabad, during Rabi
season 2015-16. Tomato plants variety NTL-186 was transplanted in pot during 2 nd week
of Fabuary. The experiment was carried out using 11 treatments with three replication on
completely randomized design. There are five different PGPR are selected namely (PR3,
PR5, PR6, PR24 and PR29) along with FYM 10 t/ha and Fertilizer dose (NPK) 120:60:50
NPK- kg/ha. Results revealed that PGPR strain PR6 along with T 7 [NPK (100%) and
FYM(100%)] showed the highest seed germination (100%), root length of seedling (6.00
cm), shoot length of seedling (6.43cm), plant height 60 DAT (70.10 cm),number of
branches per plant 60 DAT (14.67), number of leaves/plants 60 DAT (50.33), total number
of flowers/ plant (20.33), fresh weight of plant (42.28g/plant) and dry weight of plant
(14.16 g/plant) obtained all the data were statistically significant. From the present
investigation it concluded that T7 (PR6 + NPK (100%) + FYM (100) %) significantly
increased the growth and yield of Tomato (Lycopersicon esculentum Mill.).
Introduction
Tomato (Lycopersicon esculentum Mill.)
belongs to family solanaceae having
chromosome number (2n=24). Officially the
cultivated tomato belongs to the order
Scrophulariales, suborder Solanineae, family
Solanaceae,
tribe
Solaneae,
genus
Lycopersicon, subgenus Eulycopersicon,
species
Lycopersicon
esculentum
(lycopersicon = wolf peach, esculentum =
edible). It is a self pollinated crop and PeruEquador region is considered to be the centre
of origin. it can also be identified as Solanum
lycopersicon, as originally classified by
Linnaeus in 1753, because of the similarity
2219
Int.J.Curr.Microbiol.App.Sci (2019) 8(9): 2219-2232
between tomatoes and potatoes. Tomato was
introduced by the Portuguese. This fruit
contains a variety of micro components, such
as lycopene (an antioxidant), potassium,
vitamins (A, C, E and K), sucrose and folic
acid (Peralta and spooner, 2007). The tomato
(Lycopersicum esculentum Mill.) is an
important vegetable crop worldwide. Tomato
being an important vegetable crop and photoperiod insensitive and can be cultivated
throughout the year. Its cultivation has spread
throughout the world occupying an area of
3.5×10⁶ ha with the production of 1×10⁶ tons
(FAO, 2010). In India, it occupies an area of
0.54 million ha with a production of 7.60
million tons with an average yield of 14.074
tons ha-1 (Anonymous, 2006). (Ramakrishnan
and Selvakumar, 2012). Tomatoes contribute
to a healthy, well-balanced diet. They are rich
in minerals, vitamins, essential amino acids,
sugars and dietary fibres. Tomato contains
much vitamin B and C, iron and phosphorus.
Tomato fruits are consumed fresh in salads or
cooked in sauces, soup and meat or fish
dishes. They can be processed into purées,
juices and ketchup. Canned and dried
tomatoes
are
economically
important
processed products. Yellow tomatoes have
higher vitamin A content than red tomatoes,
but red tomatoes contain lycopene, an antioxidant that may contribute to protection
against carcinogenic substances. (Naika et al.,
2005).
Plant growth-promoting bacteria (PGPB) are
defined as free-living soil, rhizosphere,
rhizoplane, and phylosphere bacteria that,
under some conditions, are beneficial for
plants Most of the activities of PGPB have
been studied in the rhizosphere, and to lesser
extent on the leaf surface; endophytic PGPB
that reside inside the plant have also been
found. PGPB promote plant growth in two
different ways: (1) They directly affect the
metabolism of the plants by providing
substances that are usually in short supply.
These bacteria are capable of fixing
atmospheric
nitrogen,
of
solubilizing
phosphorus and iron, and of producing plant
hormones, such as auxins, gibberellins,
cytokinins, and ethylene. Additionally, they
improve a plant's tolerance to stresses, such as
drought, high salinity, metal toxicity, and
pesticide load. One or more of these
mechanisms may contribute to the increases
obtained in plant growth and development that
are higher than normal for plants grown under
standard cultivation conditions. However,
these bacteria do not enhance the genetic
capacity of the plant, as genetic material is not
transferred. (2) A second group of PGPB,
referred to as biocontrol-PGPB, indirectly
promote plant growth by preventing the
deleterious effects of phytopathogenic
microorganisms (bacteria, fungi, and viruses).
They produce substances that harm or inhibit
other microbes, but not plants. (Hillel., 2005).
It is well known that rhizosphere and soil
microorganisms (PGPR) play an important
role in maintaining crop and soil health
through versatile mechanisms: nutrient cycling
and uptake, suppression of plant pathogens,
induction of resistance in plant host, direct
stimulation of plant growth (Kloepper and
Schroth 1981) Plant Growth Promoting
Rhizobacteria
(PGPR),
especially
Pseudomonas fluorescens (Pf1, Py15 and Fp7)
strains have been developed commercially as a
talc based formulation and tested against
several crop diseases (Kavino et al.,2007)
Several approaches have been tried for the
sustainable management of early blight in
tomato.
However, no attempts have been made for the
management of early blight disease with
PGPR strains. Therefore, the present study
was designed to evaluate protective effect of
PGPR strains (Pseudomonas spp.) against
tomato early blight disease caused by A.
solani. (Maurya et al., 2015).
2220
Int.J.Curr.Microbiol.App.Sci (2019) 8(9): 2219-2232
Organic manuring is becoming an important
component
of
environmentally
sound
Sustainable agriculture. Residual nature of
organic sources makes them more value based
for the whole system compared to individual
crops. Organic materials hold great promise as
a source of multiple nutrients and ability to
improve soil characteristics. Recently, the use
of organic materials as fertilizers for crop
production has received attention for
sustainable crop productivity. In organic
production system, organic wastes and other
biological materials, as available in situ are
utilized along with beneficial microbes to
release the nutrients to crops. (Jenny and
Malliga, 2016). Farm Yard Manure (FYM) is
the manure produced in the farm which is
made up of excreta (dung and urine) of farm
animals, the bedding materials provided for
them and miscellaneous farm and house hold
wastes. The bedding material is called „litter‟
and it absorbs urine voided by animals. It is
not a standardized product and its value
depends on the kind of feed fed to the animal,
the amount of straw used and the manner of
storage. FAO defined organic agriculture as a
unique production management system which
promotes and enhances agro-ecosystem
health, including biodiversity, biological cycle
and soil biological activity, and this is
accomplished by using on-farm agronomic,
biological and mechanical methods in
exclusion of all synthetic off-farm inputs.
However making available all the essential
nutrients for plant growth and maintaining a
living soil to achieve sustainable yield is
challenging task. Organic agriculture in short
term, produces lower crop yields but in the
long-term it may produce higher yields.
(Chatterjee and Thirumdasu, 2014). Keeping
all this point in mind present investigation
were made to see effect of PGPR (PR3, PR5,
PR6, PR24 and PR29) and FYM on growth
and yield parameter of Tomato (Lycopersicon
esculentum Mill.).
Materials and Methods
Site descriptions
The pot experiment was conducted during
year 2015-16 at in the month of January to
April in Department of Biological Sciences,
Allahabad School of Agriculture SHIATS,
Allahabad. Allahabad is situated in the agroclimatic zone (Sub-tropical belt) of Uttar
Pradesh. The Geographical area falls under
sub-tropical climate and is located in between
25.870 North latitude and 81.250 E longitudes
at an altitude of 98 meter above the mean sea
level (MSL). The area of Allahabad district
comes under sub tropical belt in the south
eastern Uttar Pradesh, which experience
extremely hot summer and fairly cold winter.
The maximum temperature of the location
reaches up to 460 C to 480C and seldom falls
as low as 40 C to 50 C. The Relative humidity
ranged between 20 to 94 %. The average
rainfall in this area is around 850-1100 mm
annually.
Experiment and treatment details
Soil is collected from the surface (0-15 cm) in
the field, (unless you are looking at sub-soil
properties). The soil is then sieved through a
screen or plastic sieve with a mesh of
approximately 5 mm openings to remove
rocks, clods and large pieces of organic matter
uniform soil mixture within about 3-4 cm of
the top of the pot. Only healthy and uniform
seedlings were transplanted in the evening.
Seedlings were transplanted 3-4 cm deep in
pots. Three seedlings per pot were
transplanted. Light irrigation given after
completion of transplanting. The experiment
was conducted with three replication in
randomized block design along with eleven
treatments (Table 1) with five selected PGPR
namely (PR3, PR5, PR6, PR24 and
PR29Tomato plant verity NTL-186 was
transplanted in pot in rabi season on second
2221
Int.J.Curr.Microbiol.App.Sci (2019) 8(9): 2219-2232
week of February 2016. The organic manure
applied was FYM 10 t/ha were well
incorporated in the experimental (pots) field
10 days before transplanting of seedling.
According to the treatment the NPK fertilizer
(NPK 120:60:50kg/ha) are applied before
transplanting. The treatment combination of
PGPR with FYM and NPK are presented in
table 2.
Growth and Yield observations
The percent germination was calculated by
following formula. Controls seeds without
bacterial cultures were used for comparison.
The root and shoot elongation was measured
at interval of 3 days up to 11 days
Seed germination %
= No of germinated seed x 100
No of total seeds
Root length of seedling in Measuring scale on
3, 5, 7 and 9 days and divide them by 5. Shoot
length of seedling measuring scale on 3, 5, 7
and 9 days and divide them by 5. The height
of three randomly selected plants from each
pot was measured with the help of measuring
tape from soil surface up to the leaf peak,(cm)
in natural condition at 60 days after
transplanting. The average height of plant of
each replication was recorded and subjected to
statistical analysis. The branches of three
randomly selected plants from each pot was
measured at 60 days after transplanting. The
average Number of branches per plant of each
replication was recorded and subjected to
statistical analysis. All the leaves from three
selected plants from each replication of all the
treatments were counted at 60 days after
transplanting. The average number of leaves
per plant of each replication was recorded and
subjected to statistical analysis. All the
flowers from three selected plants from each
replication of all the treatments were counted
at 40 days after transplanting. The average
number of flowers per plant of each
replication was recorded and subjected to
statistical analysis. All the fruits from three
selected plants from each replication of all the
treatments were counted at 60 days after
transplanting. The average total number of
fruits per plant of each replication was
recorded and subjected to statistical analysis.
All the fresh fruits from three selected plants
from each replication of all the treatments
were weight after picking. The average fresh
fruits weight per plant of each replication was
recorded and subjected to statistical analysis.
Fresh weight of the three selected plants were
recorded in each pot and average fresh weight
was calculated. This calculated value was
assumed as average weight of the rest of
remaining plant per-pot. We have took the
same plant taken for fresh weight form every
treatment for dry weight and dried in the drier
for dehydration. It was dried for 5-6 hours at
the temperature of 50-600C. The dry weights
of all randomly selected plant in each pot were
added together and average calculated.
Statistical analysis
In the present experiment, completely
randomized design (CRD) was applied. The
analysis of variance technique was applied for
drawing conclusions from the data. The
calculated value of F was compared with
tabulated value at 5% level of probability for
the appropriate degree of freedom (Fisher
1950).
Results and Discussion
Growth parameters
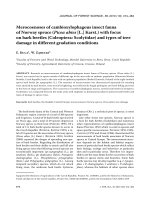
Figure 1 shows that various treatment
combinations significantly influenced the
germination (%) in treatment T3 (PR6)
germination (%) was highest (100%) followed
by (90%) T5 (PR29). The lowest germination
found in T0 (control) (60%). Table 1 shows
2222
Int.J.Curr.Microbiol.App.Sci (2019) 8(9): 2219-2232
that
various
treatment
combinations
significantly influenced the Root length of
seedling (cm) in treatment T3 (PR6) Root
length (cm) was highest (6.00 cm) followed by
(5.80cm) T5 (PR29). The lowest root length of
seedling (cm) found in T0 (control) (4.20cm)
Table 2 shows that various treatment
combinations significantly influenced the
Shoot length of Seedling (cm) in treatment T3
(PR6) Shoot length of Seedling (cm) was
highest (6.43 cm) followed by (6.23 cm) T5
(PR29). The lowest Shoot length of Seedling
(cm) found in T0 (control) (5.13 cm). In pot
culture, and field trials P. fluorescence (SS5)
enhanced the growth of tomato plants.
Significant increase in root and shoot weight,
length, fruit yield per plant, and total fruit
yield was recorded. The strain SS5 was
significantly rhizospheric competent and
stabilized in the rhizosphere, without
disturbing thenormal indigenous bacterial
population. Ahirwar, et al., (2015)
The results pertaining of the effect applied
through different PGPRs (PR3, PR5, PR6,
PR24 and PR29) on plant height of Tomato
are graphically presented in Table 3 at 60
DAT. PR3- PGPRs (PR3) application
significantly influenced the plant height (cm)
over control. Table 3 reveals that the
maximum plant height (cm) (65.82cm) was
recorded with T7 (PR3+NPK 100%+FYM
100%) followed by (64.94cm) in T8
(PR3+NPK 100%+FYM 75%) i.e. which were
significantly higher than other treatment. The
lowest plant height (cm) (48.82 cm) was
observed in treatment T0 (control). PR5PGPRs (PR5) application significantly
influenced the plant height (cm) over control.
Table 3 reveals that the maximum plant height
(cm) (67.04cm) was recorded with T7
(PR5+NPK 100%+FYM 100%) followed by
(66.71cm) in T8 (PR5+NPK 100%+FYM
75%) i.e. which were significantly higher than
other treatment. The lowest plant height (cm)
(48.82 cm) was observed in treatment T0
(control). PR24-PGPRs (PR24) application
significantly influenced the plant height (cm)
over control. Table 3 reveals that the
maximum plant height (cm) (66.39 cm) was
recorded with T7 (PR24+NPK 100%+FYM
100%) followed by (65.74 cm) in T8
(PR24+NPK 100%+FYM 75%) i.e. which
were significantly higher than other treatment.
The lowest plant height (cm) (48.82 cm) was
observed in treatment T0 (control). PR29PGPRs (PR29) application significantly
influenced the plant height (cm) over control.
Table 3 reveals that the maximum plant height
(cm) (68.39 cm) was recorded with T7
(PR29+NPK 100%+FYM 100%) followed by
(66.85 cm) in T8 (PR29+ NPK 100% FYM
75%) i.e. which were significantly higher than
other treatment. The lowest plant height (cm)
(48.82 cm) was observed in treatment T0
(control).
The results pertaining of the effect applied
through different PGPRs (PR3, PR5, PR6,
PR24 and PR29) on number of branches of
Tomato are graphically presented in Table 4.
PGPRs (PR3) application significantly
influenced the number of branches over
control. Table 4 reveals that the maximum
number of branches (11.33) was recorded with
T7 (PR3+NPK 100%+FYM 100%) followed
by (10.33) in T8 (PR3+NPK 100%+FYM
75%) i.e. which were significantly higher than
other treatment. The lowest number of
branches (7.00) was observed in treatment T0
(control).
PGPRs
(PR5)
application
significantly influenced the number of
branches over control. Table 4 reveals that the
maximum number of branches (12.00) was
recorded with T7 (PR5+NPK 100%+FYM
100%) followed by (11.33) in T8 (PR5+NPK
100%+FYM 75%) i.e. which were
significantly higher than other treatment. The
lowest number of branches (7.00) was
observed in treatment T0 (control). PGPRs
(PR6) application significantly influenced the
2223
Int.J.Curr.Microbiol.App.Sci (2019) 8(9): 2219-2232
number of branches over control. Table 4
reveals that the maximum number of branches
(14.67) was recorded with T7 (PR6+NPK
100%+FYM 100%) followed by (12.33) in T8
(PR6+NPK 100%+FYM 75%) i.e. which were
significantly higher than other treatment. The
lowest number of branches (7.00) was
observed in treatment T0 (control). Results of
the current study showed the positive impacts
of P. fluorescence on growth of tomato plant
(number of branches per plant) compared to
control. So as a simple and safe method, the
seeds of tomato plant before planting can be
inoculated
with
P.
fluorescence
to
improvement plant growth efficiency. It
appears that can lead to improve quantity and
quality of tomato (Lycopersicon esculentum)
plant by accumulation of organic and
inorganic components. Ahirwar et al.,(2015).
significantly higher than other treatment. The
lowest number of leaves/plants (36.00) was
observed in treatment T0 (control). PGPRs
(PR24) application significantly influenced the
number of leaves/plants over control. Table 5
reveals that the maximum number of leaves
/plants (48.00) was recorded with T7
(PR24+NPK 100%+FYM 100%) followed by
(45.33) in T8 (PR24+NPK 100%+FYM 75%)
i.e. which were significantly higher than other
treatment. The lowest number of leaves /plants
(36.00) was observed in treatment T0 (control).
Bacterial
inoculations
(Azospirillum)
improved the Tomato growth and growth
parameters. The performance of the plants was
better in inoculated treatments in comparison
to the control(Kannahi and Ramya., 2015).
PGPRs (PR3) application significantly
influenced the number of leaves/plants over
control. Table 5 reveals that the maximum
number of leaves/plants (47.33) was recorded
with T7 (PR3+NPK 100%+FYM 100%)
followed by (45.00) in T8 (PR3+NPK
100%+FYM 75%) i.e. which were
significantly higher than other treatment. The
lowest number of leaves/plants (36.00) was
observed in treatment T0 (control). PGPRs
(PR5) application significantly influenced the
number of leaves/plants over control. Table 5
reveals that the maximum number of
leaves/plants (48.67) was recorded with T7
(PR5+NPK 100%+FYM 100%) followed by
(46.00) in T8 (PR5+NPK 100%+FYM 75%)
i.e. which were significantly higher than other
treatment. The lowest number of leaves/plants
(36.00) was observed in treatment T0 (control).
PGPRs (PR6) application significantly
influenced the number of leaves/plants over
control. Table 5 reveals that the maximum
number of leaves/plants (50.33) was recorded
with T7 (PR6+NPK 100%+FYM 100%)
followed by (47.67) in T8 (PR6+NPK
100%+FYM 75%) i.e. which were
PGPRs (PR3) application significantly
influenced the number of flowers/plants over
control. Table 6 reveals that the maximum
number of flowers/plants (17.00) was recorded
with T7 (PR3+NPK 100%+FYM 100%)
followed by (15.33) in T8 (PR3+NPK
100%+FYM 75%) i.e. which were
significantly higher than other treatment. The
lowest number of flowers/plants (9.33) was
observed in treatment T0 (control). PGPRs
(PR5) application significantly influenced the
number of flowers/plants over control. Table
4.7 and fig 4.7 reveals that the maximum
number of flowers/plants (18.00) was recorded
with T7 (PR5+NPK 100%+FYM 100%)
followed by (17.00) in T8 (PR5+NPK
100%+FYM 75%) i.e. which were
significantly higher than other treatment. The
lowest number of flowers/plants (9.33) was
observed in treatment T0 (control). PGPRs
(PR6) application significantly influenced the
number of flowers/plants over control. Table 6
reveals that the maximum number of
flowers/plants (20.33) was recorded with T7
(PR6+NPK 100%+FYM 100%) followed by
(18.33) in T8 (PR6+NPK 100%+FYM 75%)
Yield and yield attributes
2224
Int.J.Curr.Microbiol.App.Sci (2019) 8(9): 2219-2232
i.e. which were significantly higher than other
treatment.
The
lowest
number
of
flowers/plants (9.33) was observed in
treatment T0 (control). PGPRs (PR24)
application significantly influenced the
number of flowers/plants over control. Table 6
reveals that the maximum number of
flowers/plants (17.67) was recorded with T7
(PR24+NPK 100%+FYM 100%) followed by
(15.67) in T8 (PR24+NPK 100%+FYM 75%)
i.e. which were significantly higher than other
treatment.
The
lowest
number
of
flowers/plants (9.33) was observed in
treatment T0 (control). PGPRs (PR29)
application significantly influenced the
number of flowers/plants over control. Table 6
reveals that the maximum number of
flowers/plants (18.67) was recorded with T7
(PR23+NPK 100%+FYM 100%) followed by
(17.33) in T8 (PR23+ NPK 100% FYM 75%)
i.e. which were significantly higher than other
treatment.
The
lowest
number
of
flowers/plants (9.33) was observed in
treatment T0 (control).
PGPRs (PR3) application significantly
influenced the number of fruit/plant over
control. Table 7 reveals that the maximum
number of fruit/plant (13.67) was recorded
with T7 (PR3+NPK 100%+FYM 100%)
followed by (12.67) in T8 (PR3+NPK
100%+FYM 75%) i.e. which were
significantly higher than other treatment. The
lowest number of fruit/plant (7.00) was
observed in treatment T0 (control). PGPRs
(PR5) application significantly influenced the
number of fruit/plant over control. Table 4.8
and fig 4.8 reveals that the maximum number
of fruit/plant (14.67) was recorded with T7
(PR5+NPK 100%+FYM 100%) followed by
(13.67) in T8 (PR5+NPK 100%+FYM 75%)
i.e. which were significantly higher than other
treatment. The lowest number of fruit/plant
(7.00) was observed in treatment T0 (control).
PGPRs (PR6) application significantly
influenced the number of fruit/plant over
control. Table 4.8 and fig 4.8 reveals that the
maximum number of fruit/plant (17.00) was
recorded with T7 (PR6+NPK 100%+FYM
100%) followed by (14.67) in T8 (PR6+NPK
100%+FYM 75%) i.e. which were
significantly higher than other treatment. The
lowest number of fruit/plant (7.00) was
observed in treatment T0 (control). PGPRs
(PR24) application significantly influenced the
number of fruit/plant over control. Table 4.8
and fig 4.8 reveals that the maximum number
of fruit/plant (14.00) was recorded with T7
(PR24+NPK 100%+FYM 100%) followed by
(13.33) in T8 (PR24+NPK 100%+FYM 75%)
i.e. which were significantly higher than other
treatment. The lowest number of fruit/plant
(7.00) was observed in treatment T0 (control).
PGPRs (PR29) application significantly
influenced the number of fruit/plant over
control. Table 4.8 and fig 4.8 reveals that the
maximum number of fruit/plant (15.00) was
recorded with T7 (PR29+NPK 100%+FYM
100%) followed by (14.00) in T8 (PR23+ NPK
100% FYM 75%) i.e. which were significantly
higher than other treatment. The lowest
number of fruit/plant (7.00) was observed in
treatment T0 (control). In pot culture and field
trials P. fluorescence (SS5) enhanced the
growth of tomato plants. Significant increase
in root and shoot weight, length, fruit yield per
plant, and total fruit yield was recorded. The
strain SS5 was significantly rhizopheric
competent and stabilized in the rhizosphere,
without disturbing the normal indigenous
bacterial population. Ahirwar, et al., (2015).
PGPRs (PR3) application significantly
influenced the fresh fruit weight (g/plant) over
control. Table 8 reveals that the maximum
fruit weight (g/plant) (647.00 g) was recorded
with T7 (PR3+NPK 100%+FYM 100%)
followed by (556.67g) in T8 (PR3+NPK
100%+FYM 75%) i.e. which were
significantly higher than other treatment. The
lowest fruit weight (gm) (353.33) was
observed in treatment T0 (control). PGPRs
(PR5) application significantly influenced the
fresh fruit weight (g/plant) over control.
2225
Int.J.Curr.Microbiol.App.Sci (2019) 8(9): 2219-2232
Table.1 Treatment details
S.No
Treatments
Recommended Dose
Applied to Soil (t/ha)
1
PGPR
------------
2
FYM
10 t/ha
Seed treatment -1.0% volume
for 5-10min
Seed treatment -1.0 % volume
for
5-10 min + 50 % of
recommended doses all organic
sources and inorganic fertilizer
3
NPK
120:60:50 kg/ha
Table.2 Treatment combination of PGPR with FYM and NPK
S.No Tr.
Treatments
1
T0
PR3
Control
PR5
Control
PR6
CONTROL
PR24
CONTROL
PR29
CONTROL
2
T1
PGPR
PGPR
PGPR
PGPR
PGPR
3
T2
PGPR+NPK
PGPR+NPK
PGPR+NPK
PGPR+NPK
PGPR+NPK
4
T3
5
T4
6
T5
7
T6
8
T7
9
T8
10
T9
11
T10
PGPR+FYM
(100%)
PGPR+FYM
(75%)
PGPR+FYM
(50%)
PGRR+FYM
(25%)
PGPR+NPK
(100%)+FYM
(100%)
PGPR+NPK
(100%)+FYM
(75%)
PGPR+NPK
(100%)+FYM
(50%)
PGPR+NPK
(100%)+FYM
(25%)
PGPR+FYM
(100%)
PGPR+FYM
(75%)
PGPR+FYM
(50%)
PGRR+FYM
(25%)
PGPR+NPK
(100%)+FYM
(100%)
PGPR+NPK
(100%)+FYM
(75%)
PGPR+NPK
(100%)+FYM
(50%)
PGPR+NPK
(100%)+FYM
(25%)
PGPR+FYM
(100%)
PGPR+FYM
(75%)
PGPR+FYM
(50%)
PGRR+FYM
(25%)
PGPR+NPK
(100%)+FYM
(100%)
PGPR+NPK
(100%)+FYM
(75%)
PGPR+NPK
(100%)+FYM
(50%)
PGPR+NPK
(100%)+FYM
(25%)
PGPR+FYM
(100%)
PGPR+FYM
(75%)
PGPR+FYM
(50%)
PGRR+FYM
(25%)
PGPR+NPK
(100%)+FYM
(100%)
PGPR+NPK
(100%)+FYM
(75%)
PGPR+NPK
(100%)+FYM
(50%)
PGPR+NPK
(100%)+FYM
(25%)
PGPR+FYM
(100%)
PGPR+FYM
(75%)
PGPR+FYM
(50%)
PGRR+FYM
(25%)
PGPR+NPK
(100%)+FYM
(100%)
PGPR+NPK
(100%)+FYM
(75%)
PGPR+NPK
(100%)+FYM
(50%)
PGPR+NPK
(100%)+FYM
(25%)
2226
Int.J.Curr.Microbiol.App.Sci (2019) 8(9): 2219-2232
Table.3 Effect of PGPRs (PR3, PR5, PR6, PR24 and PR29) on Root length of seedling of
Tomato cv.NTL-186
Tr. No.
T0
T1
T2
T3
T4
T5
Treatments
Control
PR3
PR5
PR6
PR24
PR29
CD (0.05 %)
Root length of seedling (cm)
4.20
4.73
5.33
6.00
4.97
5.80
0.24
Table.4 Effect of PGPRs (PR3, PR5, PR6, PR24 and PR29) on Shoot length of Seedling of
Tomato cv.NTL-186
Tr. No.
T0
T1
T2
T3
T4
T5
Treatment
Control
PR3
PR5
PR6
PR24
PR29
CD (0.05 %)
Shoot length of seedling (cm)
5.13
5.43
5.80
6.43
5.63
6.23
0.35
Table. 5 Effect of PGPRs (PR3, PR5, PR6, PR24 and PR29) on Plant height at 60 DAT of
Tomato cv.NTL-186
Tr.
Treatments
control
T0
PGPR
T1
PGPR+NPK (100%)
T2
PGPR+FYM (100%)
T3
PGPR+FYM (75%)
T4
PGPR+FYM (50%)
T5
PGPR+FYM (25%)
T6
PGPR+NPK+FYM (100%)
T7
PGPR+NPK+FYM (75%)
T8
PGPR+NPK+FYM (50%)
T9
PGPR+NPK+FYM (25%)
T10
CD (0.05 %)
PR3
48.82
54.57
56.67
60.10
59.13
58.43
57.67
65.82
64.94
63.32
62.67
2.75
2227
Plant height (cm)
PR5
PR6
PR24
48.82
48.82
48.82
56.33
60.80
55.47
58.23
63.20
57.83
63.17
65.00
62.45
62.67
64.37
61.70
60.50
62.17
59.80
59.73
61.70
59.03
67.04
70.10
66.39
66.71
68.29
65.74
65.34
67.07
64.63
64.53
66.27
63.60
1.83
2.01
1.75
PR29
48.82
57.50
62.37
63.41
62.91
61.38
60.45
68.39
66.85
65.24
64.70
2.33
Int.J.Curr.Microbiol.App.Sci (2019) 8(9): 2219-2232
Table.6 Effect of PGPRs (PR3, PR5, PR6, PR24 and PR29) on number of branches at 60 DAT
of Tomato cv.NTL-186
Number of branches per plant
Tr.
Treatments
CONTROL
T0
PGPR
T1
PGPR+NPK (100%)
T2
PGPR+FYM (100%)
T3
PGPR+FYM (75%)
T4
PGPR+FYM (50%)
T5
PGPR+FYM (25%)
T6
PGPR+NPK+FYM(100%)
T7
PGPR+NPK+FYM(75%)
T8
PGPR+NPK+FYM(50%)
T9
PGPR+NPK+FYM(25%)
T10
CD (0.05 %)
PR3
7.00
8.00
8.33
9.00
8.67
8.00
7.67
11.33
10.33
10.00
9.67
1.28
PR5
7.00
8.67
9.00
9.67
9.33
8.33
8.00
12.00
11.33
10.67
10.33
0.78
PR6
7.00
9.67
10.00
10.67
9.67
9.33
9.00
14.67
12.33
12.00
11.33
1.10
PR24
7.00
8.33
8.67
9.33
9.00
8.33
8.00
11.67
10.67
10.33
10.00
0.98
PR29
7.00
9.00
9.33
10.00
9.33
8.67
8.33
12.67
11.67
11.33
11.00
0.98
Table.7 Effect of PGPRs (PR3, PR5, PR6, PR24 and PR29) on Number of leaves /plants at 60
DAT of Tomato (Solanum lycopersicum L.Mill.) cv.NTL-186
Tr.
Treatments
CONTROL
T0
PGPR
T1
PGPR+NPK (100%)
T2
PGPR+FYM (100%)
T3
PGPR+FYM (75%)
T4
PGPR+FYM (50%)
T5
PGPR+FYM (25%)
T6
PGPR+NPK+FYM(100%)
T7
PGPR+NPK+FYM(75%)
T8
PGPR+NPK+FYM(50%)
T9
PGPR+NPK+FYM(25%)
T10
CD (0.05 %)
Number of leaves per plants
PR3
PR5
PR6
PR24
PR29
36
38
38.33
40
39.67
39.33
38
47.33
45
44
41.33
1.80
36
38.67
39
41
40.67
40
38.67
48.67
46
45
43.67
1.18
36
39.67
40
43.33
42.33
41.67
39.67
50.33
47.67
46.33
45
2.60
36
38.33
38.67
40.67
40
39.67
38.33
48
45.33
44.67
42
1.21
36
39
39.67
42.67
42
40.33
39
49.33
47
45.33.
44.33
1.64
2228
Int.J.Curr.Microbiol.App.Sci (2019) 8(9): 2219-2232
Table.8 Effect of PGPRs (PR3, PR5, PR6, PR24 and PR29) on Number of flowers/plants at 60
DAT of Tomato cv.NTL-186
Number of flowers per plants
Tr.
Treatments
control
T0
PGPR
T1
PGPR+NPK (100%)
T2
PGPR+FYM (100%)
T3
PGPR+FYM (75%)
T4
PGPR+FYM (50%)
T5
PGPR+FYM (25%)
T6
PGPR+NPK+FYM(100%)
T7
PGPR+NPK+FYM(75%)
T8
PGPR+NPK+FYM(50%)
T9
PGPR+NPK+FYM(25%)
T10
CD (0.05 %)
PR3
9.33
11.00
11.67
12.33
12.00
11.67
11.33
17.00
15.33
14.33
13.67
0.83
PR5
9.33
12.00
12.67
13.67
13.33
13.00
12.67
18.00
17.00
16.00
15.00
0.66
PR6
9.33
12.67
14.00
15.00
14.33
14.00
13.67
20.33
18.33
17.67
16.33
0.97
PR24
9.33
11.67
12.00
13.00
12.67
12.00
11.33
17.67
15.67
15.00
14.33
0.83
PR29
9.33
12.33
13.00
14.33
13.67
13.33
13.00
18.67
17.33
16.33
15.33
1.44
Table.9 Effect of PGPRs (PR3, PR5, PR6, PR24 and PR29) on number of fruit/plant of Tomato
cv.NTL-186
Number of fruit per plant
Tr.
Treatments
control
T0
PGPR
T1
PGPR+NPK (100%)
T2
PGPR+FYM (100%)
T3
PGPR+FYM (75%)
T4
PGPR+FYM (50%)
T5
PGPR+FYM (25%)
T6
PGPR+NPK+FYM(100%)
T7
PGPR+NPK+FYM(75%)
T8
PGPR+NPK+FYM(50%)
T9
PGPR+NPK+FYM(25%)
T10
CD (0.05 %)
PR3
PR5
PR6
PR24
PR29
7.00
8.00
8.67
10.33
10.00
9.67
9.33
13.67
12.67
12.00
11.00
1.22
7.00
9.00
9.33
11.33
11.00
10.67
10.00
14.67
13.67
12.67
12.00
1.18
7.00
9.67
10.00
12.33
12.00
11.67
11.00
17.00
14.67
13.33
12.67
1.44
7.00
8.67
9.00
11.00
10.33
10.33
9.67
14.00
13.33
12.33
11.67
1.72
7.00
9.33
9.67
11.67
11.33
11.33
10.67
15.00
14.00
13.00
12.33
1.35
2229
Int.J.Curr.Microbiol.App.Sci (2019) 8(9): 2219-2232
Table.10 Effect of PGPRs (PR3, PR5, PR6, PR24 and PR29) on Fresh fruit weight of Tomato
(Solanum lycopersicum L.Mill.) cv.NTL-186
Fresh Fruit weight (g/plant)
Tr.
Treatments
CONTROL
T0
PGPR
T1
PGPR+NPK (100%)
T2
PGPR+FYM (100%)
T3
PGPR+FYM (75%)
T4
PGPR+FYM (50%)
T5
PGPR+FYM (25%)
T6
PGPR+NPK+FYM(100%)
T7
PGPR+NPK+FYM(75%)
T8
PGPR+NPK+FYM(50%)
T9
PGPR+NPK+FYM(25%)
T10
CD (0.05 %)
PR3
PR5
PR6
PR24
PR29
353.33
363.67
393.33
411.67
371.67
377.00
358.33
647.00
556.67
510.00
445.33
52.74
353.33
366.67
408.67
421.00
386.67
381.67
371.00
682.33
597.33
534.67
471.67
72.20
353.33
376.67
441.67
462.67
421.00
405.00
399.00
718.33
619.67
555.67
513.67
31.00
353.33
364.33
407.33
417.00
375.33
378.67
362.67
661.00
577.33
520.67
461.33
67.71
353.33
370.00
420.00
443.00
407.67
391.67
379.33
690.00
602.67
548.33
502.00
61.14
Table.11 Effect of PGPRs (PR3, PR5, PR6, PR24 and PR29) on fresh weight of plant of Tomato
(Solanum lycopersicum L.Mill.) cv.NTL-186
Tr.
Treatments
Control
T0
PGPR
T1
PGPR+NPK (100%)
T2
PGPR+FYM (100%)
T3
PGPR+FYM (75%)
T4
PGPR+FYM (50%)
T5
PGPR+FYM (25%)
T6
PGPR+NPK+FYM(100%)
T7
PGPR+NPK+FYM(75%)
T8
PGPR+NPK+FYM(50%)
T9
PGPR+NPK+FYM (25%)
T10
CD (0.05 %)
PR3
24.33
27.55
29.20
30.88
29.87
29.52
29.18
39.08
35.29
33.72
32.01
2.33
2230
Fresh weight of plant (g/plant)
PR5
PR6
PR24
24.33
24.33
24.33
28.33
28.77
27.97
29.80
30.63
29.33
31.64
32.63
31.08
30.99
31.91
30.33
30.08
30.99
29.91
29.92
30.44
29.64
40.10
42.28
39.50
36.99
38.42
35.67
35.00
36.19
34.12
33.91
34.45
33.03
2.27
3.74
2.70
PR29
24.33
28.67
30.17
32.41
31.33
30.46
30.25
40.82
37.73
35.67
34.00
3.84
Int.J.Curr.Microbiol.App.Sci (2019) 8(9): 2219-2232
Fig.4.1Effect of PGPRs (PR3, PR5, PR6, PR24 and PR29) on Germination of Tomato cv.NTL186
Table 4.9 and fig 4.9 reveals that the
maximum fruit weight (g/plant) (682.33g) was
recorded with T7 (PR5+NPK 100%+FYM
100%) followed by (597.33g) in T8
(PR5+NPK 100%+FYM 75%) i.e. which were
significantly higher than other treatment. The
lowest fresh fruit weight (g/plant) (353.33 g)
was observed in treatment T0 (control). Similar
type of results also observed for other PGPR.
In pot culture and field trials P. fluorescence
(SS5) enhanced the growth of tomato plants.
Significant increase in root and shoot weight,
length, fruit yield per plant, and total fruit
yield was recorded. The strain SS5 was
significantly rhizopheric competent and
stabilized in the rhizosphere, without
disturbing thenormal indigenous bacterial
population. Ahirwar et al., (2015).
number and area, fresh and dry weight) in the
inoculated of Pseudomonas fluorescence SS5
compared to control tomato plant. Ahirwar, et
al.,(2015).
PGPB promote plant growth by directly affect
the metabolism of the plants by providing
substances that are usually in short supply.
PGPB are free-living soil, rhizosphere,
rhizoplane, and phylosphere bacteria that,
under some conditions, are beneficial for
plants Most of the activities of PGPB have
been studied in the rhizosphere. From the
present investigation it is concluded that T7
(PR6+NPK (100%) + FYM 100 %)
significantly increased the growth and yield of
Tomato (Lycopersicon esculentum Mill.).
References
PGPRs (PR3) application significantly
influenced the fresh weight of plant (g/plant)
over control. Table 9 reveals that the
maximum fresh weight of plant (g/plant)
(39.08) was recorded with T7 (PR3+NPK
100%+FYM 100%) followed by 35.29) in T8
(PR3+NPK 100%+FYM 75%) i.e. which were
significantly higher than other treatment. The
lowest fresh weight of plant (g/plant) (24.33)
was observed in treatment T0 (control). Similar
type of results also made for other PGPR.
Tomato plant tended to increased significantly
the growth parameters (plant height, leaf
Ahirwar, N. K., Gupta, G., Singh, V.,
Rawlley, R. K. and Ramana, S. (2015)
Influence on growth and fruit yield of
tomato (Lycopersicon esculentum
Mill.) plants by inoculation with
Pseudomonas fluorescence (SS5):
Possible role of plant growth
promotion. Int. J.Curr. Microbiol.App.
Sci, 4(2): 720-730.
Chatterjee R. and Thirumdasu R. K. (2014).
Nutrient management in organic
2231
Int.J.Curr.Microbiol.App.Sci (2019) 8(9): 2219-2232
vegetable production. International
Journal of Food, Agriculture and
Veterinary Sciences, 4 (3): 156-170
Fisher, R.A. (1950) Statistical method for
research workers. Oliver and Boyd
Edinburg. London.
Hillel, D. (2005) Plant growth-promoting
bacteria in agriculture and the
environment, encyclopedia of soils in
the environment,2005, (Editor-inChief) D. Hillel, Elsevier, Oxford,
U.K. Vol. 1., pp. 103-115. 2200 p.
Jenny, S. and Malliga, P. (2016). Assessment
of different concentrations of organic
Manure on the growth and yield of
Solanum lycopersicum L.(Tomato).
IJIRSET DOI:10.15680/IJIRSET. 3722
– 3731.
Kannahi, M. and Ramya, R.(2015).Effect of
biofertilizer,
vermicompost,
biocompost and chemical fertilizer on
different
morphological
and
phytochemical
parameters
of
Lycopersicum esculentum L. World
Journal
of
Pharmacy
and
Pharmaceutical Sciences, 4 (09):
1460-1469.
Kloepper, J.W. and Schroth, M.N. (1981)
Relationship of in vitro antibiosis of
plant growth promoting rhizobacteria
to plant growth and the displacement
of root microflora. Phytopathology 71:
1020-1024.
Maurya, U., Lal, E.P., Yadav, O.P., Prakash,
A. and Singh, A. K. (2015). Plant
growth promoting rhizobacteria and
their activity against early blight of
tomato. Indian J.L.Sci. 5 (1) : 57-62.
Naika, S., Lidt de Jeude, J.V., Goffau,M.De.,
Hilmi, M. and Dam, B.V. (2005).
Cultivation of tomato : production,
processing and marketing. Agromisa
Foundation and CTA, Wageningen, 17:
1-92
Peralta I. E. and Spooner D.M. (2007).
History, origin and early cultivation of
tomato
(Solanaceae),
Genetic
improvements of solanaceous crops :
tomato, Science publisher (2) 1-24
Ramakrishnan, K. and Selvakumar, G. (2012)
Effect of biofertilizers on enhancement
of growth and yield on Tomato
(Lycopersicum esculentum Mill.),
International Journal of Research in
Botany ; 2(4): 20-23
How to cite this article:
Gagendra Singh Rajput and Ramteke, P.W. 2019. Impact of Plant Growth Promoting
Rhizobacteria with FYM on the Growth, Yield Attribute and Yield of Tomato (Lycopersicon
esculentum Mill.). Int.J.Curr.Microbiol.App.Sci. 8(09): 2219-2232.
doi: />
2232