Livestock rearing contribution towards the beneficiary and nonbeneficiary on watershed development programme in Nagaland
Bạn đang xem bản rút gọn của tài liệu. Xem và tải ngay bản đầy đủ của tài liệu tại đây (236.79 KB, 10 trang )
Int.J.Curr.Microbiol.App.Sci (2019) 8(9): 2943-2952
International Journal of Current Microbiology and Applied Sciences
ISSN: 2319-7706 Volume 8 Number 09 (2019)
Journal homepage:
Original Research Article
/>
Livestock Rearing Contribution towards the Beneficiary and nonBeneficiary on Watershed Development Programme in Nagaland
Mukesh Kumar Yadav and Amod Sharma*
Department of Agricultural Economics, Nagaland University SASRD Medziphema Campus,
District: Dimapur - 797 106, Nagaland, India
*Corresponding author
ABSTRACT
Keywords
Nagaland, income,
employment,
beneficiaries, nonbeneficiaries,
activities.
Article Info
Accepted:
25 August 2019
Available Online:
10 September 2019
The present study to access the assured income and employment through
different activities implemented under watershed programme with
reference to the beneficiaries and non-beneficiaries for the purposely
selected two districts from the Nagaland state viz; Dimapur and Kohima as
both were selected purposely due to the maximum number of area covered
under watershed in the zone and further two blocks from each district were
randomly selected, while in the second stage a multi stage random
purposive sampling methods viz; 320 respondents (160 beneficiaries and
160 non-beneficiaries) were selected randomly from identified watershed
areas. Study reveals that the average annual or monthly income of the
beneficiary always be more than the non-beneficiary. Even on beneficiary it
increase with increasing in the farm size group, respectively in the rural
areas of Nagaland.
Introduction
Watershed management activities is the
process of guiding and organizing land, soil
and other resource use on a watershed to
provide needed goods and services and
simultaneously conserving soil, water and land
natural resources. The interrelationships
among soil land used and water, and the
linkages between up-stream and downstream
area are given an explicit significance in
watershed approach. Watershed management
focuses on using resources in a productive and
sustainable manner. The primary objective of
watershed management is to slow down or if
possible reversing the manmade degradation
which is mostly manifested in accelerated runoff usually with heavy sedimentations,
reduced
agricultural
productivity
and
progressive removal of vegetative cover on
non-arable land. watershed management
project help in internalizing the externalities
2943
Int.J.Curr.Microbiol.App.Sci (2019) 8(9): 2943-2952
caused by flooding from a large number of
seasonal torrents every year. Since 1970, there
have been heavy investments by Central and
State Governments in the watershed
development projects. Integrated Watershed
Management (IWM) has been identified as a
key for planning and management of natural
resources in mountain ecosystems. It provides
an ecologically sound economic base for the
watersheds and its people. In any
developmental activity, the watershed
approach is more scientific because the
inherent potential of soil, water and forest
recourses in a particular area is controlled by
various factors such as physiography,
geological base, soil characteristic, climate,
present land use, socio-economic aspects etc.
((Anon. 2016)).
Kohima, the capital of Nagaland, is a hilly
district sharing its borders with Dimapur in the
West, Phek District in the East, Peren in the
South and Wokha in the North. It has a humid
subtropical climate, with an elevation of 1444
metres and covers an area of 1463 sq. km.
While the Dimapur District is the centre for
many commercial activities. It is bounded by
Kohima district on the South and East,
KarbiAnglong on the West, Golaghat District
of Assam, in the North. A large area of the
District is in the plains with an average
elevation of 260 m above sea level with an
area of 927 sq. km (Anon. 2017).
Materials and Methods
The present study is related to IWMP scheme,
which is working as per the guideline of
Central government with the help of Ministry
of Agriculture, Government of India.
Development projects require long period of
time to reap benefits. Therefore for economic
appraisal of development projects, it is
essential that the project has been in operation
for quite some time. Since the intensive
IWMP started in 2008-09, so it is worth, while
to study its impact. Since the data of the initial
period cannot be compared with the data of
recent years. It is more scientific and practical
to compare the economy of the beneficiaries
and non-beneficiaries covered in the area of
IWMP schemes.
The IWMP was launched in 2008-09 in all 11
district viz: Dimapur, Kohima, Kiphire,
Longleng, Mokokchung, Mon, Phek, Peren,
Tuensang, Wokha and Zunheboto of
Nagaland, out of these districts two districts
namely, Zunheboto and Dimapur districts of
Nagaland selected because of the fact that it is
expected to provide all the relevant
information and hence can conveniently be
obtained for conducting this study. (Anon.,
2017). The project area also has a good
network of infrastructure and allied activities
related to the scheme such as development
agencies, nationalized banks, well-established
marketing and communication facilities etc.
Keeping all the above facts, both districts of
Nagaland are therefore purposively selected,
while two blocks were selected from the
selected districts, while from each blocks 2
villages (8 villages in total) were selected
randomly and then 10 beneficiaries and 10
non-beneficiaries (20 cases in total from each
villages), so 80 numbers each of beneficiaries
and non-beneficiaries were selected by
following the simple systematic randomly
sampling techniques with the specific
objectives to conduct the present study viz; to
examine the income contribution through
livestock enterprises and its activities adopted
under watershed management programme.
Results and Discussion
Table 1 reveals the overall / average total cost
investment of animal on beneficiaries, which
was found to be less (Rs 27187.37) as
compare to the non-beneficiaries (Rs
27581.25), even the overall average total cost /
2944
Int.J.Curr.Microbiol.App.Sci (2019) 8(9): 2943-2952
cost of cultivation of animals on beneficiaries
was recorded as maximum Rs 9453.12 (34.77
per cent) on medication charges, followed by
transportation cost with Rs 6640.62 (24.43 per
cent), feeding cost was Rs 4861.87 (17.88 per
cent), cost of animal shed was Rs 2431.06
(8.94 per cent), other charges was of Rs
1460.87 (5.37 per cent), Rs 1186.87 (4.36 per
cent) on labour cost and it was found to be
least on equipment as Rs 1152.94 (4.24 per
cent), respectively. Similar studies were find
out by the Sharma (2002); Sharma and
Sharma (2008); Shuya and Sharma (2014);
Walling and Sharma (2015); Walling et al.,
(2017); Shuya and Sharma (2018).
Further table reveals that the overall / average
total cost investment of animal on nonbeneficiaries was recorded as maximum Rs
8669.69 (31.43 per cent) on feeding cost,
followed by Rs 5279.37 (19.14 per cent) on
medication charges, cost of animal shed with
Rs 4212.50 (15.27 per cent), transportation
cost was Rs 3989.37 (14.46 per cent), labour
cost was Rs 3876.87 (14.06 per cent), Rs
1016.56 (3.69 per cent) for other charges and
Rs 536.87 (1.95 per cent) on the equipment as
least cost item, respectively. Similar studies
were find out by the Sharma (2004); Sharma
(2011); Mishra et al., (2014); Sharma et al.,
(2016); Walling et al., (2017); Sangtam and
Sharma (2015); Pongeneer and Sharma
(2018).
Table 2 reveals the farm size as well as
average farm inventory status of livestock
animals on beneficiaries, which was found to
be more (Rs 31136.64) as compare to the nonbeneficiaries (Rs 29255.62), while the overall
total assets of animals on beneficiaries was
recorded as maximum Rs 22363.75 (71.82 per
cent) of piggery reared in cost, followed by
cattle numbers as reared cost with Rs 5612.50
(18.02 per cent), poultry reared cost was Rs
1711.88 (5.81 per cent), while on other
animals reared cost will be found to be least as
Rs 1431.25 (4.59 per cent), respectively.
Similar studies were find out by the Sharma
(2002); Sharma and Sharma (2008); Shuya
and Sharma (2014); Walling and Sharma
(2015); Walling et al., (2017); Shuya and
Sharma (2018).
Further table reveals that the overall total
assets of animals on non-beneficiaries was
recorded as maximum Rs 22368.75 (76.46 per
cent) of piggery reared in cost, followed by
cattle numbers as reared cost with Rs 5321.88
(18.19 per cent), poultry reared cost was Rs
1000.00 (3.18 per cent), while on other
animals reared cost will be found to be least as
Rs 565.00 (1.93 per cent), respectively.
Similar studies were find out by the Sharma
(2004); Sharma (2011); Mishra et al., (2014);
Sharma et al., (2016); Walling et al., (2017);
Sangtam and Sharma (2015); Pongeneer and
Sharma (2018).
Table 3 reveals the overall average return
from different livestock enterprises on
beneficiaries, which was found to be more (Rs
56938.36) as compare to the non-beneficiaries
(Rs 34021.87), respectively. While the overall
total return through livestock on beneficiaries
was recorded as maximum on Piggery farm Rs
38492.50 (67.60 per cent), followed by cattle
with Rs 14003.36 (24.59 per cent), through
poultry rearing return was Rs 2636.25 (4.63
per cent), while it was found least by the other
reared returns as Rs 1806.25 (3.18 per cent),
respectively.
While among the farm size group the net
return has been increased with increased in the
farm size group. Similar studies were find out
by the Sharma (2002); Sharma and Sharma
(2008); Shuya and Sharma (2014); Walling
and Sharma et al., (2015); Walling et al.,
(2017); Shuya and Sharma (2018).
2945
Int.J.Curr.Microbiol.App.Sci (2019) 8(9): 2943-2952
Table.1 Cost of animals of beneficiaries and non-beneficiaries respondent families
Groups
Cost of
animal shed
2186.84
Feeding cost
Medication
Equipments
4794.74
8705.26
(8.63)
(18.92)
Medium
2353.12
Large
Beneficiaries
Small
Average
Non-beneficiaries
Small
Medium
Large
Average
1068.42
Labour
input
1089.47
Transportation
cost
6005.26
1489.47
Total
cost
25339.47
(34.35)
(4.22)
(4.30)
(23.70)
(5.88)
(100.00)
5281.25
9775
1052.5
1150
6031.25
1445.31
27088.43
(8.69)
2496.51
(19.50)
4750.46
(36.08)
9488.99
(3.88)
1197.16
(4.24)
1214.68
(22.27)
6930.27
(5.34)
1460.45
(100.00)
27538.52
(9.07)
(17.25)
(34.46)
(4.35)
(4.41)
(25.17)
(5.30)
(100.00)
2431.06
4861.87
9453.12
1152.94
1186.87
6640.62
1460.87
27187.37
(8.94)
(17.88)
(34.77)
(4.24)
(4.36)
(24.43)
(5.37)
(100.00)
3020.83
(11.68)
5454.17
(21.09)
8625
(33.34)
566.67
(2.19)
1466.67
(5.67)
5816.67
(22.49)
916.67
(3.54)
25866.67
3972.50
8105.62
5535
522.5
3567.5
4255
1008.75
26966.87
(14.73)
(30.06)
(20.53)
(1.94)
(13.23)
(15.78)
(3.74)
(100.00)
4705.15
9900.73
4388.23
548.53
4666.17
3354.41
1043.38
28606.62
(16.45)
(34.61)
(15.34)
(1.92)
(16.31)
(11.73)
(3.65)
(100.00)
4212.5
8669.69
5279.37
536.87
3876.87
3989.37
1016.56
27581.25
(15.27)
(31.43)
(19.14)
(1.95)
(14.06)
(14.46)
(3.69)
(100.00)
(The figure in the parentheses indicates percentage in total)
2946
Others
(100.00)
Int.J.Curr.Microbiol.App.Sci (2019) 8(9): 2943-2952
Table.2 Animal inventories status of beneficiaries and non-beneficiaries
Groups
Beneficiaries
Small
Medium
Large
Non-beneficiaries
Average
Small
Medium
Large
Average
Cattle
Poultry
Piggery
Others
Total value
Nos.
reared
17
Present
value
17421.05
Nos.
reared
55
Present
value
100
Nos.
reared
11
Present
value
32000
Nos.
reared
120
Present
value
1263.16
50784.21
(0.03)
8
(0.03)
(34.3)
4187.5
(17.19)
(0.10)
180
(0.74)
(0.10)
1125
(4.63)
(0.02)
24
(0.09)
(63.01)
15312.5
(62.89)
(0.24)
480
(1.97)
(2.48)
3031.25
(12.46)
(100.00)
24348.25
(100.00)
23
(0.07)
0.3
(0.00)
8
(0.02)
49
(0.02)
34
(0.12)
0.57
(0.00)
3972.48
(12.51)
5612.5
(18.02)
3333.33
(11.08)
6043.75
(2.48)
4823.53
(17.67)
5321.88
(18.19)
1180
(3.72)
8.84
(0.03)
130
(0.43)
410
(0.17)
390
(1.43)
5.81
(0.019)
2165.14
(6.82)
1711.88
(5.49)
1833.33
(6.09)
862.5
(0.34)
1014.71
(3.72)
1000.0
(3.18)
125
(0.40)
1.00
(0.00)
52
(0.17)
358
(0.14)
255
(0.93)
4.16
(0.014)
22754.13
(71.66)
22363.75
(71.82)
24916.67
(82.82)
236000
(97.04)
20470.58
(74.99)
22368.75
(76.46)
540
(1.70)
7.125
(0.02)
0
(0.00)
720
(0.29)
400
(1.46)
7.0
(0.023)
990.83
(3.12)
1431.25
(4.59)
0
(0.00)
292.5
(0.12)
985.29
(3.6)
565.00
(1.93)
31750.58
(100.00)
31136.64
(100.00)
30083.33
(100.00)
243198.75
(100.00)
27294.11
(100.00)
29255.62
(100.00)
(The figure in the parentheses indicates percentage in total)
2947
Int.J.Curr.Microbiol.App.Sci (2019) 8(9): 2943-2952
Table.3 Return from different animal husbandry activity
Groups
Beneficiaries
Small
Medium
Large
Non-beneficiaries
Average
Small
Medium
Large
Average
Cattle
9316.53
(36.25)
8422
(17.79)
7541.47
(13.71)
14003.36
(24.59)
6625.0
(19.59)
10243.75
(28.04)
8323.53
(26.77)
9156.25
(26.91)
Poultry
894.74
(3.48)
2053.12
(4.34)
3111.01
(5.66)
2636.25
(4.63)
2016.67
(5.96)
965.0
(2.64)
1123.35
(3.61)
1115.0
(3.28)
Return from
Piggery
Others
13936.84
1552.63
(54.23)
(6.04)
35231.25
1621.88
(74.44)
(3.43)
43730.27
611.01
(79.52)
(1.11)
38492.5
1806.25
(67.60)
(3.18)
25183.33
0.00
(74.45)
(0.00)
23822.5
1507.5
(6.52)
(4.13)
20654.41
985.29
(66.42)
(3.17)
22578.12
1172.5
(66.36)
(3.45)
Total return
25700.74
(100.00)
47327.25
(100.00)
54993.76
(100.00)
56938.36
(100.00)
33825.00
(100.00)
36538.75
(100.00)
31095.59
(100.00)
34021.87
(100.00)
(The figure in the parentheses indicates percentage in total)
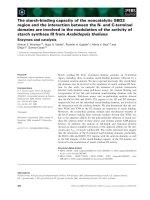
Fig.1 Distribution of sampled respondent family groups of beneficiaries and non-beneficiaries
according to cost of animal production
2948
Int.J.Curr.Microbiol.App.Sci (2019) 8(9): 2943-2952
Table.4 Item wise return from different animal husbandry activity of beneficiaries and non-beneficiaries respondents
Groups
Beneficiaries
Small
Medium
Large
Average
Non-beneficiaries
Small
Medium
Large
Average
Young
Nos.
Value
5.52
13421.05
Mature
Nos.
Value
10.58 21473.68
Milk
Egg
Manure
Others
Total
2973.68
148.95
2673.68
852.63
41543.67
(0.015)
(15.96)
(0.03)
(58.67)
(16.32)
(0.22)
(7.30)
(1.51)
(100.00)
11.47
17296.87
19.44
29343.75
3656.25
154.65
1953.12
1621.87
54026.51
(0.02)
(28.17)
(0.04)
(62.16)
(3.50)
(0.24)
(2.44)
(3.43)
(100.00)
13.28
18399.08
18.84
32973.78
3976.15
179.63
2813.76
1784.01
60126.41
(0.02)
(33.33)
(0.03)
(59.68)
(3.39)
(0.29)
(2.19)
(1.11)
(100.00)
12.00
16372.67
17.98
30882.14
3602.03
161.08
2480.19
1482.17
54998.26
(0.02)
(30.89)
(0.03)
(60.05)
(4.51)
(0.27)
(2.67)
(1.57)
(100.00)
6.42
(0.02)
9166.67
(27.10)
9.42
(0.03)
20916.67
(61.84)
2250.00
(6.65)
100.00
(0.29)
1391.67
(4.11)
0.00
(0.00)
33825.0
(100.00)
5.26
10510.00
4.95
20356.25
3162.50
52.50
1310.00
1507.50
36538.75
(0.01)
(28.76)
(0.01)
(55.71)
(8.65)
(0.14)
(3.58)
(4.12)
(100.00)
4.82
7860.29
5.16
18448.53
2720.59
58.82
1022.06
985.29
31095.59
(0.02)
(25.28)
(0.02)
(59.33)
(8.75)
(0.19)
(3.29)
(3.17)
(100.00)
5.16
9103.12
5.37
19587.5
2906.25
58.75
1193.75
1172.5
34021.87
(0.01)
(26.76)
(0.01)
(57.57)
(8.54)
(0.17)
(3.51)
(3.45)
(100.00)
(The figure in the parentheses indicates percentage in total)
2949
Int.J.Curr.Microbiol.App.Sci (2019) 8(9): 2943-2952
Fig.2 Distribution of sampled respondent family groups animal husbandry
Further the overall total return through
livestock on non-beneficiaries was recorded as
maximum on Piggery farm with Rs 22578.12
(66.36 per cent), followed by cattle with Rs
9156.25 (26.91 per cent), through other
animals reared return was Rs 1172.50 (3.45
per cent), while it was found least by the
poultry rearing return as Rs 1115.00 (3.28 per
cent), respectively. While among the farm size
group the net return was found to be
maximum on medium farm size group,
followed by marginal and it was found to be
minimum on large farm size group,
respectively. Similar studies were find out by
the Sharma (2004); Sharma and Sharma
(2008); Dhakre and Sharma (2010); Sharma
(2012); Shuya and Sharma (2014); Sharma
(2014); Sangtam and Sharma (2015); Walling
and Sharma, (2015); Sharma et al., (2018).
Table 4 reveals the overall average return
from item wise different livestock enterprises
on beneficiaries, which was found to be more
(Rs 54998.26) as compare to the nonbeneficiaries (Rs 34021.87), respectively.
While the overall total return through
livestock on beneficiaries was recorded as
maximum on Mature animals was Rs
30882.34 (60.05 per cent), followed by cattle
with Rs 16372.67 (30.89 per cent), through
milk the return was Rs 3602.03 (4.51 per
cent), manure contribute Rs 2480.19 (2.67 per
cent), through others it was Rs 1482.17 (1.57
per cent), while it was found least as egg
return investment towards the farm as Rs
161.08 (0.27 per cent), respectively.
Whereas, among the farm size group the net
return has been increased with increased in the
farm size group. Similar studies were find out
by the Sharma (2002); Sharma and Sharma
(2008); Shuya and Sharma (2014); Walling
and Sharma (2015); Walling et al., (2017).
Further the overall total return through
livestock on beneficiaries was recorded as
maximum on Mature animals was Rs
19587.50 (57.57 per cent), followed by cattle
with Rs 9103.12 (26.76 per cent), through
milk the return was Rs 2906.25 (8.54 per
cent), manure contribute Rs 1193.75 (3.51 per
cent), through others it was Rs 1172.50 (3.45
per cent), while it was found least as egg
return investment towards the farm as Rs
58.75 (0.17 per cent), respectively. Whereas,
among the farm size group the net return has
2950
Int.J.Curr.Microbiol.App.Sci (2019) 8(9): 2943-2952
been increased with increased in the farm size
group. Similar studies were find out by the
Sharma (2002); Sharma (2011); Mishra et al.,
(2014); Sharma et al., (2016); Sangtam and
Sharma (2015); Walling et al., (2017);
Pongeneer and Sharma (2018); Tangjang and
Sharma (2018).
References
Analogous. 2016. Agricultural Situation in
India. Directorate of Economics and
Statistics. Ministry of Agriculture,
New Delhi.
Analogous. 2017. Statistical Hand of
Nagaland Published by Directorate of
Economics and Statistics (various
issues), Kohima, Nagaland.
Dhakre, D. S. and Sharma, Amod. 2010.
Socio-Economic Development in
India. Environment and Ecology. 4(1):
2469-2472.
Mishra, A.; Pattnaik, B. R. and Ray, Plabita.
2014.
Impact
of
Watershed
Development Programme on Socioeconomic Development of the People.
Journal of Extension Education. 39(1):
182-189.
Pongener, Bendangjungla. and Sharma,
Amod. 2018. Constraints Faced by the
Fishery Enterprises: A SWOC
Analysis. IJCMAS. 7(5). May: 15951603.
Sangtam, Likhase. L. T. and Sharma, Amod.
2015. Impact of Bank Finance on
Employment and Income through
Piggery Enterprise in Nagaland.
EPRAIJEBR. 3(11). Nov: 273-276.
Sharma, A. 2002. Source and Knowledge on
beneficiaries about the purpose of
credit - A case study of Agra Region of
Uttar
Pradesh.
Journal
of
Interacademica. 6(3). July: 374-379.
Sharma, A. 2004. Constraints of Fish
Production - A case study in rainfed
areas of Uttar Pradesh. Journal of
Interacademica. 8(4). October: 639643.
Sharma, A. and Sharma, Anamika. 2008.
Problems faced by the farmers in
adoption
of
improved
maize
cultivation practices in hills. TJRAR.
8(2): 22-23.
Sharma, Amod. 2011. Economic and
Constraints of King Chilli Growers in
Dimapur District of Nagaland. Journal
of Interacademicia. 15(4): 710-719.
Sharma, Amod. 2012. Inter-state Disparities in
Socio-economic Development in North
East Region of India. Journal of
Agricultural Science. 4(9). September:
236-243.
Sharma, Amod. 2014. Sustainable economic
analysis and extent of satisfaction level
of King Chilli growers in Nagaland.
Agriculture
for
Sustainable
Development. 2(1). June: 188-191.
Sharma, Amod.; Kichu, Yimkumba. and
Chaturvedi, B. K. 2016. Economics
and
Constraints
of
Pineapple
Cultivation in Dimapur District of
Nagaland. TJRAR. 16(1). January: 7275.
Sharma, Amod.; Kichu, Yimkumba. and
Sharma, Pradeep. Kumar. 2018.
Sustainable economic analysis and
constraints faced by the pineapple
growers in Nagaland. Progressive
Agriculture. 18(1). February: 27-33.
Sharma, Rajan., Chauhan, Jitendra., Meena, B.
S. and Chauhan, R. S. 2015. Problems
Experienced By Farmers and Project
Officers in Watershed Management.
Indian Research Journal of Extension
Education. 15(2&3): 23-27.
Shuya, Keviu. and Sharma, Amod. 2014.
Impact and constraints faced by the
borrowers of cooperative bank finance
in Nagaland. Economic Affairs. 59(4).
October: 561-567.
Shuya, Keviu. and Sharma, Amod. 2018.
Problems faced by the Borrowers in
2951
Int.J.Curr.Microbiol.App.Sci (2019) 8(9): 2943-2952
Utilization
and
Acquiring
of
Cooperative Bank Loans in Nagaland.
IJED. 14(2). April-June: 52-56.
Tangjang, Avicha. and Sharma, Amod. 2018.
Problem faced by the Large
Cardamom Growers during production
and marketing: A case study of Tirap
district
of
Arunachal
Pradesh.
IJCMAS. 7(5). May: 2561-2573.
Walling, Imti. and Sharma, Amod. 2015.
Impact of SGRY on beneficiaries and
non-beneficiaries in Dimapur district
of Nagaland. TJRAR. 15(2). August:
90-94.
Walling, Imti.; Sharma, Amod.; Yadav,
Mukesh. Kumar.; Rajbhar, Arun,
Kumar. and Kalai, Kankabati. 2017.
Impact of Agricultural Technology
Management Agency on Rural
Economy of Nagaland, India. Plant
Archiver. 17(2). October: 1511-1516.
How to cite this article:
Mukesh Kumar Yadav and Amod Sharma. 2019. Livestock Rearing Contribution towards the
Beneficiary and non-Beneficiary on Watershed Development Programme in Nagaland.
Int.J.Curr.Microbiol.App.Sci. 8(09): 2943-2952. doi: />
2952