Bioremediation of petroleum oil sludge polluted brackish water ecosystem
Bạn đang xem bản rút gọn của tài liệu. Xem và tải ngay bản đầy đủ của tài liệu tại đây (372.15 KB, 28 trang )
Int.J.Curr.Microbiol.App.Sci (2019) 8(9): 2819- 2846
International Journal of Current Microbiology and Applied Sciences
ISSN: 2319-7706 Volume 8 Number 09 (2019)
Journal homepage:
Original Research Article
/>
Bioremediation of Petroleum Oil Sludge Polluted
Brackish Water Ecosystem
Vincent C. Wokem*, Lucky O. Odokuma and Caroline N. Ariole
Department of Microbiology, University of Port Harcourt, P.M.B. 5323, Port Harcourt,
Rivers State, Nigeria
*Corresponding author
ABSTRACT
Keywords
Bioremedation,
petroleum oily
sludge,
Hydrocarbon
utilizing bacteria
(HUB), Total
petroleum
hydrocarbon (TPH),
Polycyclic aromatic
hydrocarbon (PAH)
Article Info
Accepted:
24 August 2019
Available Online:
10 September 2019
Petroleum oil sludge resulting from crude oil storage, illegal crude oil refining and bunkering
activities constitutes environmental hazards and pollution in the crude oil producing communities in
the Niger Delta region of Nigeria. Biostimulation with N.P.K. fertilizer option C, bioargumentation
with indigenous hydrocarbon utilizing bacteria (HUB) option B, combination of biostimulation and
bioaugmentation as option A and option D was without any bioremediation treatment were employed
in the bioremediation of brackish water artificially polluted with petroleum oil sludge. Brackish
water sample was obtained from Elechi Creek, Port Harcourt Rivers State. Petroleum oil sludge
sample was obtained from Crude Oil Processing Plant in Obegi community, Rivers State.
Bioremediation was monitored for 56 days using the percentage ratio of total petroleum hydrocarbon
(TPH) losses for each period to TPH loss at day 0. The result of physicochemical analysis of the
petroleum sludge showed that aliphatic hydrocarbon (n-alkanes) ranged from C13 – C35, with
concentrations ranging from 26.12-7,713.62ppmwith TPH of 89,509.9ppm. The polycyclic aromatic
hydrocarbon (PAH) range was 0.03-5.36ppm with total concentration of 24.21ppm. Heavy metal
analysis showed; iron (49.42mg/kg), Zinc (3.79mg/kg), Nickel (4.53 mg/kg) and manganese (6.90
mg/kg). The average total heterotrophic bacterial (THB) and (HUB) counts for petroleum sludge
were; 2.5 x 10⁵cfu/g and 2.0 x10⁵cfu/g and for the brackish water sample were 1.39 x 10⁶cfu/ml and
1.1 x 10⁴cfu/ml respectively. Statistical analysis (ANOVA) showed that the THB and HUB counts
were significantly different at 5 percent levels (P<0.05) in the different treatment options during the
bioremediation period. Changes in physico-chemical parameters showed that pH, alkalinity,
conductivity, chemical oxygen demand, nitrate and phosphate were significantly different (P<0.05)
while there were no significant differences (P>0.05) in the following parameter; salinity biochemical
oxygen demand and total hydrocarbon continent.Using least significant difference (LSD), treatment
option D and the control option E were different from treatments A, B and C. The phylogenetic
analysis identification of the HUB isolates implicated in the degradation process revealed a closely
related ness to the following organisms, Lysinibacillus sphaericus, Klebsiella pneumonia and
Alcaligenes faecalis of different strains. The bacterial sequences submitted to Genbank were
assigned Accession Number KX817218-KXV7225. The percentage losses in TPH from Gas
Chromatography (GC) results showed the following; option A (91.8%), option B (92.5%), C (95%)
D (57.8%) and option E control (39.5%) respectively. The results suggest that the application of
biostimulation with N.P.K fertilizer, bioaugmentation with indigenous HUB or a combination of
both will enhance the bioremediation of petroleum sludge polluted brackish water system in the
Niger Delta of Nigeria.
2819
Int.J.Curr.Microbiol.App.Sci (2019) 8(9): 2819- 2846
Introduction
Petroleum sludge is made up of hydrocarbons,
solids and other impurities and the remaining
being water. Huge amount of petroleum
sludge is formed during oil processing in
refineries and oil processing as well as during
illegal oil refining and bunkering in the creeks
of oil producing communities. High demand
for petroleum products has led to generation
of large amount of oily wastes (Bhttacharyya
and shekalar 2003). The petroleum oily
sludge is attributed to two major factors;
sedimentation of inorganic residues in the
crude oil and the precipitation of paraffin
wax, since wax precipitates are sparingly
soluble in crude oil (Milne, 1998). Petroleum
is capable to penetrate into ground and pollute
ground water, surface water and the terrestrial
environment if not properly treated and
managed (Manning and Thompson, 1995).
The components of petroleum sludge are
toxic, mutagenic and carcinogenic and may
persist in the environment for long period;
posing environmental problem both to the
aquatic and terrestrial ecosystems (Wu et al.,
2008;
Ayotamuno,
et
al.,
2011,
Balanchandran et al., 2012).
When hydrocarbon pollutants get into the
aquatic systems, they may be biodegraded by
indigenous micoorganisms (Okpokwasili and
Odukuma, 1990), though they may pose
toxicity problems to indigenous microflora.
Hydrocarbon contamination generally can
cause damages to the aquatic vegetation
(Krebs and Tanner, 1981). The young fish and
aquatic invertebrates are the most threatened
organisms in the aquatic environment (Calfee
et al., 1999). Hydrocarbon toxicity due to the
presence of PAHs has greater environmental
and public health implication as it can pass on
to human population. These effects will
eventually lead to socio-economic impact of
decline in food production, youth restiveness
and community unrest.
The use of conventional techniques
(mechanical removal, sediment relocation and
application of chemical dispersants) are
generally expensive and exposes personnel to
health hazards. The ability of microorganisms
to degrade hydrocarbon pollutants in the
environment has been employed in the
remediation of hydrocarbon contaminated
sites. Several studies have reported on the
abilities of microorganisms (bacteria, fungi
and algae) to degrade petroleum hydrocarbons
(Riser-Roberts 1992; Dean-Ross et al., 2002;
Bundy et al., 2004; Chikere et al., 2009;
Wang et al., 2011; Malik and Ahmed, 2012;
Ahirwar and Dehariya, 2013; Macaulay,
2015). Bioremediation is the use of biological
process and agents especially microbial, to
degrade the environmental contaminants into
less
toxic
forms
(Vidali,
2010).
Biodegradation transforms and mineralize
organic compounds, though complete
mineralization is often not realized. Only
when environmental conditions permit
microbial growth activity would the
applicationbe effective. Thus, manipulation of
environmental parameters to achieve fast
growth rate and optimal activities is a
necessity
(Mukred
et
al.,
2008).
Biostimulation and bioaugmentation are
methods of bioremediation geared towards
enhancing the process. Biostimulation is the
injection of amendments (nutrients) into
contaminated soil or water to stimulate
indigenous microbial population already
present to enhance the pollutant degradation
(Obire and Akinde, 2004). Amendment may
include oxygen, nutrient (organic or inorganic
fertilizer), electron acceptors (Tyagi et al.,
2011). Stimulation of the activity of
indigenous microflora to remediate the target
pollutant can also be accelerated by
adjustment of physical process such as pH
and moisture (Vidali, 2001). Bioaugmentation
involves the addition of exogenous or
indigenous bacterial cultures to the
contaminated matrix to decontaminate it. It is
2820
Int.J.Curr.Microbiol.App.Sci (2019) 8(9): 2819- 2846
more commonly and successfully carried out
by addition of large population of selected
microorganisms grown in the laboratory
removed from the contaminated sites (Vidali,
2001). Application of genetically engineered
bacteria has been used for bioremediation
trials. Genes could be introduced into native
species using other genetic vectors such as
plasmids (Crisafi et al., 2016) A combination
of both biostimulation and bioaugmentation
has also been employed in bioremediation
process
(Odokuma
and
Dickson,
2003;Mukred et al., 2008). This present study
compared the biostimulation with N.P.K
fertilizer, bioaugmentation with indigenous
HUB isolates, combination of biostimuation
and bioaugmentation as well as intrinsic
bioremediation
(natural
attenuation)
techniques in the bioremediation of petroleum
sludge polluted brackish water ecosystem.
Materials and Methods
Sample Collection
Brackish water sample was collected from
Elechi creek located in Port Harcourt Rivers
stated behind Nigeria Agip Oil Company
(NAOC) and Rivers State University, Nkpolu,
Port Harcourt. The area lies on latitude 4˚
47’37.6 “N” and longitude 6˚ 58’20.6 “E”.
Sample bottle was rinsed trice with the river
water before collection (ASTM, 1999). Water
sample was collected by gradually lowering
the bottle into the sub-surface (10-20cm of the
river in direct sunlight. The bottle was opened
and allowed to be filled and closed below the
water. Water was collected into 4 liter plastic
bottle and transported in ice-pack to the
laboratory. Water sample was refrigerated at
4˚C and covered. The petroleum oily sludge
was collected from the crude oil processing
plant belonging to Total Exploration and
Production, (Total E & P) Nigeria limited,
located at Obegi community, Rives state.
Petroleum oily sludge was collected at the
base of crude oil storage tank during cleaning
exercise with soil auger into sterile glass jar
and covered. It was transported in ice pack to
the laboratory and stored in refrigerator at 4˚c.
Reagents
All regents employed in the study were of
analytical grade and were obtained from
Sigma-Aldrich chemical company, USA, and
BDH chemical Ltd, Poole, England. All
microbiological media used were products of
Oxoidand Difco Laboratories England and
Sigma-Aldrich, USA. Filter paper (whatman
No.1) was obtained from WER Bauston Ltd,
London. DNA extraction Kit was obtained
from Inqaba Biotechnical Industries, South
Africa. Bonny light crude oil used for HUB
screening was obtained from Port Harcourt
Refinery Company, Eleme, Rivers State,
Nigeria. The NPK (Nitrogen, Phosphorus and
Potassium) 20:10:10 NPK fertilizer used in
this study was obtained from Indorama Eleme
Petrochemicals Ltd, Port Harcourt, Nigeria.
Experimental Set-Up
The bioremediation experimental design
consisted of five 2 liters Erlenmeyer flasks.
The flasks were labeled A, B, C, D and E.To
each flask 300ml of brackish water and 100g
of petroleum sludge were added.
The different treatment options
constituted as follows: (Table 1)
were
Option A: Addition of 5ml of 10% wt/v NPK
fertilizer and 5ml of bacteria broth culture
from the water and sludge samples. The
isolates were sub-cultured into nutrient broth
as mix culture and allowed to stand for 6h
before inoculating into the test set up
aseptically by use of sterile syringes.
Option B: Addition of 5ml of bacterial broth
culture.
2821
Int.J.Curr.Microbiol.App.Sci (2019) 8(9): 2819- 2846
Option C: Addition of 5ml 10%
fertilizer.
wt
/v
NPK
determination schemes of Chesbrough (2006)
and Holt et al., (1994).
Option D: No addition of fertilizer and
bacterial broth culture.
Molecular
Isolates
Option E: Addition of 5g sodium azide
biocide to eliminate microorganism). This
served as control.
DNA Extraction
Each set up was plugged with cotton wool
and allowed to stand at room temperature
(28 20C) for 56 days. Repeated sampling
procedures
were
carried
out
for
microbiological
and
physico-chemical
analysis at day 0 and subsequently at day 14,
28, 42 and 56 respectively.
Enumeration of Microbial Population
The total heterotrophic bacteria (THB) counts
of water, petroleum sludge samples and
bioremediation tests set up were performed in
triplicates on nutrient agar (NA) oxoid using
spread plate method (APHA, 1998). Plates
were properly labeled and incubated at 370C
for 24h.
The HUB counts of water, petroleum sludge
and bioremediation tests samples were carried
out in triplicates on Mineral Salt Agar (MSA)
of Mills et al., (1978) as modified by
Okpokwasili and Odokuma (1990). Vapour
phase transfer method (Amanchukwu et al.,
1998) was employed by placing sterile
Whatman No 1 filter papers saturated with
filtered-Bonny light crude oil into the inside
lids of each petri dish kept in an inverted
position, incubated at 300C for 3-7 days. The
plates were examined for colony formation
and
enumeration.
Identification
and
characterization of culturable HUB bacterial
isolates were based on Gramsreaction tests
their morphological features and series of
biochemical tests. When compared with the
characteristics of known using the
Identification
of
the
HUB
DNA extraction was carried out by using a
ZR fungal/bacterial DNA miniprep-extraction
kit obtained from Inquaba, South Africa.
Heavy growth of the pure isolates subcultured
on MacConkey’s agar plates were suspended
in 200 microlitre of isotonic into a ZR
bashing bead lysis tubes, 750 of lysis
solution was added to the tubes. The tubes
were held in position in a bead beater fitted
with a zml holder assembly and processed at
maximum speed for 5 minutes. The ZR
bashing-bead lysis tubes were centrifuged at
10,000xg for 1 minute. Four hundred (400) µl
of the supernatant were transferred aseptically
with micropipette into zymo-spin IV spin
filter (orange top) in a collection tube and
centrifuged at 7000 xg for a minute, then
1200µl of DNA binding buffer was added to
each filtrate in the collection tubes bringing
the final volume to 1600µl. 800µl was
afterwards twirled into zymo-spin IIC column
in a collection tube and centrifuged at 10,000
xg for a minute, the flow through were
discarded. The remaining volumes were
wirled into the same zymo-spin and spun at
10,000xg for a minute. 200µl of the DNA prewash buffer were added to the zymo-spin IIC
in a fresh collection tubes and spun at
10,000xg for a minute followed by the
addition of 500µl of bacterial DNA, buffered
and centrifuged at 10,000xg for a minute. The
zymo-spin IIC column were transferred to
clean fresh 1.5µl centrifuge tubes, 100µl of
DNA elution buffer were added to the column
matrix and centrifuged at 10,000xg for
30seconds to elute the DNA. The ultrapure
DNA of each isolate properly labeled were
then stored at -20oC for use. DENVILLE
2822
Int.J.Curr.Microbiol.App.Sci (2019) 8(9): 2819- 2846
260OD Brushless micro-centrifuge was used
for the centrifugation process. After
extraction, the DNA samples were quantified
using NANODROP (ND1000).
Agarose gel electrophoresis
The extracted genomic DNA were resolved
on a 1% agarose gel at 120v for 15 minutes
and visualized on a UV transilluminator
alongside with a 1kb ladder for size
determination of the isolates DNA sizes.
16S rRNA amplification
The 16s RNA region of the rRNA genes of
the isolates were amplified using the 27F and
1492R primers on a PCR System 9700
Applied Biosystem thermal cycler at a final
volume of 25µl for 40 cycles. The PCR mix
included: the x2 dream tag master mix
supplied by Inqaba, South Africa (tag
polymerase DNTPs, magnesium chloride
(MgCl2), the primers at a concentration of
0.4M and the extracted DNA as template. The
PCR condition were as follows: initial
denaturation, 950C for 4mins, denaturation,
95oC for 30seconds; annealing 520C for 30
seconds; extension 720C for 1minute for 40
cycles and final extension 720C for 3mins.
Than the products were resolved on a 1%
agarose gel at 120V for 15mintes and
visualized on a UV transilluminator (Ce-born
et al., 2008).
I6SrRNA sequencing
The amplified 16s products were sequenced
on a 3500 genetic analyzer using the Bigdye
termination technique by Inqaba, South
Africa.
Phylogenetic analysis
The sequence were edited using the
bioinformatics algorithm Bio edit, similar
sequences were downloaded from the
National Biotechnology Information Centre
(NBIC) data base using BlastN. These
sequences were aligned using clusta 1X. The
evolutionary history of the isolates and
relatedness were inferred following protocols
described in Saitou and Nei (1987);
Felsenstein (1985) and Thompson et al.,
(1994). The result of the bacteria sequences
was submitted to GenBank for determination
of accession numbers.
Physicochemical parameters of brackish
water, petroleum sludge and bioremediation
monitoring samples analysed included; pH,
alkalinity, salinity, biological oxygen demand
(BOD), chemical oxygen demand (COD),
nitrate, phosphate, total hydrocarbon content
(THC), sulphate, total petroleum hydrocarbon
(TPH) and polycyclic aromatic hydrocarbons
(PAHs).
They were determined using methods adopted
from Stewart et al., (1974). Determination of
THC was according to ASTM (1999) method
D3921. The use of gas chromatographic
Flame Ionization Detector (FID) were
employed for TPH and PAH. The methods
were based on (ASTM-D7678, 1999 and
ASTM-D8270 (1999) respectively.
Heavy Metal Analysis
The petroleum sludge and condensate samples
were analysed for the presence of iron, zinc,
copper, vanadium, nickel, lead and
manganese using G.B.C. Avanta Atomic
Absorption Spectrophotometer (AAS) with
detection limit of 0.05mg/kg.The process
involves flame optimization. Prior to flame
optimization, the water trap on the instrument
was filled with distilled water as blank and
the water level in the discharge container was
reduced. It was ensured that the tip of the
hose stays above the water level in the
discharge container during running the AAS,
2823
Int.J.Curr.Microbiol.App.Sci (2019) 8(9): 2819- 2846
as well as ensuring that the burner head was
clean, free from debris and confirming that
aspirator was ducking properly.
Prior to analysis, the AAS was calibrated with
standards of known concentrations to obtain
curve for the individual metal. Concentration
of each of the heavy metal was ascertained
from the data generated by the AAS and
expressed in ppm. At the end of the run, the
displayed result was printed out. All gas
pressures, used in the analysis were set to
70psi.
Determination of percentage losses in TPH in
the various bioremediation treatment options
were carried out by obtaining the difference in
TPH values of GC results of the day 0 and
that of TPH GC result of day 56. Calculation
was percentage of ratio of TPH for day 0, 14,
2, 42 and 56 to TPH at day 0.
Statistical Analysis
Analysis of variance (ANOVA) method and
the least significant difference (LSD) test of
95% levels of confidence were employed with
Statistical Package for Social Science (SPSS)
to determine significant statistical differences
in microbial counts and changes in
physicochemical parameters between the
different treatment options.
Results and Discussion
The physicochemical characteristics of the
brackish water and petroleum sludge used in
the study are presented in Tables 2 and 3
respectively. The brackish water sample had
high salinity of 12,280.8mg/l and conductivity
of 1,407 s/cm. The high salinity and
conductivity contents of the brackish water
sample could be as a result of inflow of sea
water and discharge of domestic and
industrial waste water into the water body
(Nester et al., 2001). The value of THC
(0.85mg/l0 of the water body showed that
there was no previous hydrocarbon
contamination of the water body. The
permissible limit of THC in natural aquatic
systems is 10mg/l (DPR, 2002). The high
values
of
BOD
(448mg/l),
COD
(1,600.0mg/l), THC (915.0mg/l), TPH
(89,509.9mg/l) and PAHs (24.21mg/l) of the
petroleum sludge implies that it constitutes
potential environmental hazard. The results of
characterization of aliphatic hydrocarbon (nalkanes) and PAHs in the petroleum sludge
reveals that the n-alkanes ranged from carbon
length of C13 to C37 with concentrations
ranging
from
26.7-7,713.63ppm,
C17
(Heptadecane) was the most significant nalkane
with
highest
concentration
(7,713.63ppm) while C37 (heptatriacontane)
had the least concentration (26.12ppm) Table
5. The PAHs concentration indicated that
Benzo (b) fluoranthene had the highest
concentration (5.36ppm) while anthracene
was least (0.03ppm). Naphthalene, benzo (a)
anthracene, chrysene, benzo (ghi) perylene
and indeno (1,2,3-cd) pyrene were not
detected (Table 6). The presence of these
PAHs in the petroleum sludge is an indicator
of high pollutant. The AAS concentration
results of heavy metals in the petroleum
sludge revealed high iron (Fe) content of
49.42ppm compared with other heavy metals
investigated (Zn, Cu, V, Ni, Pb and Mn)
which were relatively lower (Table 4). Many
metals are essential for growth of
microorganisms in lower concentrations, yet
are toxic in higher concentrations. Many
microorganisms have the ability to selectively
accumulate metals by the process of
biosorption which involves the building or
adsorption of heavy metals to living or dead
cells (Vijayadeep and Sastry, 2014). The
concentrations of the heavy metals analysed
in the petroleum sludge in this study may not
2824
Int.J.Curr.Microbiol.App.Sci (2019) 8(9): 2819- 2846
have affected the microbial growth in the
overall biodegradation process.
The proportion of microbial population
capable of hydrocarbon degradation in an
aquatic habitat is influenced by a number of
factors, one of which is the environmental
conditions (Odokuma and Okpokwasili,
1993a; Odokuma and Okpokwasili, 1993b;
Odokuma and Okpokwasili, 1997; Mona et
al., 2015). The pH of the brackish water
(7.27) and petroleum sludge (7.32) which
showed pH near neutrality were ideal for
biological functions (Nester et al., 2001).
Changes in pH during the bioremediation
period showed pH near neutrality. This
favours most heterotrophic and HUB
activities (Atlas, 1984). The pH changes
during the monitoring period may be due to
reduction in acidic compounds production
and/or protons secretion. Generally, the pH of
the various treatment options is a function of
the chemical composition of the pollutant,
water and microbial activities (Odokuma and
Ibe, 2003; Delyan et al., 1990; Mayo and
Noike, 1996).
The bacterial counts of the brackish water and
petroleum sludge are presented in Table 7. It
showed that the brackish water had higher
THB count (1.39x10⁶cfu/ml) than the sludge
(2.5x10⁵cfu/g) while the sludge had higher
HUB count (2.0x10⁵cfu/g) than the brackish
water (1.1x10⁴cfu/ml). The bacterial growth
profile (THB and HUB) during the period are
illustrated in Figures 1-2. They followed the
same trend, except in the control option E,
where an extremely low THB and HUB
counts were observed as a result of the
addition of biocide which eliminated
microorganisms in the test systems (Figs. 12).
Statistical analysis results of growth profile of
THB and HUB showed that there was
significant difference in the treatment options
at 5% confidence levels (P<0.05). This also
indicated that the pollutant (petroleum sludge)
was utilizable source of carbon and energy for
the HUB cells (Milic et al., 2009; Hara et al.,
2013; Singh and Chandra, 2014). The decline
in bacterial counts from day 42 to 56 may be
due to nutrient exhaustion with possible
accumulation of toxic metabolites which gave
rise to stationary and death phases (Nester et
al., 2001). The relative few or no growth
observed in the control option E, was due to
the application of biocide (Odokuma and
Akubuenyi, 2008). This led to low percentage
loss in TPH (39.5%) Table 8. The observed %
loss in TPH in the control option is
attributable to environmental factors; natural
attenuation
process
(auto-oxidation,
evaporation, volatilization, emulsification,
dispersion and sedimentation) other than
biodegradation since microorganisms were
eliminated.
Changes in physicochemical parameters
during the period of bioremediation are
illustrated in Figures 3-12. Statistical analysis
(ANOVA) showed that there were significant
differences at 5% level (<0.05) for pH,
alkalinity, conductivity, COD, nitrate and
phosphate, sulphate whereas there were no
significant differences (P>0.05) in salinity,
BOD and THC respectively. Least significant
difference (LSD) analysis showed that
treatments D and E were different from
treatment A, B and C for THC and TPH.
Decreases in BOD in the various tests set up
suggest that the amount of degradable organic
materials were being degraded by the
microorganisms. They showed the same trend
of decrease from Day 0 to day 56 (Fig. 7).
BOD represents the amount of oxygen
required for microbial decomposition of
organic matter in waste water sample, it is
roughly proportional to the amount of
degradable organic matter present in the water
sample (Nester et al., 2001).
2825
Int.J.Curr.Microbiol.App.Sci (2019) 8(9): 2819- 2846
Table.1 Bioremediation treatment options
A
BW+SL+BT+FT
B
BW+SL+BT
Options
C
BW+SL+FT
D
BW+SL+FT
E
BW+SL+SA
Key: BW = Brackish water, SL= Sludge, BI = Bacterial Innoculum, FT = Fertilizer, SA = Sodium azide
Table.2 Physicochemical characteristics of brackish water samples
Parameters
pH
Salinity (mg/l)
Conductivity (µS/cm)
Alkalinity
COD (mg/l)
BOD (mg/l)
Phosphate (mg/l)
Nitrate (mg/l)
Sulphate (mg/l)
THC (mg/l)
Values
7. 27
12,280. 8
1407
32
46
7. 04
Nil
0. 88
0. 69
0. 85
Table.3 Physicochemical characteristics of petroleum sludge sample used in the study
Parameters
pH
Conductivity (μs/cm)
Salinity (mg/l)
Alkalinity
BOD (mg/l)
COD (mg/l)
Nitrate (mg/l)
Phosphate (mg/l)
Sulphate (mg/l)
Total hydrocarbon content (THC) (mg/l)
Total petroleum hydrocarbon (TPH) (mg/l)
Polyaromatic hydrocarbons (PAHs) (mg/l)
Values
7.32
5, 230.0
3, 2 49.0
1, 900.0
448
1, 600.0
10. 59
0. 98
18 58
915. 0
89,509.9
24.21
Table.4 Heavy metal content in petroleum sludge sample used in the study
Parameters
Iron
Zinc
Copper
Vanadium
Nickel
Lead
Manganese
Values (mg/kg)
49. 42
3. 79
3. 32
0. 91
4. 53
2. 59
6.90
2826
Int.J.Curr.Microbiol.App.Sci (2019) 8(9): 2819- 2846
Table.5 Characterization of aliphatic hydrocarbons (n-alkanes) of the petroleum sludge sample
used in the study
S/N
1.
2.
3.
4.
5.
6.
7.
8.
9.
10.
11.
12.
13.
14.
15.
16.
17.
18.
19.
20.
21.
22.
23.
24.
25.
26.
27.
28.
29.
30.
31.
32.
33.
34.
35.
Number of
carbon atoms
C8
C9
C10
C11
C12
C13
C14
C15
C16
C17+
C17
C18
C18+
C19
C20
C21
C22
C23
C24
C25
C26
C27
C28
C29
C30
C31
C32
C33
C34
C35
C36
C37
C38
C39
C40
Name
Conc. (ppm)
Octane
Nonane
Undecane
Decane
Dodecane
Tridecane
Tetradecane
Pentadecane
Hexadecane
Heptadecane
Heptadecane
Octadecane
Octadecane
Nonadecane
Icosane
Hericosane
Decosane
Tripcosane
Tetracosane
Pentacosane
Hexacosane
Heptacosane
Octacosane
Nonacosane
Triacontane
Hentriacontane
Dotriacontane
Tritriacontane
Tetratriacontane
Pentatricacontane
Hexatricacontane
Heptatriacontane
Octatriacontane
Nonatriacontane
Tetracontane
TOTAL
ND
ND
ND
ND
ND
259.07
ND
3841.17
1807.55
4671.54
7713.62
4292.26
6474.51
4125.91
3948.02
5076.97
3266.03
4245.44
4256.37
5470.60
3288.36
4444.23
3648.16
3015.70
4891.31
2258.78
498.90
1706.33
1185.64
196.66
ND
26.12
ND
ND
ND
89,509.9
ND = Not Detected
2827
Int.J.Curr.Microbiol.App.Sci (2019) 8(9): 2819- 2846
Table.6 Characterization of Polycyclic aromatic hydrocarbons (PAHs) in petroleum sludge
sample used in the study
S/N
1
2
3
4
5
6
7
8
9
10
11
12
13
14
15
Name of Compound
Naphthalene
Acenaphthylene
Acenapthene
Fluorene
Phenanthrene
Anthracene
Fluoranthene
Pyrene
Benzo (a) anthracene
Chrysene
Benzo (b) fluoranthene
Benzo (k) fluoranthene
Benzo (a) pyrene
Benzo (ghi) perylene
Indeno (1,2,3-cd) pyrene
TOTAL
Conc. (ppm)
ND
0.29
1.57
2.84
5.12
0.03
2.14
0.19
ND
ND
5.36
2.55
4.12
ND
ND
24.21
ND = Not Detected
Table.7 Bacterial Counts of Water and Petroleum sludge samples
S/NO.
1
2
Type of Count
THB
HUB
Brackish Water (cfu/ml)
1.39 x 10⁶
1.1 x 10⁴
Petroleum Sludge (cfu/g)
2.5 x 10⁵
2.0 x 10⁵
Table.8 Percentage losses in TPH of various bioremediation options after 56 days in petroleum
polluted brackish water
Option
A
B
C
D
E
Percentage Loss (%)
91.8
92.5
95.1
57.8
39.5
Table.9 Identified Isolates with the GenBan Accession Numbers
S/N
1
2
3
4
5
6
7
8
Name of Organism
Klebsiella pneumoniae strain B21
Klebsiella pneumoniae strain ICB-C183
Klebsiellaoxytoca strain BCNA1
Klebsiellaoxytoca strain BC4
Alcaligenesfaecalis strain IOU PMR
Alcaligenesfaecalis strain AQ-1
Klebsiella pneumoniae strain ICB –C26
Klebsiella pneumoniae strain B21
2828
Accession Number
SUB1917764B1 KX817218
SUB1917764B2 KX817219
SUB1917764B3 KX817220
SUB1917764B4 KX817221
SUB1917764B5 KX817222
SUB1917764B6 KX817223
SUB1917764 B7 KX817224
SUB1917764 B8 KX817225
Int.J.Curr.Microbiol.App.Sci (2019) 8(9): 2819- 2846
Fig.1 Growth Profile of THB in Sludge Polluted brackish water sample during the monitoring of
various bioremediation options
9
8
7
Log of THB (cfu/ml)
6
5
4
A
B
3
C
D
E
2
1
0
0
14
28
Days
KEY
A
B
C
D
E
-
APPLICATION OF BACTERIA AND FERTILIZER
APPLICATION OF BACTERIA ONLY
APPLICATION OF FERTILIZER ONLY
NO APPLICATION
ADDITION OF BIOCIDE
2829
42
56
Int.J.Curr.Microbiol.App.Sci (2019) 8(9): 2819- 2846
Fig.2 Growth profile of HUB in sludge polluted brackish water sample during the monitoring of
the various bioremediation options
8
7
Log of HUB (cfu/g)
6
5
4
A
B
C
3
D
E
2
1
0
0
14
28
Days
KEY
A
B
C
D
E
-
APPLICATION OF BACTERIA AND FERTILIZER
APPLICATION OF BACTERIA ONLY
APPLICATION OF FERTILIZER ONLY
NO APPLICATION
ADDITION OF BIOCIDE
2830
42
56
Int.J.Curr.Microbiol.App.Sci (2019) 8(9): 2819- 2846
Fig.3 Changes in pH level in sludge polluted brackish water sample during the monitoring of the
various bioremediation options
7.2
7
pH level
6.8
6.6
A
B
C
D
6.4
E
6.2
6
0
14
28
42
Days
KEY
A
B
C
D
E
-
APPLICATION OF BACTERIA AND FERTILIZER
APPLICATION OF BACTERIA ONLY
APPLICATION OF FERTILIZER ONLY
NO APPLICATION
ADDITION OF BIOCIDE
2831
56
70
Int.J.Curr.Microbiol.App.Sci (2019) 8(9): 2819- 2846
Fig.4 Changes in salinity level in sludge polluted brackish water sample during monitoring of the
various bioremediation options
50000
45000
40000
35000
Salinity (mg/l)
30000
25000
A
B
20000
C
D
15000
E
10000
5000
0
0
14
28
42
Days
KEY
A
B
C
D
E
-
APPLICATION OF BACTERIA AND FERTILIZER
APPLICATION OF BACTERIA ONLY
APPLICATION OF FERTILIZER ONLY
NO APPLICATION
ADDITION OF BIOCIDE
2832
56
70
Int.J.Curr.Microbiol.App.Sci (2019) 8(9): 2819- 2846
Fig.5 Changes in alkalinity level in sludge polluted brackish water sample during monitoring of
the various bioremediation options
600
500
Alkalinity
400
300
A
B
200
C
D
E
100
0
0
14
28
42
Days
KEY
A
B
C
D
E
-
APPLICATION OF BACTERIA AND FERTILIZER
APPLICATION OF BACTERIA ONLY
APPLICATION OF FERTILIZER ONLY
NO APPLICATION
ADDITION OF BIOCIDE
2833
56
70
Int.J.Curr.Microbiol.App.Sci (2019) 8(9): 2819- 2846
Fig.6 Changes in conductivity level in sludge polluted brackish water sample during monitoring
of various bioremediation options
50000
45000
40000
Conductivity ( s/cm)
35000
30000
25000
A
B
20000
C
D
15000
E
10000
5000
0
0
14
28
42
Days
KEY
A
B
C
D
E
-
APPLICATION OF BACTERIA AND FERTILIZER
APPLICATION OF BACTERIA ONLY
APPLICATION OF FERTILIZER ONLY
NO APPLICATION
ADDITION OF BIOCIDE
2834
56
70
Int.J.Curr.Microbiol.App.Sci (2019) 8(9): 2819- 2846
Fig.7 Changes in BOD level in sludge polluted brackish water sample during monitoring of the
various bioremediation options
500
450
400
350
BOD (mg/l)
300
A
250
B
C
200
D
E
150
100
50
0
0
14
28
42
Days
KEY
A
B
C
D
E
-
APPLICATION OF BACTERIA AND FERTILIZER
APPLICATION OF BACTERIA ONLY
APPLICATION OF FERTILIZER ONLY
NO APPLICATION
ADDITION OF BIOCIDE
2835
56
70
Int.J.Curr.Microbiol.App.Sci (2019) 8(9): 2819- 2846
Fig.8 Changes in COD level in sludge polluted brackish water sample during monitoring of the
various bioremediation options
4000
3500
3000
COD (mg/l)
2500
2000
A
B
C
1500
D
E
1000
500
0
0
14
28
42
Days
KEY
A
B
C
D
E
-
APPLICATION OF BACTERIA AND FERTILIZER
APPLICATION OF BACTERIA ONLY
APPLICATION OF FERTILIZER ONLY
NO APPLICATION
ADDITION OF BIOCIDE
2836
56
70
Int.J.Curr.Microbiol.App.Sci (2019) 8(9): 2819- 2846
Fig.9 Changes in nitrate level in sludge polluted brackish water sample during monitoring of
various bioremediation options
8
7
6
Nitrate (mg/l)
5
4
A
B
C
3
D
E
2
1
0
0
14
28
42
Days
KEY
A
B
C
D
E
-
APPLICATION OF BACTERIA AND FERTILIZER
APPLICATION OF BACTERIA ONLY
APPLICATION OF FERTILIZER ONLY
NO APPLICATION
ADDITION OF BIOCIDE
2837
56
70
Int.J.Curr.Microbiol.App.Sci (2019) 8(9): 2819- 2846
Fig.10 Changes in phosphate level in sludge polluted brackish water sample during monitoring
of the various bioremediation options
1.8
1.6
1.4
Phosphate (mg/l)
1.2
1
A
0.8
B
C
0.6
D
E
0.4
0.2
0
0
14
28
42
Days
KEY
A
B
C
D
E
-
APPLICATION OF BACTERIA AND FERTILIZER
APPLICATION OF BACTERIA ONLY
APPLICATION OF FERTILIZER ONLY
NO APPLICATION
ADDITION OF BIOCIDE
2838
56
70
Int.J.Curr.Microbiol.App.Sci (2019) 8(9): 2819- 2846
Fig.11 Changes in sulphate level in sludge polluted brackish water sample during monitoring of
the various bioremediation options
1400
1200
Sulphate (mg/l)
1000
800
A
B
600
C
D
E
400
200
0
0
14
28
42
Days
KEY
A
B
C
D
E
-
APPLICATION OF BACTERIA AND FERTILIZER
APPLICATION OF BACTERIA ONLY
APPLICATION OF FERTILIZER ONLY
NO APPLICATION
ADDITION OF BIOCIDE
2839
56
70
Int.J.Curr.Microbiol.App.Sci (2019) 8(9): 2819- 2846
Fig.12 Changes in THC level in sludge polluted brackish water sample during monitoring of
various bioremediation options
1000
900
800
700
THC (mg/l)
600
A
500
B
C
400
D
E
300
200
100
0
0
14
28
42
Days
KEY
A
B
C
D
E
-
APPLICATION OF BACTERIA AND FERTILIZER
APPLICATION OF BACTERIA ONLY
APPLICATION OF FERTILIZER ONLY
NO APPLICATION
ADDITION OF BIOCIDE
2840
56
70
Int.J.Curr.Microbiol.App.Sci (2019) 8(9): 2819- 2846
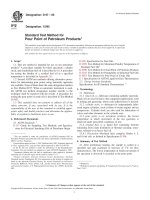
Fig.13 Agarose gel electrophoresis results of the 16S gene bands of the isolates: L: represents the
1kb ladder, N: represents the negative control, 1-8 represents 16S gene bands of the isolates
1
2
3
4 5
Generally, changes in COD, nitrate,
phosphate and sulphate showed different
trend of reduction or increase during the
remediation period in the different treatment
options (Figs. 8-11). The relative reductions
in nitrate, sulphate and phosphate levels in the
treatment options indicate that the HUB
degraders were actively utilizing the metallic
salts of the anions as sources of nitrogen and
sulphur (Odokuma and Akpokodje, 2004;
Odokuma and Okara, 2005).
There were reductions in the values of THC
from day 0 to day 56 in all the treatment
options. There was slight reduction in THC in
the control option E which is attributable to
natural attenuation (Vidali, 2001). The
reductions in the test options indicates that
hydrocarbon degraders were utilizing the
hydrocarbon in the pollutants as sources of
carbon and energy for metalbolic activities
thereby reducing the content (Ayotamuno et
al., 2011; Malik and Ahmed, 2012; Mona et
al., 2015; Macaulay, 2015).
6
L 7 8
N
9
The results of % losses in TPH showed that
treatment options C had the highest (95.1%)
followed by option B (92.51%), option A
(91.8%) and D (57.8%) respectively. This
implies that biostimulation (additions of NPK
fertilizer) could have stimulated and enhanced
degradation rate by providing the limiting
nutrients in the system required for cell
growth such as nitrogen and phosphorus
(Nester et al., 2001).
The result of % TPH loss in treatment option
D (57. 8%) which was more than in the
control option E (39.5%) and less than in
actual treatment options (A, B and C)
suggests that microorganisms (HUB) played
important role in the degradation process of
the hydrocarbon pollutants in the aquatic
system, since there was no nutrient
supplement (biostimulation) and no addition
of indigenous HUB (bioaugmentation). The
differences in the % losses of TPH in the
treatment options could be attributed to
various factors, the microbial population of
2841
Int.J.Curr.Microbiol.App.Sci (2019) 8(9): 2819- 2846
the aquatic environment (Phulia et al., 2013),
the physicochemical characteristics of the
aquatic system, available nutrients, chemical
composition and physical nature of the
pollutant
(petroleum
sludge)
and
bioremediation technology employed. The
results suggest that biostimulation with NPK
fertilizer will enhance bioremediation of
petroleum oily sludge polluted aquatic system
more
than
bioagumentation
and
a
combination of the two. These observations
from this study are in general agreement with
various studies and reports regarding the use
of biostimulation/bioaugmentation in clean-up
of hydrocarbon polluted environments
(Vidali, 2001; Odokuma and Dickson, 2003;
Mukred et al., 2008; Ayotamuno et al., 2007;
Ayotamuno et al., 2011; Mona et al., 2015;
Macualey, 2015; Crisafi, et al., 2016; Wokem
and Odokuma, 2016).
The agarose gel electrophoreses results of the
16S gene bands of the isolates are shown in
Fig. 13. The bacterial sequences submitted to
GenBank were assigned Accession Number
KX8172218-KX817225 (Table 9). From the
molecular identification of the isolates the
following organisms were implicated in the
overall hydrocarbon degradation namely;
Klebsiella pneumoniae B21, Klebsiella
pneumoniae ICB-C183, Klebsiella oxytoca
BCNAI, Klebsiellaoxytoca BC4, Alkaligenes
faecalis IOU PMR, Alacligenesfaecalis AQ-1,
Klebsiella
pneumoniae
ICB-C26
and
Klebsiella pneumoniae B21F4 Table 9.
Alkaligenes faecalis has been explored for use
to promote biodegradation of petroleum
hydrocarbons
A.
faecalis
produces
biosurfactants which possessed high surface
activity,
decreasing
surface
tension
adequately to allow for degradation of
hydrocarbon (Igwo-Ezikpwe et al., 2009).
Species identified in this study have also been
implicatedin crude oil degradation in other
studies (Rodrigues et al., 2009; Chamkha et
al., 2011; Olukunle, 2013; Chikere and
Ekwuabu, 2014).
In conclusion, the findings in the present
study indicate that petroleum oily sludge
possess serious potential environmental
hazard as a result of the high TPH and PAHs
which are known to be major contaminants.
The results of bioremediation of petroleum
sludge polluted brackish aquatic system
investigated in this study, suggests that the
use of biostimulation with NPK fertilizer, the
use of bioaugmentation with indigenous HUB
or the combination of the two techniques will
enhance and be effective in the
bioremediation of petroleum sludge polluted
aquatic system.
References
Ahirwar, S and Dehariya, R (2013). Isolation
and characterization of hydrocarbon
degrading
microorganisms
from
petroleum oil contaminated soil sites.
Bull. Environ. Sci.
Amanchukwu, S. C., Okpokwasili, G. C. and
Obafemi, A (1989). Factors affecting
hydrocarbon degradation by Schizosaccharomycespombe isolated from palm
wine. Proceedings of 1987 Seminar on
the petroleum Industry and the Nigerian
Environment. pp. 154-160. Department
of Petroleum Resources (DPR) and
Nigerian
National
Petroleum
Corporation (NNPC), Lagos, Nigeria.
American Public Health Association- APHA
(1998).
Standard
Methods
for
examination of water and waste water
20th ed. Washington DC: American
works Association, water pollution
control federation.
American Society for Testing Materials –
ASTM D7678 (1999). Standard Test
Method for total petroleum hydrocarbon
in water and wastewater with solvent
Extraction
using
Mid-IR
laser
Spectroscopy.
2842
Int.J.Curr.Microbiol.App.Sci (2019) 8(9): 2819- 2846
American Society for Testing Materials –
ASTM D8270 (1999). Standard Test
Method
for
total
petroleum
hydrocarbon-volatile
organic
compounds by Gas Chromatography.
Atlas, R. M. (1984). Microbial degradation of
petroleum
hydrocarbons:
An
environmental perspective. Microbial
Rev. 54:180-209.
Ayotamuno, M. J., Okparanma, R. N. and
Amadi, F. (2011).Enhanced remediation
of an oily sludge with saline water.Afri.
J. Environ. Sci. Tech. 5 (4): 262-267.
Ayotamuno, M. J., Okparanma, R. N., Ogaji,
S. O. T and Robert, S.D (2007)
Bioremediation of a Sludge Containing
hydrocarbon. J. Appl. Energy 84 (9):
936-943.
Balachandran,
C.,
Durapandiyan,
V.,
Balakrisina, K and Ignacimuthu, S
(2012). Petroleum and polycyclic
aromatic
hydrocarbons
(PAHs)
degradation
and
raphthalene
metabolism in Streptomyces sp. (ERICPDA-1)
isolated
from
oil
contaminated soil. Bioresour. technol.
11: 83-90.
Bhahacharyya, J. K and Shekdar, A. V
(2003).Treatment and disposal of
refinery sludge; Indian Scenario.Waste
Mgt. Res. 21 (3): 249-261.
Bundy, J. G., Paton, G. I., Campbell, C. D
(2004).Combined microbial community
level and single species biosensor
responses to monitor recovery of oil
pollutant soil.Biol. Biochem. 36 (7)
1149-11659.
Calfee, R. D., Little, E. E., Clevel, L and
Barron, M. G (1999). Photo enhanced
toxicity of a weathered oil to
ceriodaphinadubia
reproduction.
Environ. Sci. Pollut. Resour. 6: 217212.
Cébron, A., Norini, M.P., Beguiristain, T and
Leyval C. (2008). Real-time PCR
quantification
of
PHAring
hydroxylatingdioxygenase
(PAHRHDa) genes from gram positive and
gram
negative bacteria in soil and
sediment samples J. Microbiol.Methods.
73:148-159.
Chamkha, M., Trabelsi, Y., Mnif.S and
Sayadi. S (2011) Isolation
and
characterization of Klebsiellaoxytoca
strain degrading crude oil from Tunisian
off-shore fields. J. Basic Microbiol.
5(6): 580-589.
Cheesbrough, M. (2006). District Laboratory
Practice in Tropical countries, part 2,
London, Cambridge University Press.
Pp 58-100.
Chikere, C. B and Ekwwuabu, C. B. (2014).
Culture dependent characterization of
hydrocarbon utilizing bacteria in
selected oil impacted sites-in Bodo,
Ogoniland, Nigeria. Afri. J. Environ.
Sci. Technol. 8 (6): 401-406.
Chikere, C. B., Okpokwasili, G. C and
Chikere B. O. (2009). Bacterial
diversity in a tropical crude oil polluted
soil undergoing bioremediation. Afri. J.
Biotechnol. 8: 2535-2540.
Crisafi, F. Genovase, M., Smedite, F., Russso,
D., Cataliforna, M and Yokimov, M
(2016). Bioremediation techniques for
polluted sea-water sampled after an oilspill in Taranto gulf (Italy): A
comparison
of
biostimulation,
bioaugmentation and use of a washing
agent in microsom studies. Marine
Pollution Bulletin.106 (1-2): 119.
Dean-Ross, D. Moody, J., Cemigla, C.E
(2002). Utilization of mixtures of
polycyclic aromatic hydrocarbons by
bacteria isolated from contaminated
sediment. FEMS. Microb. Ecol. 4 (1):
1-7.
Delyan, U. H., Harder, M. and Hopner, T. H
(1990).Hydrocarbon biodegradation in
sediments
and
soils.Systematic
examination of physical and chemical
conditions part II pH values.
2843