Anlytic measures for adaptability of wheat genotypes for northern hills zone of country by mixed model approach
Bạn đang xem bản rút gọn của tài liệu. Xem và tải ngay bản đầy đủ của tài liệu tại đây (679.65 KB, 18 trang )
Int.J.Curr.Microbiol.App.Sci (2019) 8(10): 43-60
International Journal of Current Microbiology and Applied Sciences
ISSN: 2319-7706 Volume 8 Number 10 (2019)
Journal homepage:
Original Research Article
/>
Analytic Measures for Adaptability of Wheat Genotypes for Northern Hills
Zone of Country by Mixed Model Approach
Ajay Verma*, R. Chatrath and G. P. Singh
Division of Crop Improvement, ICAR-Indian Institute of Wheat & Barley Research,
Post Bag # 158 Agrasain Marg, Karnal 132001 (Haryana), India
*Corresponding author
ABSTRACT
Keywords
BLUE, BLUP,
Mixed Models,
PRVG, MHVG,
MHPRVG
Article Info
Accepted:
04 September 2019
Available Online:
10 October 2019
Adaptability of wheat genotypes studied by mixed model methodology under rainfed sown
trials for the Northern Hills Zone of the country. Analytic measures marked HS612,
HPW430, VL2023 & HS507 as of high yield and better adaptability across major locations
of this zone while HS615 & HS617 for low degree of adaptation as per year 2015-16.
Biplot analysis expressed stable yield of HPW349 and HPW441 genotypes. Majhera,
Ranichauri and Khudwani, would be suitable environments for stable yield of genotypes.
HPW442 had specific adaptations to Dhaulakuan and Berthin while HP441 for Almora
and VL907 for Malan and Ranichauri, whereas HPW349 and HS634 identified for
Khudwani. Genotypes HS631, HS632, VL2030 & VL 2025 were of high yield and better
adaptability across major locations of this zone while HS 635 & VL 2028 with lower level
of adaptation during 2016-17. Biplot analysis considered 86.1 % of total GxE interaction
sum of squares marked HS507, HS634, HS636 and UP2991 genotypes of stable yield.
HPW447 had specific adaptations to Wadhura, and Khudwani while VL2030 & VL2025
for Almora, whereas VL2027, UP2990 & VL2028 identified for Bajaura. Third year of
study 2017-18 identified HS562 & VL907 with yield and better adaptability. Biplot
analysis observed UP2953, HPW428 and HS613 as desirable genotypes for yield and
adaptability. VL2021, HS616, HS507, HPW425 and HPW426 had specific adaptations to
Shimla and VL2020, VL2024, HS613 would be for Almora and Malan, whereas HPW426
identified for Khudwani. Analytic measures based on Harmonic means showed suitability
to identify the better adaptive genotypes with high yield.
conditions i.e. related to climate and soils
quality that affects the crop performance
(Crespo et al., 2017). These factors may cause
low genotypic adaptability which is very
common in quantitative traits viz., yield. The
expected marginal means obtained across
several environmental are calculated to drop
out the environmental nuisance factors
Introduction
Knowledge
about
the
genotype–byenvironments interaction (GxE) effects is
necessary for efficient plant breeding
strategies (Burgueño et al., 2007). One of
main challenges faced by Indian farmers is the
wide yield variation caused by environmental
43
Int.J.Curr.Microbiol.App.Sci (2019) 8(10): 43-60
(Crossa et al., 2006). Evaluation of genotypes
under multi-environment trials (METs) is
exploited in breeding programs to study the
stability and adaptability of genotypes along
with performance prediction in different
environments (Oliveira et al., 2017).
genotypes were evaluated in field trials at
major locations of the zone during cropping
season’s viz. 2015-16, 2016-17 and 2017-18
as details are reflected in tables 1, 2 & 3 for
ready reference. Randomized block design
with three replications were used for research
field trials and recommended agronomical
practices had followed to harvest good crop.
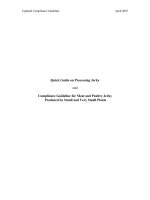
More over grain yield were further analysed as
per recent analytic adaptability measures (Fig.
1).
GxE may be understood as the phenomenon
where the genotypes show different responses
across the environments cause to it the ranking
of genotypes altered in the target
environments (Nuvunga et al., 2018). Quite
large number of methods has been cited in
literature to predict yield in different locations
(Silveira et al., 2018). Among the statistical
methods used for MET analysis mixed models
approach based on factor analysis or FA
structure has been very well appreciated as
allows genotypes and GxE interactions as
random effects and environment is fixed
(Kelly et al., 2007; Burgueño et al., 2011;
Friesen et al., 2016; Nuvunga et al., 2018). FA
method has offered advantages as compared to
traditional analysis methods in the plant
breeding (Piepho et al., 2008; Meyer, 2009;
Smith & Cullis, 2018).
The yield of g genotypes evaluated at e
environments with r replications can be
modeled as follows (Hernandez et al., 2019):
Y = Xb + Zr r + Zg g + e
where X is the incidence matrix for the fixed
effects of environments and Zr & Zg are the
incidence matrices for the random effects of
replicates within sites and genotypes within
sites that combine the main effects of
genotypes and GxE interaction. Vector b
denotes fixed effect of environments and
vectors r, g and e are the random effect of
replicates within environments, genotypes
within environments and residuals within
environments, respectively. These effects are
assumed to be random and normally
distributed with zero mean vectors and
variance - covariance matrices R, G, E
respectively, such that the joint distribution of
r, g and e is multivariate normal (Crossa et al.,
2004 & 2006)
Materials and Methods
Wheat is cultivated in the hills at different
altitudes suited to fit under different crop
rotations as per specific adaptations at
different elevations. In general sowing is done
for Northern Hills Zone under rainfed
conditions in October/November with residual
moisture and harvesting takes place in
May/June. Development of high yielding
varieties for moisture stress condition is the
major objective of wheat improvement
programmes in NHZ. Region encompasses the
hilly terrain of Northern region extending
from Jammu & Kashmir to North Eastern
States. NHZ comprises J&K (except Jammu
and Kathua distt.); Himachal Pradesh (except
Una and Paonta Valley); Uttarakhand (except
Tarai area); Sikkim, hills of West Bengal and
North Eastern states. Advanced wheat
The variance-covariance matrices R and E are
R = r Ir and E = e Irg, where Ir and Irg are
the identity matrices of order r and r x g,
respectively, r = diag (
and
e = diag (
;
are the
replicate and residual variances within the jth
environment, respectively, and is the
Kronecker (or direct) product of the two
matrices.
44
Int.J.Curr.Microbiol.App.Sci (2019) 8(10): 43-60
The factor analytic structure for G in terms of
a few unobservable factors can be expressed
as
th
jk + dij, where ik is the
random regression coefficient of the ith
genotype (loading or genotypic sensitivity) to
the kth unobserved (latent) variable related to
the
jth
environment
(environmental
potentiality),
and
is the residual
interaction term. In matrix notation, the vector
of genotypic effects is represented by g = ∆ x
+ d so that the variance-covariance of g is
V(g) = ∆V (x) ∆’ + D and, since V(x) = I,
V(g) = ∆∆’ + D. The factor analytic model
implies that the variance of the effect of ith
genotype is
+di and the covariance
VGij is the genotypic value of the i genotype,
in the j environment, expressed as a proportion
of the average in this environment. PRVG and
MHPRVG values were multiplied by the
general mean (GM) to have results in the same
magnitude as of the average wheat yield in
order to facilitate interpretation (Verardi et al.,
2009). Estimation of the variance components
were carried out by ASReml-R package using
residual maximum likelihood (REML) along
with estimation / prediction of the fixed as
well as random effects (Smith and Cullis,
2018).
of the effects of genotypes i and i’ is
.
First year (2015-16)
Results and Discussion
Average yield of genotypes as per BLUPs
identified HS612, HS507, HPW430 and
VL2021 of better adaptations along with high
yield while HS615 & UP2952 expressed low
yield. Ranking of genotypes based on
harmonic mean of BLUP’s selected HS612,
HPW430 VL2024 & VL2023 as better
adapted genotypes at the same time pointed
out suitability of HS615 & HS617 for specific
adaptations (Table 4). Average of genotypes
based on BLUE’s pointed towards HS612,
HPW430, HS507 and VL2021 as desirable
genotypes whereas as Harmonic mean
observed advantages for HS612, HPW430,
VL2024 and VL2020. Adaptability measures
PRVG & PRVG*GM pointed out HS612,
HPW430, HS507 and VL2023 for the better
adaptable behavior and HS615 & HS617 of
low adaptability under rainfed timely sown
conditions for Northern Hills Zone.
Simple and effective measure for adaptability
is based on the relative performance of genetic
values (PRVG) across environments. Resende
(2007) considered the yield & stability,
described the MHVG method (harmonic mean
of genetic values) and based on the harmonic
mean of the genotypic values. The lower the
standard deviation of genotypic performance
across environments, the greater is the
harmonic mean of genotypes. For the use of
mixed models, Resende (2007) proposed the
simultaneous analysis of stability, adaptability
and yield based on the harmonic mean of the
relative performance of the genotypic values
(MHPRVG). The MHPRVG combines the
methods PRVG and MHVG, simultaneously.
Consequently, the selection for higher values
of the harmonic mean results in selection for
both yield and stability.
Analytic
measures
HMPRVG
and
HMPRVG*GM marked HS612, HPW430,
VL2023 & HS507 as of high yield and better
adaptability across major locations of this
zone while HS615 & HS617 for low degree of
adaptation. Consensus has been observed
among analytic measures PRVG, MHVG,
PRVGij = VGij / VGi
MHVGi = Number of environments /
MHPRVGi. = Number of environments /
45
Int.J.Curr.Microbiol.App.Sci (2019) 8(10): 43-60
MHPRVG and HM-UP for the classification
of wheat genotypes (Table 4).
and HS634 identified for Khudwani. Berthin
with Dhaulakuan, Ranichauri with Malan,
Majhera with Arkot would show similar
performance of genotypes as expressed acute
angles among rays connecting these
environments. Malan had an obtuse angle with
Khudwani this would express opposite
performance of genotypes i.e. HPW349 will
not be of choice for Malan.
Only marginal variation in average yield of
wheat genotypes had been observed as per
BLUP and BLUE across locations of zone for
rainfed timely sown conditions (Figure 2).
Relatively comparable yield of genotypes
were estimated as per Best Linear Unbiased
predictors except for HS612 & HPW430.
Moreover, the heights of standard error of
genotypes were more or less same under fixed
and random effects of genotypes.
Second year (2016-17)
Mean yield of genotypes based on BLUPs
pointed towards HPW447, HS631, HS632 &
VL2030 of better adaptations along with high
yield while HS635 & HS637 expressed low
yield. Ranking of genotypes based on
harmonic mean of BLUP’s selected HS631,
HS632, VL2030 & VL2025 as better adapted
genotypes at the same time pointed out
suitability of HS 635 & VL2028 for specific
adaptations (Table 5). Mean yield of
genotypes as per BLUE’s identified HS631,
HPW447, HS632 & VL2030 as desirable
genotypes whereas as Harmonic mean
observed advantages for HS631, HS632,
VL2030 & VL2025. PRVG as well as by
PRVG*GM pointed out HS631, HS632,
HPW447 & VL2030 for the better adaptable
behavior and HS635 & VL2028 of low
adaptability for Northern Hills Zone. Recent
measures of adaptability HMPRVG and
HMPRVG*GM marked HS631, HS632,
VL2030 & VL2025 of high yield and better
adaptability across major locations of this
zone while HS635 & VL2028 as for low
degree of adaptation. Consensus has been
observed among analytic measures PRVG,
MHVG, MHPRVG, and HM-UP for the
classification of wheat genotypes (Table 6).
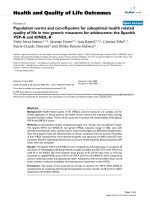
Genotypes or environments located near the
origin of the coordinate system in the Biplot
presentations
were
considered
stable;
however, the more distant from the source the
lower the stability of the wheat yield; these
effects are due to the nature of the G x E
interaction. A genotype is considered adapted
to a particular environment when it is situated
in the same quadrant of the environment (Yan
and Kang, 2003). Biplot analysis based on
first two highly significant Interaction
Principal Components expressed stable yield
of HPW349 and HPW441 genotypes. HS507,
HS562, HS634 and VL907 would be good
genotypes for specific adaptations. These two
significant interaction principal components,
accounted for 90.3 % of total GxE interaction
sum of squares (Figure 5). Majhera,
Ranichauri and Khudwani, would be suitable
environments for stable yield of genotypes.
Environments Bajura, Malan and Dhaulakuan
observed as larger contributor to the G x E
interactions, because as positioned relatively
away from the origin.
Genotypes and environments placed in
proximity have positive associations as these
observations would enable to identify specific
adaptations of the genotypes. HPW442 had
specific adaptations to Dhaulakuan and
Berthin while HP441 for Almora and VL907
for Malan and Ranichauri, whereas HPW349
Variation in average yield of wheat genotypes
had been observed as per BLUP and BLUE
across locations of zone (Figure 3). Relatively
higher yield of genotypes were estimated as
per Best Linear Unbiased Estimators except
46
Int.J.Curr.Microbiol.App.Sci (2019) 8(10): 43-60
for HPW444 & HS637. Moreover, the heights
of standard error of genotypes were more
under fixed effects of genotypes.
Harmonic mean observed advantages for
VL907 & HS562. PRVG as well as by
PRVG*GM pointed out HS562 & VL907 for
the better adaptable behavior and HS634 of
low adaptability under rainfed conditions of
Northern Hills Zone. Most cited analytic
measures HMPRVG and HMPRVG*GM
marked HS562 & VL907 of high yield and
better adaptability across major locations of
this zone while HS634 as for low degree of
adaptation. Analytic measures PRVG,
MHVG, MHPRVG, and HM-UP showed
consensus for the classification of wheat
genotypes (Table 6).
Biplot analysis based on first two highly
significant Interaction Principal Components
expressed stable yield of HS507, HS634,
HS636 and UP2991 genotypes. HPW447,
VL2028 and HS637 would be good for
specific adaptations. First two significant
interaction principal components contributed
86.1 % to total GxE interaction sum of squares
(Figure 6). Malan and Bajaura would be
suitable environments for stable yield of
genotypes. Environments Shimla, Wadhua and
Khudwani positioned relatively away from the
origin.
Marginal variation in average yield of wheat
genotypes had been observed as per BLUP
and BLUE across locations of zone for rainfed
sown conditions (Figure 4). Relatively more
yield of genotypes was estimated as per Best
Linear Unbiased Estimators except for HS634
& HPW441. Moreover, the heights of standard
error of genotypes were more under fixed
effects of genotypes.
Genotypes and environments placed in
proximity have positive associations enable to
identify specific adaptations. HPW447 had
specific adaptations to Wadhura, and
Khudwani while VL2030 & VL2025 for
Almora, whereas VL2027, UP2990 &
VL2028 identified for Bajaura. Malan with
Almora and Bajaura whereas Wadura with
Khudwani would show similar performance of
genotypes as expressed acute angles among
rays connecting these environments. Shimla
had an obtuse angle with Wadura this would
express opposite performance of genotypes
i.e. HPW447 will not be of choice for Shimla.
Biplot analysis based on first two highly
significant Interaction Principal Components
observed stable yield of genotypes UP2953,
HPW428 and HS613. Genotypes HS612,
HS615 and HPW427 would be good for
specific adaptations. These two significant
interaction principal components, accounted
for 84.4 % of total GxE interaction sum of
squares (Figure 7). Shimla and Malan would
be suitable environments for stable yield of
genotypes. Environments Almora and
Khudwani positioned relatively away from the
origin.
Third year (2017-18)
Mean yield of genotypes by considering
BLUP values identified HS562 & HPW442 of
better adaptations along with high yield while
HS507 expressed low yield. Ranking of
genotypes based on harmonic mean of
BLUP’s selected VL907 & HS562 as better
adapted genotypes at the same time pointed
out suitability of HS634 for specific
adaptations (Table 6). Average of genotypes
based on BLUE’s pointed towards HS562 &
HPW441 as desirable genotypes whereas as
Genotypes and environments placed in
proximity would have positive associations.
VL2021, HS616, HS507, HPW425 and
HPW426 had specific adaptations to Shimla
and VL2020, VL2024, HS613 would be for
Almora and Malan, whereas HPW426
identified for Khudwani.
47
Int.J.Curr.Microbiol.App.Sci (2019) 8(10): 43-60
Table.1 Parentage and location details under multi environmental trials (2015-16)
Genotype
Parentage
Locations
Latitude
HPW 425
(VL832/WH423)
Almora
29° 35' N
VL2022
(EC635640)
Khudwani
33° 70' N
VL2019
(RWP20022/SW89.3218//AGRI/NAC//VL905)
(HPW42/HPW236)
Malan
32°08' N
Shimla
31°10' N
HPW431
HPW430
UP2953
VL2024
VL2023
HPW427
HS616
HS612
HPW429
HS507©
HPW426
UP2952
HS615
HPW428
HS613
HS614
HS617
VL907©)
VL2020
VL2021
HS618
(HPW249/HPW211)
(WBLL1/KUKUNA//TACUPETO
F2001/3/KIRITATI)
(W15.92/4/PASTOR//HXL7573/2*BAU/3/W
BLL1/5/MUNAL)
(ATTILA/3/WEAVER*2/TSC//WEAVER/4/
ATTILA/PASTOR)
(VL616/FLW3)
(SOKOLL/3/PASTOR//HXL7573/2*BAU)
(SERI.1B*2/3KAUZ*2/BOW//KAUZ*2/5/C
NO79/PF70354/MUS/3/PASTOR/4/BAV92)
(ESWYT(2008)115/HPW211)
(KAUZ/MYNA/VUL//BUC/FLK/4/MILAN)
(HPW155/HD29)
(MILAN/S87230//BAV92*2/3/AKURI)
(BERKUT/HTG)
(HPW155/HD29)
(WBM1587/VL824)
(HPW155/CHINESE LINE 14)
(PASTOR/3/CROC1/AE.SQUARROSA(224)//OPATA/4/BERK
UT)
(DYBR 1982-83/842 ABVD 50/VW
9365//PBW 343
(KLEIBER/2*FL80/DONSK.POLL/AKAW4
006)
(KLEIBER/2*FL80/DONSK.POLL/GW2000
-18)
(BERKUT/HTG)
48
Longi
tude
79°
39'E
75°10'
E
76°35'
E
77°17'
E
Altit
ude
1610
1590
846
2276
Int.J.Curr.Microbiol.App.Sci (2019) 8(10): 43-60
Table.2 Parentage and location details under multi environmental trials (2016-17)
Genotype
HS 631
HS 632
HS 633
HS 634
HS 635
HS 636
HS 637
HPW 441
HPW 442
HPW 443
HPW 444
HPW 445
HPW 446
HPW 447
VL 2025
VL 2026
VL 2027
VL 2028
VL 2029
VL 2030
UP 2990
UP 2991
VL 907
HS 507
Parentage
(WHEAR/VIVITSI//WHEAR)
(HS240*2/FLW20(LR19)//HS240*2/FLW13(YR15)
(HS240*2/FLW20(LR19)//HS240*2/FLW13(YR15)
(PBW343*2/KUKUNA/5/CNO79//PF73054/MUS/3/PASTOR/4/BAV92)
(PFAU/MILAN/5/CHEN/AE.SQUARROSA(TAUS)//BCN/3/VEE#7/BOW/4/PASTOR)
(PASTOR//KAUZ/6/CNDO/R143//ENTE/MEX12/3/AEGILOPSSQUARROSA(TAUS)/4/WEAVER/5/2*KAUZ)
(PRL/2*PASTOR)
(NAC/TH.AC//3*MIRLO/BUC/4/PASTOR)
(LONG291*2/PASTOR)
(PASTOR//HXL7573/2*BAU/3/SOKOLL/WBLL1)
(AZAR2/4/CROC_1/AE.SQUARROSA (205)//BORL95/3/2*MILAN/5/BERKUT)
(PBW575/HPW251)
(BOW/URES//KEA/3/SITE)
(HPW266/HPW249)
(LBPY04-1/RAJ4132//HS490)
(GW366/KS82W428/SWM75740//UP2739)
(RAJ4083/SKAUZ/HATUSA//VL900)
(FRANCOLIN#1*2/MUU)
(MUNAL#1/FRANCOLIN#1)
(KA/NAC//TRCH/3/DANPHE#1)
(UP2744/WL711//PBW644)
(SOKOLL/3/PASTOR//HXL7573/2*BAU/4/SOKOLL/WBLL1)
(DYBR1982-8384ABVD50/VW9365//PBW343)
(KAUZ/MYNA/VUL//BUC/FLK/4/MILAN)
49
Locations
Almora
Bajaura
Khudwani
Malan
Shimla
Wadura
Latitude
29° 35' N
31°84'N
33° 70' N
32°08' N
31°10' N
21° 18' N
Longitude
79° 39'E
77°16 'E
75°10' E
76°35'E
77°17'E
77° 41' E
Altitude
1610
1099
1590
846
2276
508
Int.J.Curr.Microbiol.App.Sci (2019) 8(10): 43-60
Table.3 Parentage and location details under multi environmental trials (2017-18)
Genotype Parentage
HPW 349 (NAC/TH.AC//3*MIRLO/BUC/4/2*PASTOR)
Locations
Akrot
Latitude
31°4'N
Longitude Altitude
76°1'E
425
HS 634
(PBW343*2/KUKUNA/5/CNO79//PF73054/MUS/3/PASTOR/4/BAV92) Almora
29° 35' N
79° 39 'E
1610
VL 907
(DYBR1982-83842ABVD50/VW9365//PBW343)
Bajaura
31°84 'N
77°16'E
1099
HS 507
(KAUZ/MYNA/VUL//BUC/FLK/4/MILAN)
Berthin
31°50 'N
77°9 'E
1103.85
HPW 441 (NAC/TH.AC//3*MIRLO/BUC/4/PASTOR)
Dhaulakuan 30°16' N
74°56'E
468
HPW 442 (LONG291*2/PASTOR)
Khudwani
33° 70' N
75°10' E
1590
Majhera
29° 16' N
80° 5' E
1532
Malan
32°08' N
76°35'E
846
Ranichauri
28° 43' N
81°02' E
2200
Shimla
31°10' N
77°17'E
2276
HS 562
(OASIS/SKUAZ//4*BCN/3/2*PASTOR)
50
Int.J.Curr.Microbiol.App.Sci (2019) 8(10): 43-60
Table.4 Analytic measures of adaptability for wheat genotypes (2015-16)
Genotype
HPW 425
VL2022
VL2019
HPW431
HPW430
UP2953
VL2024
VL2023
HPW427
HS616
HS612
HPW429
HS507
HPW426
UP2952
HS615
HPW428
HS613
HS614
HS617
VL907
VL2020
VL2021
HS618
BLUP
27.22
21.66
23.76
22.56
28.16
25.74
26.56
27.73
22.67
26.24
29.23
24.57
28.28
26.66
21.11
19.55
26.05
25.71
23.55
21.21
23.56
26.54
27.86
25.16
Rk
6
21
16
20
3
12
8
5
19
10
1
15
2
7
23
24
11
13
18
22
17
9
4
14
HM-UP
24.63
20.36
23.67
21.10
25.60
22.24
25.36
25.30
20.12
23.58
28.46
23.66
24.93
23.63
20.93
19.04
21.91
24.29
20.62
20.04
23.33
25.20
24.62
22.78
Rk
7
21
10
18
2
16
3
4
22
13
1
11
6
12
19
24
17
9
20
23
14
5
8
15
BLUE
27.15
21.37
23.85
22.45
28.40
25.68
26.77
27.76
22.33
26.41
29.75
24.67
28.25
26.71
20.91
19.31
25.82
25.75
23.19
21.01
23.61
26.66
28.25
25.21
Rk
6
21
16
19
2
13
7
5
20
10
1
15
3
8
23
24
11
12
18
22
17
9
4
14
HM-UE
24.36
20.03
23.79
20.89
25.82
21.83
25.51
25.29
19.13
23.53
29.08
23.74
24.80
23.50
20.76
18.74
21.29
24.35
20.10
19.73
23.42
25.37
24.60
22.68
Rk
8
21
10
18
2
16
3
5
23
12
1
11
6
13
19
24
17
9
20
22
14
4
7
15
PRVG
1.0737
0.8685
0.9991
0.9041
1.1078
0.9988
1.0777
1.0938
0.8927
1.0303
1.1991
1.0000
1.0977
1.0387
0.8812
0.8103
0.9955
1.0316
0.9112
0.8578
0.9819
1.0685
1.0896
0.9904
Rk
7
22
13
19
2
14
6
4
20
11
1
12
3
9
21
24
15
10
18
23
17
8
5
16
PRVG*GM
26.90
21.76
25.03
22.65
27.76
25.02
27.00
27.41
22.37
25.81
30.04
25.06
27.50
26.03
22.08
20.30
24.94
25.85
22.83
21.49
24.60
26.77
27.30
24.82
Rk
7
22
13
19
2
14
6
4
20
11
1
12
3
9
21
24
15
10
18
23
17
8
5
16
HPVRG
1.0601
0.8653
0.9599
0.8987
1.1047
0.9688
1.0676
1.0861
0.8728
1.0217
1.1839
0.9924
1.0805
1.0287
0.8558
0.7851
0.9669
1.0305
0.9005
0.8474
0.9557
1.0652
1.0710
0.9844
Rk
8
21
16
19
2
14
6
3
20
11
1
12
4
10
22
24
15
9
18
23
17
7
5
13
HPVRG*GM
26.56
21.68
24.05
22.52
27.68
24.28
26.75
27.21
21.87
25.60
29.66
24.87
27.07
25.77
21.44
19.67
24.23
25.82
22.56
21.23
23.95
26.69
26.83
24.67
Rk
8
21
16
19
2
14
6
3
20
11
1
12
4
10
22
24
15
9
18
23
17
7
5
13
BLUP ( average of values); HM-UP (Harmonic mean of BLUP); MHVG( Harmonic mean of the genotypic values); PRVG(Relative performance of genotypic
values); GM (Overall average); MHPRVG ( harmonic mean of the relative performance of the predicted genotypic values); Rk (rank of genotypes)
51
Int.J.Curr.Microbiol.App.Sci (2019) 8(10): 43-60
Table.5 Analytic measures of adaptability for wheat genotypes (2016-17)
Genotype
HS 631
HS 632
HS 633
HS 634
HS 635
HS 636
HS 637
HPW 441
HPW 442
HPW 443
HPW 444
HPW 445
HPW 446
HPW 447
VL 2025
VL 2026
VL 2027
VL 2028
VL 2029
VL 2030
UP 2990
UP 2991
VL 907
HS 507
BLUP
31.62
31.46
29.07
29.20
26.67
28.89
27.50
27.95
29.15
28.73
27.78
28.41
28.66
31.63
30.29
30.13
30.10
27.63
28.81
30.72
29.90
29.11
29.61
28.76
Rk
2
3
13
10
24
14
23
20
11
17
21
19
18
1
5
6
7
22
15
4
8
12
9
16
HM-UP
29.69
29.65
26.97
26.82
24.66
27.25
26.52
26.89
26.94
26.09
25.32
27.17
27.89
26.86
28.89
27.82
27.99
24.71
26.74
29.24
28.10
27.66
28.48
26.88
Rk
1
2
13
18
24
11
20
15
14
21
22
12
8
17
4
9
7
23
19
3
6
10
5
16
BLUE
31.95
31.84
30.19
28.87
26.28
29.02
27.13
27.69
28.98
28.67
27.37
28.54
28.88
31.91
30.42
30.16
30.15
27.53
28.80
30.97
30.00
29.06
29.78
28.63
Rk
1
3
6
15
24
12
23
20
13
17
22
19
14
2
5
7
8
21
16
4
9
11
10
18
HM-UE
30.11
30.08
28.33
25.72
24.12
27.48
26.05
26.45
26.63
25.99
24.44
27.56
28.14
26.29
28.92
27.67
27.83
24.70
26.65
29.47
28.22
27.57
28.79
26.57
Rk
1
2
6
21
24
13
19
17
15
20
23
12
8
18
4
10
9
22
14
3
7
11
5
16
PRVG
1.0789
1.0755
0.9892
0.9888
0.9074
0.9895
0.9635
0.9701
0.9909
0.9750
0.9388
0.9781
1.0033
1.0578
1.0447
1.0225
1.0290
0.9346
0.9805
1.0562
1.0218
0.9992
1.0238
0.9809
Rk
1
2
14
15
24
13
21
20
12
19
22
18
10
3
5
8
6
23
17
4
9
11
7
16
PRVG*GM
31.55
31.45
28.93
28.91
26.53
28.93
28.17
28.37
28.98
28.51
27.45
28.60
29.34
30.93
30.55
29.90
30.09
27.33
28.67
30.88
29.88
29.22
29.94
28.68
Rk
1
2
14
15
24
13
21
20
12
19
22
18
10
3
5
8
6
23
17
4
9
11
7
16
HPVRG
1.0755
1.0707
0.9832
0.9859
0.8960
0.9843
0.9343
0.9583
0.9866
0.9627
0.9339
0.9757
0.9834
1.0221
1.0362
1.0187
1.0205
0.9169
0.9783
1.0521
1.0210
0.9984
1.0183
0.9773
Rk
1
2
15
12
24
13
21
20
11
19
22
18
14
5
4
8
7
23
16
3
6
10
9
17
HPVRG*GM
31.45
31.31
28.75
28.83
26.20
28.78
27.32
28.02
28.85
28.15
27.31
28.53
28.76
29.89
30.30
29.79
29.84
26.81
28.61
30.76
29.86
29.19
29.78
28.58
Rk
1
2
15
12
24
13
21
20
11
19
22
18
14
5
4
8
7
23
16
3
6
10
9
17
BLUP ( average of values); HM-UP (Harmonic mean of BLUP); MHVG( Harmonic mean of the genotypic values); PRVG(Relative performance of genotypic
values); GM (Overall average); MHPRVG ( harmonic mean of the relative performance of the predicted genotypic values); Rk (rank of genotypes)
52
Int.J.Curr.Microbiol.App.Sci (2019) 8(10): 43-60
Table.6 Analytic measures of adaptability for wheat genotypes (2017-18)
Genotype
HPW 349
HS 634
VL 907
HS 507
HPW 441
HPW 442
HS 562
BLUP
26.51
26.28
25.91
25.66
26.46
26.70
27.20
Rk
3
5
6
7
4
2
1
HM-UP
17.62
15.78
19.27
17.54
18.21
17.24
18.74
Rk
4
7
1
5
3
6
2
BLUE
26.51
26.94
26.24
26.32
27.15
26.78
28.23
Rk
5
3
7
6
2
4
1
HM-UE
17.08
16.25
19.65
17.91
18.59
16.93
19.54
Rk
5
7
1
4
3
6
2
PRVG
0.9943
0.9438
1.0402
0.9816
1.0120
0.9867
1.0414
Rk
4
7
2
6
3
5
1
PRVG*GM
26.24
24.91
27.45
25.90
26.71
26.04
27.48
Rk
4
7
2
6
3
5
1
HPVRG
0.9937
0.9232
1.0222
0.9711
1.0112
0.9811
1.0387
Rk
4
7
2
6
3
5
1
HPVRG*GM
26.22
24.36
26.97
25.63
26.68
25.89
27.41
Rk
4
7
2
6
3
5
1
BLUP ( average of values); HM-UP (Harmonic mean of BLUP); MHVG( Harmonic mean of the genotypic values); PRVG(Relative performance of genotypic
values); GM (Overall average); MHPRVG ( harmonic mean of the relative performance of the predicted genotypic values); Rk (rank of genotypes)
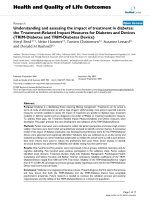
Fig.1 Agro climatics zones for wheat cultivation in country
53
20
54
34
32
30
28
26
24
22
VL2020
VL907
HS617
HS614
HS613
HS618
36
HS 507
BLUE
VL2021
Fig.3 Average yield of wheat genotypes along with standard errors (2016-17)
VL 907
UP 2991
UP 2990
VL 2030
VL 2029
VL 2028
HPW428
HS615
UP2952
HPW426
BLUP
VL 2027
VL 2026
BLUP
VL 2025
HPW 447
HS507
HPW429
HS612
HS616
HPW427
VL2023
VL2024
UP2953
HPW430
HPW431
VL2019
VL2022
40
HPW 446
HPW 445
HPW 444
HPW 443
38
HPW 442
HPW 441
HS 637
HS 636
HS 635
HS 634
HS 633
HS 632
HPW 425
0
HS 631
Int.J.Curr.Microbiol.App.Sci (2019) 8(10): 43-60
Fig.2 Average yield of wheat genotypes along with standard errors (2015-16)
BLUE
35
30
25
20
15
10
5
Int.J.Curr.Microbiol.App.Sci (2019) 8(10): 43-60
Fig.4 Average yield of wheat genotypes along with standard errors (2017-18)
35
BLUP
BLUE
30
25
20
15
10
HPW 349
HS 634
VL 907
HS 507
55
HPW 441
HPW 442
HS 562
Int.J.Curr.Microbiol.App.Sci (2019) 8(10): 43-60
Fig.5 Biplot analysis of wheat genotypes vis-à-vis environments for irrigated timely sown trials
(2015-16)
0.7
PC1 =63.46; PC2 =20.92; Total =84.38 %
Almora
VL2019
0.6
HS612
0.5
VL907
UP2952
0.4
Malan
0.3
HS615
VL2020
HM-UE
0.2
HM-UP
HPW429
HS617
VL2024
HS613
0.1
VL2022
HPW431
-1.1
-1
-0.9
-0.8
-0.7
-0.6
-0.5
-0.4
0
-0.3
-0.2
-0.1
0
0.1
0.2
0.3
0.4
0.5
PRVG
PRVG*GM
VL2023
HPVRG
HPVRG*GM
0.6
0.7
0.8
0.9
1
1.1
1.2
-0.1
UP2953
HPW 425 HS507
HPW430
BLUE
BLUP
-0.2 HS618
Shimla
VL2021
-0.3
HS616
HS614
HPW426
-0.4
HPW427
-0.5
-0.6
Khudwani
HPW428
-0.7
0.7
Almora
VL2019
0.6
HS612
0.5
VL907
UP2952
0.4
Malan
0.3
HS615
VL2020
HM-UE
0.2
HM-UP
HPW429
HS617
VL2024
HS613
0.1
VL2022
HPW431
-1.1
-1
-0.9
-0.8
-0.7
-0.6
-0.5
-0.4
0
-0.3
-0.2
-0.1
0
0.1
0.2
0.3
0.4
0.5
PRVG
PRVG*GM
VL2023
HPVRG
HPVRG*GM
0.6
0.7
0.8
-0.1
UP2953
HPW 425 HS507
Shimla
VL2021
-0.3
HS616
HS614
HPW426
-0.4
HPW427
-0.5
-0.6
Khudwani
HPW428
-0.7
56
HPW430
BLUE
BLUP
-0.2 HS618
0.9
1
1.1
1.2
Int.J.Curr.Microbiol.App.Sci (2019) 8(10): 43-60
Fig.6 Biplot analysis of wheat genotypes vis-à-vis environments for irrigated timely sown trials
(2016-17)
0.8
PC1 =71.98; PC2 =14.11; Total =86.09 %
HS 637
Shimla
0.7
0.6
0.5
HPW 446
0.4
HPW 441
0.3
VL 2025
HM-UP
HM-UE
VL 2030
0.2
VL 907
0.1
HPW 445
-0.9
HS 635
-0.8
-0.7
-0.6
-0.5
-0.4
-0.3
HS 632
0.1
0.2
-0.1
0.3
2990
VLUP
2026
0.4
0.5
0.6
0.7
0.8
VL 2027
VL 2029
HPW 444
HS 631
HPVRG
HPVRG*GM
PRVG
PRVG*GM
Malan
0
HS 636
HS
-0.1507
HS 634 0
-0.2
Almora
UP 2991
BLUE
BLUP
Bajaura
HS 633
-0.2
HPW 442
HPW 443
-0.3
VL 2028
-0.4
-0.5
-0.6
Khudwani
Wadura
-0.7
HPW 447
-0.8
0.8
HS 637
Shimla
0.7
0.6
0.5
HPW 446
0.4
HPW 441
0.3
VL 2025
HM-UP
HM-UE
VL 2030
0.2
VL 907
0.1
HPW 445
-0.9
HS 635
-0.8
-0.7
-0.6
-0.5
-0.4
-0.3
-0.2
0
HS 636
HS
-0.1507
HS 634 0
-0.1
VL 2029
HPW 444
Almora
HS 632
UP 2991
HS 633
-0.2
HPW 442
HS 631
HPVRG*GM
HPVRG
PRVG
PRVG*GM
Malan
0.1
0.2
0.3
2990
VLUP
2026
0.4
0.5
VL 2027
BLUE
BLUP
Bajaura
HPW 443
-0.3
VL 2028
-0.4
-0.5
-0.6
-0.7
Khudwani
Wadura
HPW 447
-0.8
57
0.6
0.7
0.8
Int.J.Curr.Microbiol.App.Sci (2019) 8(10): 43-60
Fig.7 Biplot analysis of wheat genotypes vis-à-vis environments for irrigated timely sown
trials (2017-18)
0.7
HS 562
PC1 =55.51; PC2 =34.83; Total =90.34 %
Berthin
0.6
BLUP
HPW 442
Dkuan
0.5
Bajaura
BLUE
0.4
Khudwani
0.3
0.2
HPW 349
HPVRG*GM
HPVRG
PRVG
PRVG*GM
-0.9
-0.8
-0.7
-0.6
-0.5
-0.4
Almora
Shimla
HM-UP
HM-UE
0.1
HPW 441
-0.3
-0.2
HS 634
0
-0.1
0
0.1
0.2
0.3
0.4
0.5
0.6
0.7
0.8
0.9
1
1.1
-0.1
-0.2
Majhera
-0.3
Rchauri
-0.4
Akrot
-0.5
VL 907
Malan -0.6
-0.7
-0.8
-0.9
HS 507
-1
0.7
HS 562
Berthin
0.6
BLUP
HPW 442
Dkuan
0.5
Bajaura
BLUE
0.4
Khudwani
0.3
0.2
HPW 349
HPVRG*GM
HPVRG
PRVG
PRVG*GM
-0.9
-0.8
-0.7
-0.6
-0.5
-0.4
Almora
Shimla
HM-UP
HM-UE
0.1
HPW 441
-0.3
-0.2
HS 634
0
-0.1
0
0.1
0.2
0.3
0.4
-0.1
-0.2
Majhera
-0.3
Rchauri
-0.4
Akrot
-0.5
VL 907
Malan -0.6
-0.7
-0.8
-0.9
HS 507
-1
58
0.5
0.6
0.7
0.8
0.9
1
1.1
Int.J.Curr.Microbiol.App.Sci (2019) 8(10): 43-60
Malan with Almora, Shimla with Khudwani
would show similar performance of genotypes
as expressed acute angles among rays
connecting these environments. Khudwani had
an obtuse angle with Almora this would
express different performance of genotypes
for both locations.
genotypes. Crop Sci. 47: 311-320.
Burgueño J, Crossa J, Cotes JM, Vicente FS,
Das B 2011. Prediction assessment of
linear mixed models for multi
environment trials. Crop Sci. 51: 944954.
Crespo-Herrera LA, Crossa J, Huerta-Espino
J, Autrique E, Mondal S, Velu G.
2017. Genetic yield gains in
CIMMYT’s International Elite Spring
Wheat Yield Trials by modeling the
genotype × environment interaction.
Crop Sci. 57:789–801.
Crossa J, Burgueno J, Cornelius PL, McLaren
G, Trethowan R and Krishnamachari A
2006.
Modeling
genotype
×
environment interaction using additive
genetic covariances of relatives for
predicting breeding values of wheat
genotypes. Crop Sci. 46:1722–1733.
Crossa J, Yang RC and Cornelius PL 2004.
Studying crossover genotype ×
environment interaction using linearbilinear models and mixed models. J.
Agric. Biol. Environ. Stat. 9:362–380.
Friesen LF, Brule-Babel AL, Crow GH and
Rothenburger PA 2016. Mixed model
and stability analysis of spring wheat
genotype yield evaluation data from
Manitoba, Canada. Can. J. Plant Sci.
96(2): 305–320.
Hernández M V, Ortiz-Monasterio I, PérezRodríguez P, Montesinos-López O A,
Montesinos-López A, Burgueño J and
Crossa J 2019. Modeling Genotype ×
Environment Interaction Using a
Factor Analytic Model of On-Farm
Wheat Trials in the Yaqui Valley of
Mexico Agron. J. 111:1–11.
Kelly A, Smith A, Eccleston J and Cullis B
2007. The accuracy of varietal
selection using factor analytic models
for multi environment plant breeding
trials. Crop Sci. 47:1063–1070
Kleinknecht K, Laidig F, Piepho HP and
Möhring J 2011. Best linear unbiased
The different analytic measures to estimate the
adaptability of advanced wheat genotypes
allow identifying and recommending efficient
genotypes to the best environments to obtain
increased yield (Mendes et al., 2012). Prime
objective of wheat improvement is to identify
genotypes with wider adaptations as well as
good average yield even in heterogeneous
environments.
Although, these conditions are not easy to
satisfy, to increase wheat productivity at
national level, it is very important to
recommend wheat genotypes as per specific
adaptations (Silveira et al., 2018). Proper
exploitation of these specific positive
interactions (Kleinknecht et al., 2011) in
rational manner contributes to improve wheat
productivity in Northern Hills Zone of the
country.
Acknowledgements
Guidance of Dr J Crossa and financial support
extended by Dr AK Joshi and Dr RP Singh,
CIMMYT Mexico sincerely acknowledge by
authors. Efforts of staff, working at various
centers, are highly appreciated for field
evaluation under coordinated system of wheat.
References
Burgueño J, Crossa J, Cornelius PL,
Trethowan R, McLaren G and
Krishnamachari A 2007. Modeling
additive x environment and additive x
additive x environment using genetic
covariances of relatives of wheat
59
Int.J.Curr.Microbiol.App.Sci (2019) 8(10): 43-60
prediction (BLUP): Is it beneficial in
official variety performance trials?
Biuletyn Oceny Odmian 33:21–33.
Mendes F F, Guimarães L J M, Souza J C,
Guimarães P E O, Pacheco C A P,
Machado J R de A, Meirelles W F,
Silva A R da & Parentoni S 2012.
Adaptability and stability of maize
varieties
using
mixed
model
methodology. Crop Breeding and
Applied Biotechnology. 12(2): 111117.
Meyer K 2009. Factor-analytic models for
genotype x environment type problems
and structured covariance matrices.
Genet Sel Evol. 41: 21.
Nuvunga J J, Oliveira L A, Silva C P,
Pamplona A KA, Silva A Q, Moura E
G, Maleia M P, and Balestre M. 2018.
Adaptability and stability of cotton
cultivars (Gossypium hirsutum L. race
latifolium H.) using factor analytic
model. Genet. Mol. Res. 17 (1):1-10.
Oliveira I, Atroch A, Costa Dias M,
Guimarães L and Evaristo P 2017.
Selection of corn cultivars for yield,
stability, and adaptability in the state
of Amazonas, Brazil. Pesq. agropec.
bras., Brasília. 52(6):455-463.
Piepho HP, Möhring J, Melchinger AE and
Büchse A 2008. BLUP for phenotypic
selection in plant breeding and variety
testing. Euphytica. 161: 209-228.
Resende MDV.2007. Seleção genômica ampla
(GWS) e modelos lineares mistos. In
Resende MDV (ed) Matemática e
estatística na análise de experimentos e
no melhoramento genético. Embrapa
Florestas, Colombo, p. 517-534.
Silveira D A, Bahry C A, Pricinotto L F,
Nardino M, Carvalho I R, Souza V Q
de 2018. Adaptability and stability of
grain yield in soybean. Aust J Crop
Science. 12(05):717-725.
Smith A B and Cullis B R 2018. Plant
breeding selection tools built on factor
analytic mixed models for multienvironment trial data. Euphytica.
214(8):143-161.
Verardi CK, Resende MDZV, Costa RB and
Gonçalves PS 2009. Adaptabilidade e
estabilidade da produção de borracha e
seleção em progênies de seringueira.
Pesquisa Agropecuária Brasileira 44:
1277-1282.
Yan W and Kang M S 2003. GGE Biplot
Analysis: A Graphical Tool for
Breeders,
Geneticists,
and
Agronomists. CRC Press. 228p.
How to cite this article:
Ajay Verma, R. Chatrath and Singh, G. P. 2019. Analytic Measures for Adaptability of Wheat
Genotypes for Northern Hills Zone of Country by Mixed Model Approach.
Int.J.Curr.Microbiol.App.Sci. 8(10): 43-60. doi: />
60