Growth performance and marketing of maize in Karnataka, India
Bạn đang xem bản rút gọn của tài liệu. Xem và tải ngay bản đầy đủ của tài liệu tại đây (289.67 KB, 8 trang )
Int.J.Curr.Microbiol.App.Sci (2019) 8(10): 380-387
International Journal of Current Microbiology and Applied Sciences
ISSN: 2319-7706 Volume 8 Number 10 (2019)
Journal homepage:
Original Research Article
/>
Growth Performance and Marketing of Maize in Karnataka, India
Murulidhar M. Venkannanvara1*, G. M. Gaddi2 and C. P. Gracy3
1
Department of ABM, UAS, Dharwad, India
Department of Agriculture Economics, UAS, Bengaluru, India
3
Department of Agricultural Marketing, Cooperation and Agribusiness Management,
UAS, Bengaluru, India
2
*Corresponding author
ABSTRACT
Keywords
Carbohydrate,
Starch, Fiber and
protein
Article Info
Accepted:
04 September 2019
Available Online:
10 October 2019
Maize (Zea mays) is one of the important cereal crops of the World and gaining lot
of importance in animal feed and other industry uses. The present study aimed at
assessing the growth performance maize and efficiency of identified marketing
channels in major APMC’s for maize of Karnataka viz. Davanagere, Haveri and
Hassan of the Karnataka state. The secondary data on maize area, production and
yield collected for fifteen years from 1990-91. The primary data were collected
from 60 maize growing farmers, 15 commission agents, 15 village merchant /
traders in equal proportion operating in three selected APMCs using random
sampling technique. The results of the study revealed two major marketing
channels for maize. The Channel-I was practiced by 66.66 per cent of the
respondents and Channel-II adopted by 33.33 per cent of the respondents. In the
total price spread, share of marketing cost and profit margins of various
intermediaries was 75 per cent and 25 per cent in channel -I, while the respective
figures for channel-II were 80 per cent and 20 per cent. The producer’s share in
consumer’s rupees was relatively more in channel -II (86.6%) compared to
channel -I (83.7%). Thus, Channel-I was found to be relatively more efficient than
Channel -II.
Introduction
Maize (Zea mays) is one of the important
cereal crops of the world. Maize is a rich
source of carbohydrate, starch, fiber and
protein for humans and animal dietary
requirements. It also serves as a basic raw
material in the production of starch, oil and
protein, alcoholic beverages, food sweeteners
and fuel which is cheaper than other cereals. It
is also a versatile crop, grown across a range
of Agro Ecological Zones in India. The global
area and production of maize during 201617was 186 million ha and 1075.2 million MT,
respectively. Even though India being the fifth
largest producer of maize in the world but
380
Int.J.Curr.Microbiol.App.Sci (2019) 8(10): 380-387
contributes for only about four per cent of the
global production, since USA and China
together accounts for more than 75 per cent of
the global production. Although, maize is
grown throughout the year, about 90 per cent
of the India’s production comes from kharif
crop.
Price received for the farm produce by the
farmers depends upon and intern indicates the
efficiency of marketing channels. The
efficiency of marketing channels has an
important role in the farm income and nation’s
economy, as prices of farm products affects
the production decisions of the farmers and
their income. However, there exists wide
fluctuations in prices of farm commodities,
which is a big challenge that agriculture sector
is facing. This can be mainly attributable to
dependence of farm production on monsoon
including many unforeseen factors and
importantly the involvement of market
middlemen. The prices of farm products also
have the profound influence on the decisions
in industrial sector and consumers. The trend
in the farm commodity prices give signals for
making judgment on policy formulation and
executive action in the sphere of economic
activities.
In the short run, farmers make use of
information on output prices to determine the
pace and volume of his sales so as to optimize
the return from farm production, while in the
long run, knowledge of price trends help
farmer to formulate the investment plan on his
farm and to take decisions on the composition
and nature of enterprises to be taken up.
Knowledge of prices onfarm products and
costs help farmer to react logically to the
marketing situations to have proper marketing
plan for his products and purchase of his
required inputs. The production plans of any
farmers are governed by the price expectations
of proposed commodities and these
expectations are based on the trends in prices
of both output and agricultural inputs.
For the farmer, disposal of the farm produce at
remunerative prices has become as important
as an adoption of new technology for
improving yields in agriculture. The pattern of
movement of the produce from farm to the
ultimate consumer plays a crucial role in
determining the returns to the farmers. Unless
the marketing system improves, any policies
directed towards bringing improvements in
production will not benefit the farmer in
reaching the desired results. Better returns,
stable price and attractive terms of trade will
induce the farmers to produce more and
market. In this context, appropriate market
system, its growth and efficiency is crucial.
Organized
marketing
of
agricultural
commodities has been promoted in the country
through a network of regulated markets. These
regulated markets were established as per the
provisions of the Marketing of Agricultural
Produce
Acts’
of
respective
State
Governments. The basic objective of
networking of markets is for the development
of market structure to fetch remunerative
prices to the producer through fair play of
supply and demand forces including
narrowing of the price spread in marketing. It
also aims to regulate market practices, attain
transparency in transactions for better prices
of farmers. In the this background the present
study was undertaken with an overall
objectives of studying the growth performance
of maize in Karnataka and study the efficiency
of existing marketing channels for maize.
Materials and Methods
Nature and source of data
The study was based on both the secondary
and primary data. The secondary data on area,
production and productivity of maize were
381
Int.J.Curr.Microbiol.App.Sci (2019) 8(10): 380-387
collected from the Directorate of Economics
and Statistics, Government of Karnataka for
the period from 1990-91 to 2014-15. The
primary data related to maize marketing like
cost incurred, price realised and profit margins
for estimation of price spread were collected
from farmer, trader respondents operating in
three major markets in Karnataka viz.
Davanagere, Hassan and Haveri. The primary
data on details of marketing were collected by
personal interview method from 60 maize
growing farmers, 15 commission agents, 15
village merchant / traders in equal proportion
operating in three selected sample APMCs for
the study using the random sampling
technique using pre-tested well structured
schedules.
Analytical tools
The compound growth in area, production and
productivity of maize were estimated using
following form of an exponential form of the
function.
Y = abteu
Where,
Y
is
Dependent
variable
(area/production/productivity), a is Intercept, b
is Regression coefficient, t denotes Time
period in years and eu is the error term
In the logarithmic form the function is
expressed as,
log Y = log a + t log b + u
Log a and Log b were obtained using the
Ordinary Least Squares (OLS) procedures.
The Compound annual growth rate (g) was
then computed using
g = (b – 1)*100
Where, g is the compound annual growth rate
(%) and ‘r’ is the antilog of log b.
The significance of the CAGR was tested
using ‘t’ test. The primary data on marketing
were used to estimate the price spread in
various marketing channel using measures of
central tendency like simple averages and
percentages for meaningful interpretation.
Results and Discussion
Growth performance
Karnataka
of
Maize
in
Timely and upto date information on area,
production and yield level of crops is useful
for making any farm policy. The growth rates
in area, production and yield of Maize in
major districts and for the Karnataka state
were worked out for fifteen years period from
1990-91and results are presented Table 1.
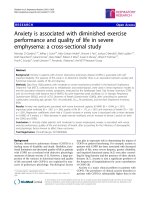
It could be observed from the table that the
maize production in the state during the study
period increased at 7.76 per cent per annum.
This significant growth rate in Maize
production of the state was due to area
expansion. State exhibited significant growth
rate of 8.02 per cent per annum in area under
Maize. However, state has registered a
marginal decrease in the Maize productivity (0.25%).
The district-wise contribution and analysis of
growth performance of Maize in Karnataka
revealed that Davanagere, Haveri, Belagavi,
Chitradurga, and Bellary together accounted
for about 50 per cent of area and production of
Maize in Karnataka. The production of Maize
registered significant growth rate in most of
the major maize cultivating districts.
The highest growth rate in production was
observed in Chikamagaluru district (22.49%)
followed by Chikaballapur (16.37%) and
Hassan (16.24%) and growth rates were
highly significant at one per cent. The major
maize cultivating districts viz., Davanagere,
382
Int.J.Curr.Microbiol.App.Sci (2019) 8(10): 380-387
Haveri, Belagavi and Bellary registered higher
growth rates and growth rates were significant
at one per cent. While, Chitradurga and
Bijapur districts being other important districts
showed positive growth rates in area but due
to negative growth rates in productivity, the
production growth rates were turned out to be
non-significant.
The district-wise growth rates in Maize area
revealed that again Chikkamagaluru registered
the highest growth rate (22.85%) followed by
Hassan (15.82%) Chikkaballapur (13.72%)
Koppal (13.49%) and Tumakuru (11.26%) and
growth rates of Maize area in these districts
found to the significant at one per cent
probability level.
The growth rate of Maize productivity in all
the major districts positive but not significant,
while it was negative and significant in
Chitradurga (-2.71%) and Bellary (-1.79%)
districts.
This may be attributable growing of Maize on
marginal lands and most uncertain rainfall
patterns. The productivity of maize was higher
than the state average productivity in
Belagavi, Bijapur and Bagalkot districts.
In rest of the major maize growing districts the
productivity was lower than the state average.
Thus growth in the Maize production in the
state was area lead growth and productivity
found to be remained stagnant. This could be
attributable to non-adoption of all the
recommended package of practices by the
farmers and most of the varieties or hybrids
reached their maximum yield plateau. Thus it
calls for more concerted efforts towards
research in breeding and release of HYV’s and
hybrids by both the SAU’s and Companies
coupled with strong extension service to
educate farmers to boost maize productivity
and meet increasing demand for maize.
Marketing of maize
Marketing channels denote the routes through
which the producer-sellers dispose-off their
produce. The price spread is one of the
important measures of marketing efficiency
which indicates the producer’s share in
consumer rupee. It includes marketing cost
incurred at various levels in the movement of
maize produce from the (farmer) producer to
consumer as well as marketing margin that the
intermediaries receive for their services in
moving the maize through various stages in
the marketing channels. The difference
between the price paid by the consumer and
the price received by the producer for an
equivalent product constituted the marketing
cost and the margin.
In the study area, farmers found selling their
produce through four marketing channels.
Among the four channels, due to insufficiency
of the minimum required sample only
Channel-I and Channel-II were considered for
estimating the marketing efficiency. They
include
Channel I:
Producer → Village
trader → wholesaler cum commission agent
→ Retailer → Consumer
Channel II:
Producer → wholesaler
cum commission agent → Retailer →
Consumer
The Channel-I was practiced by 66.66 per cent
of the respondents and Channel-II adopted by
33.33 per cent of the respondents. The other
two channels noticed in the study area include
Channel-III (Direct selling to consumers) and
Channel-IV (Direct selling to Feed
Manufacturing Units) which were not
practiced widely. It was also observed during
the survey that some of the farmers adopted
more than one marketing channel for maize
sale.
383
Int.J.Curr.Microbiol.App.Sci (2019) 8(10): 380-387
Sl.No.
Particulars
1.
2.
3.
4.
5.
6.
7.
8.
9.
10.
11.
12.
13.
14.
15.
16.
17.
18.
Davanagere@
Haveri@
Belagavi
Chitradurga
Bellary
Bijapur
Bagalkot
Hassan
Shivamogga
Chikballapur
Koppal@
Gadag@
Dharwad
Mysuru
Chamrajnagar@
Tumkur
Chikkamagaluru
Others
State overall
Table.1 Growth performance of Maize in Karnataka during 1990-2014
(Area in Ha, Production in tones and Productivity in Kgs/ha)
Area
Production
Productivity
TE 2014
% to
CAGR (%) TE 2014
% to
CAGR
TE
Change
CAGR
the
the
(%)
2014
over
(%)
State
State
state
Average
181957
13.43
3.66***
527886
13.83
5.30*** 3052
3.11
1.59NS
156449
11.55
6.10***
411678
10.79
5.70*** 2837
-4.17
-0.38NS
146335
10.80
3.69***
497545
13.04
4.41*** 3555
20.09
0.60NS
102681
7.58
4.13***
195617
5.13
1.31NS
2006
-32.25
-2.71***
99131
7.32
6.20***
198750
5.21
4.30*** 2124
-28.25
-1.79***
NS
NS
78640
5.81
1.69
285862
7.49
1.52
3827
29.29
-0.17 NS
75301
5.56
5.65***
252074
6.60
6.52*** 3507
18.48
0.82 NS
68454
5.05
15.82***
198516
5.20
16.24*** 3063
3.48
0.36 NS
65994
4.87
9.38***
250341
6.56
10.30*** 3990
34.79
0.84 NS
62533
4.62
13.72***
167941
4.40
16.37*** 2826
-4.54
2.33 NS
58958
4.35
13.49***
2212
0.06
11.82*** 2954
-0.20
-1.33 NS
54570
4.03
10.19***
115281
3.02
8.24**
2182
-26.29
-1.77 NS
39662
2.93
-0.22 NS
90451
2.37
-1.27 NS 2388
-19.34
-0.86 NS
38211
2.82
3.69***
102486
2.69
3.59*** 2823
-4.64
-0.10 NS
37303
2.75
9.19***
115715
3.03
10.37*** 3271
10.51
1.08 NS
25537
1.89
11.26***
57852
1.52
10.20*** 2385
-19.45
-0.95 NS
23509
1.74
22.85***
57982
1.52
22.49*** 2564
-13.40
-0.25 NS
39197
2.89
2.24***
288420
7.56
2.88*** 3191
7.79
2.94***
1354424
100.00
8.02*** 3816610.7 100.00
7.76*** 2960
100.00
-0.25 NS
Note
: ***,** and NS indicates significance at one per cent, five per cent and non-significant, respectively.
CAGR for Davanagere, Haveri, Koppal, Gadag and Chamarajanagr districts were calculated for the period from 1998 to 2014, i.e., from the year of
reorganisation of districts
384
Int.J.Curr.Microbiol.App.Sci (2019) 8(10): 380-387
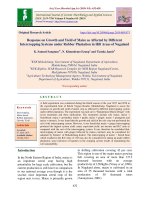
Table.2 Price spread in marketing of maize in channel-I
Sl. No.
1.
2.
3.
4.
a.
b.
c.
d.
e.
f.
5.
a.
b.
c.
d.
e.
f.
6.
a.
b.
c.
d.
e.
f.
7.
8.
9.
10.
Particulars
Farmers participated (no.)
Quantity sold (%)
Net price received by the farmer
Village trader
Packing, loading, unloading
Transportation
Miscellaneous expenses
Sub total
Profit margin
Village trader sale price
Commission agent cum wholesaler
Packing, loading, unloading
Transportation
Miscellaneous expenses
Sub total
Wholesaler’s margin
Wholesaler’s sale price
Retailer
Packing, loading, unloading
Transportation
Shop rent
Sub total
Retailer’s margin
Consumer’s purchase / Retailer’s sale price
Total marketing cost
Profit margin of intermediaries
Price spread
Producer’s share in consumer’s rupees (%)
Value
40
(Rs./qtl.)
%
66.66
62.5
1100
23
25
15
63
15
1178
10.82
11.76
7.06
29.65
7.06
20
15
20
55
20
1253
9.41
7.06
9.41
25.88
9.41
20
9.41
19.5
39.5
20
1313
157.5
55
212.5
83.78
9.18
18.59
9.41
74.12
25.88
100
Channel I: Producer→Villagetrader→wholesaler cum commission agent→Retaile→Consumer
385
Int.J.Curr.Microbiol.App.Sci (2019) 8(10): 380-387
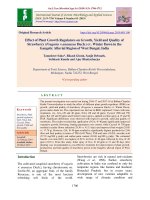
Table.3 Price spread in marketing of maize in channel-II
Sl. No.
1.
2.
3.
a.
b.
c.
d.
e.
f.
4.
a.
b.
c.
d.
e.
f.
5.
a.
b.
c.
d.
e.
f.
6.
7.
8.
9.
Particulars
Farmers participated (no.)
Quantity sold (%)
Expenses incurred by the farmer
Packing, loading, unloading
Transportation
Personal expenses
Sub total
Producer’s sale price
Net price received by the farmer
Commission agent cum wholesaler
Packing, loading, unloading
Transportation
Miscellaneous expenses
Sub total
Wholesaler’s margin
Wholesaler’s sale price
Retailer
Packing, loading, unloading
Transportation
Shop rent
Sub total
Retailer’s margin
Consumer’s purchase / Retailer’s sale price
Total marketing cost
Profit margin of intermediaries
Price spread
Producer’s share in consumer’s rupees (%)
Value
20
(Rs./qtl.)
%
33.33
23.40
23
10
15
48
1200
1152
13.02
5.66
8.49
27.16
20
15
20
55
15
1270
11.32
8.49
11.32
31.13
8.49
20
11.32
19.2
39.2
19.5
1330
142.2
34.5
176.7
86.62
10.87
22.18
11.04
80.48
19.52
100
Channel II: Producer → wholesaler cum commission agent → Retailer → Consumer
As regards the quantity of maize marketed, more
than 85 per cent (Channel-I: 62.5% and
Channel-II: 23.4%) of the produce was sold
through these two channels and hence details on
per quintal basis marketing cost incurred, profit
margin realised, total marketing margin (Price
spread) and Producer’s Share in Consumer
Rupee (PSCR) were worked out and are
presented in Table 2.
The total marketing costs and profit margins of
all the intermediaries constitute the total
marketing margin. The marketing margin was
found to be higher in the case of Channel-I than
in Channel-II. In other words the total price
spread was more in the case of Channel-I
(Rs.212.5/q) than in Channel-II (Rs.176.7/q).
The lower price spread in the case of Channel-II
was due to absence of one market intermediary
i.e., Village trader. Hence farmers realised
relatively higher share in consumer rupee when
they marketed their produce through Channel-II
(86.62%) than Channel-I (83.78%).
Thus compared to many other farm
commodities, the share of farmers in the final
386
Int.J.Curr.Microbiol.App.Sci (2019) 8(10): 380-387
consumer’s rupees was more, as this is handled
in large quantity and used in industries like
manufacturing of animal feed, etc. However,
still in order to increase producer share in final
price, contract farming with processing
industries would be a viable option as it can
minimise the intermediaries in maize marketing,
and may have strong influence on price
stabilisation. Similarly, organising maize
producers organisations would increase their
bargaining power not only in maize marketing
but also help realise benefit in procuring their
needed inputs. Further, need based construction
and popularising usage of rural godowns in
major growing areas for storage of produce
would also help farmers in reaping greater
benefits from maize cultivation. In addition,
there exists more scope for primary processing
of maize at village level so that farmers
dependency on cattle feed from market would
decreases cattle feed cost.
In the case of channel-I, the share of marketing
cost and profit margins of various intermediaries
was 75 per cent 25 per cent, while the respective
figures for channel-II were 80 per cent and 20
per cent. The Producer’s share in consumer’s
rupees in channel –II was relatively more
(86.6%) compared to channel –I (83.7%), hence,
Channel-I found to be relatively more efficient
than Channel-II.
Maize production in the state during the study
period from 1990-2014 increased at rate of 7.76
per cent per annum, due to significant growth
rate of 8.02 per cent per annum in area under
Maize, but the maize productivity (-0.25%)
showed decreasing growth rate. Of the four
marketing channels observed in the study area,
more than 85 per cent (Channel-I: 62.5% and
Channel-II: 23.4%) of the produce was sold
though channel –I and channel-II. Due to
absence of village trader in channel II (Through
APMC), Producer’s share in consumer’s rupees
was more (86.6%) compared channel –I
(83.7%).
References
Arti Thakur, Chandan Kumar Rai., 2017,
Growth rate of Area, Production and
productivity of sugarcane crop in Uttar
Pradesh. Research J. Agric. Sci., 8(2):
423-425.
Bhat Anil, Jyoti Kachroo and Dileep Kachroo.,
2011, Economic Appraisal of Kinnow
Production and its Marketing under NorthWestern Himalayan Region of Jammu
Agricultural Economics Research Review,
24: 283-290.
Manjeet Kaur, Sekhon, M. K. and Anuradha
Joshi, 2014, Marketing pattern and price
spread of guava in Punjab. Ind. J Econ
Dev., 10 (1): 77-85.
Naveen, B., Jayaram, M.S., Dhananjaya Swamy,
P.S., Ramesh, G.B. and Raghavendra,
D.V., 2015, Marketing channels and price
spread of banana in Chikkaballapur district
of Karnataka. International Research
Journal of Agricultural Economics and
Statistics., 6(1): 18-22.
Sharma A.,2013, Trends of Area, Production
and Productivity of Food grain in the
North Eastern States of India. Indian J.
Agric. 2013; 47(4):341-346.
Venkataramana Reddy, V., Venkataramana,
M.N., Dhananjaya Swamy, P.S. AND
Harish Kumar, H.V., 2015, Economic
analysis of marketing channels and
efficiency of marketing of finger millet
(Ragi) in Karnataka. International
Research
Journal
of
Agricultural
Economics and Statistics.6 (1): 27-31.
How to cite this article:
Murulidhar M. Venkannanvara, G. M. Gaddi and Gracy, C. P. 2019. Growth Performance and
Marketing of Maize in Karnataka, India. Int.J.Curr.Microbiol.App.Sci. 8(10): 380-387.
doi: />
387