Development of model for extrusion cooking based on textural properties of extrudate prepared from rice broken and pigeon pea dal broken flour blends
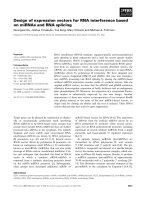
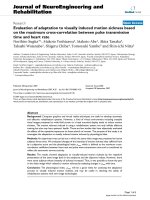
Bạn đang xem bản rút gọn của tài liệu. Xem và tải ngay bản đầy đủ của tài liệu tại đây (698.31 KB, 16 trang )
Int.J.Curr.Microbiol.App.Sci (2019) 8(10): 2164-2179
International Journal of Current Microbiology and Applied Sciences
ISSN: 2319-7706 Volume 8 Number 10 (2019)
Journal homepage:
Original Research Article
/>
Development of Model for Extrusion Cooking Based on Textural
Properties of Extrudate Prepared from Rice Broken and
Pigeon Pea Dal Broken Flour Blends
Ajeet Sarathe1*, Ashwani Duggal2 and Mohan Singh3
1
Department of Agricultural Engineering, Faculty of Agri. Sci. & Tech., AKS University,
Satna (M.P.), 485001, India
2
Department of Food and Agriculture Engineering, MGCGV Chitrakoot (MP)
3
Department of Post Harvest Process & Food Engineering, College of Agricultural
Engineering, JNKVV Jabalpur (M.P.), 482004
*Corresponding author
ABSTRACT
Keywords
Extrusion cooking,
Textural properties,
Hardness, Cutting
strength, Response
surface
methodology,
model, By-product
utilization
Article Info
Accepted:
17 September 2019
Available Online:
10 October 2019
The traditional milling processing practices used in rice and pulses milling, yields
significant amounts in the form of brokens from rice and dal mill industries. That brokens
do not find appropriate market and are listed as losses of the milling industries, generally
disposed off cheaply, whereas they are equally rich in the nutrition as comparable to whole
grain. Present study has been conducted with the aim of fruitful utilization of by-product of
rice and dal mill industries i.e. brokens by using extrusion cooking technology to prepare
snacks by using a Brabender Single – Screw laboratory extruder. The effect of moisture
content, feed blend ratio, barrel temperature and screw speed of extruder on textural
characteristics of extrudates were studied by using Texture Analyzer. A central composite
rotatable design of Response surface methodology was used to develop prediction model.
Second order quadratic regression model was fitted in the variation. The significance was
established at p≤ 0.05. The hardness of extrudates varied from 4.63N and 22.30 N whereas
the cutting strength of extrudates varied from 4.07kg to 15.86 kg. It was observed that
moisture content and blend ratio of feed, and barrel temperature gave significant role of
textural characteristics of extrudates.
Introduction
Extrusion is one of the most dynamic,
versatile, and well-established industrial
processes used in the food and feed industry
today. It is being extensively used worldwide
to produce an ever-expanding list of food and
feed products including snacks, cereals,
pastas, TVPs (texturized vegetable proteins),
pet foods, animal feeds, instant beverages,
meat analogs, and a range of ethnic foods
(Shah, 2003). India has indeed a very good
potential demand for cereals and pulses based
ready–to–eat soy fortified extruded snacks.
Extrusion technologies are used for cereal and
protein processing in the food and closely
2164
Int.J.Curr.Microbiol.App.Sci (2019) 8(10): 2164-2179
related pet foods and feed sectors. Extrusion
has become an important processing technique
and its application today cover a wide range of
food products based on starch cereals protein
and sugar. Now-a-days extrusion cooking
technology is one of a most significance
manufacturing tool for food and feed
processing industries. The significance of it
should not be underestimated since the
technology is relatively new as well as during
the last some years it is one of the successful
unit operations for food processing industries
in India that is still developing rapidly. India
has indeed a very good potential demand for
cereals and pulses based ready–to–eat
extruded snacks. Extrusion cooking has
advantages, including versatility, high
productivity, low operating costs, energy
efficiency, and shorter cooking times (Harper
1981). Several legumes have been treated by
extrusion and good expansion has been
reported (Balandran et al 1998). In addition,
and as a result of high temperatures, high
pressures, and several shear forces reached
inside the barrel, chemical reactions and
molecular modifications like gelatinization of
starch, denaturation of proteins, inactivation of
many food enzymes, and reduction of
microbial counts can occur (Harper, 1981).
Inside the extruder the cereal mixture is heated
above the starch gelatinization temperature
leading to a cooked product that may be
directly enrobed and flavoured, or may need
further processing such as frying or roasting.
In the blend of flours made from starch and
protein rich grains, the selection of machine
and process parameters for extrusion becomes
more important as the starch gets gelatinized
and protein gets denatured at different process
parameters. Hence a consorted effort is
required to get optimum physical properties of
the extrudate making to be more acceptable to
the consumer. Product quality can vary
considerably depending on the extruder type,
screw configuration, feed moisture, and
temperature profile in the barrel session, screw
speed and feed rate (Ding et al., 2005). In fact,
the chemical and physical characteristics of
products strongly depend upon process
variables such as extrusion temperature, screw
speed and moisture content (De Cindio et al.,
2002). In cereal-based products, the degree or
proper processing of starch is important for
major quality aspects such as taste,
digestibility, texture, appearance and puffing.
Extrusion operational parameters such as
barrel temperature, and screw speed affect the
snack quality. In addition to these, processing
parameters like feed moisture content,
blending ratio also play important role on the
quality of extrudate. Therefore, the effects of
various operational and processing parameters
and their interaction on quality of extrudate
have to be studied and established. Present
study has been conducted to investigate and
standardized various operational and process
parameters and their interaction on textural
quality of extrudated snacks prepared from byproducts of rice and dal milling industries i.e.
brokens. Simultaneously, models have been
developed, which could be used to optimize
parameters for best textural quality of readyto-eat snack food product.
Materials and Methods
The raw material for the study i.e. rice and dal
broken were procured from Department of
Agricultural Engineering, AKS University,
Satna (M.P.). After initial removal of foreign
materials, flour was prepared by grinding in
the hammer mill. The moisture content of
flour at different blend ratio was then
measured by standard oven drying method.
After getting the moisture content of rice
broken flour and dal broken flour blends,
additional water required to raise the moisture
content to desired levels of blends i.e. 9, 12,
15, 18 and 21% (wb) was calculated. Then
calculated amount of water plus an additional
10% of calculated water was added to
supplement the evaporation losses during
2165
Int.J.Curr.Microbiol.App.Sci (2019) 8(10): 2164-2179
mixing and conditioning. Tempering of
samples was done by keeping the moistened
samples for 24 h at room temperature (250C)
so as to get uniform distribution of moisture
throughout the mass of blends. The
conditioned sample was then feed to the
laboratory-scale single-screw extruder (model
Kompakt E-19/25 D Brabender Duisburg,
Germaney ) at pre set operational conditions
(length-to-dia 20:1; compression ratio 2:1 and
die opening 5 mm) for extrusion cooking. The
product after coming out of the extruder
discharge end through round die, expanded
due to sudden release of pressure. The
extrudates were collected and packed in
laminated polythene bags and properly
labelled for the analysis purpose.
Experiment design and analysis
Design experiments were conducted following
Response Surface Methodology (RSM)
(Myres, 1976). This is a combination of
mathematical and statistical techniques that
are useful for the modeling and analysis of
problems, in which response of interest is
influenced by several variables and objective
is to optimize the response. In the present
study, Central Composite Rotatable Design
(CCRD) of five independent variables with
five level of each was used. In this study the
effect of processing parameters i.e. bland ratio
of rice broken flour and dal broken flour
(90:10, 80:20, 70:30, 60:40 and 50:50),
moisture content (w.b.) of feed (9, 12, 15, 18
and 21%), die head temperature (180, 190,
200, 210 and 220 0C), barrel temperature (120,
125, 130, 135 and 140 0C) and screw speed
(120, 125, 130, 135 and 140 rpm) was
optimized against the following textural
quality responses i.e. hardness, crispness and
cutting strength of extrudates. Prediction
models were developed for each of the
responses, followed by the model analysis
which included checking the validity of the
model with the help of various prescribed
statistical aids. Optimum values were obtained
for all the processing variables by keeping the
response either in range at minimum or at
maximum.
Data analysis was done for optimization of
operational and processing parameters of
extruder on textural properties of extrudates
prepared out of rice broken flour and dal
broken flour blends using software, Design
expert 11.1.2.0 (32bit). Based on the executed
statistics, such as p-values, lack of fit and R2,
PRESS values for comparing the models,
software executed statistics and suggested
linear and Quadratic model significant at
p<0.0001 with R2 = 0.999 and R2=0.975,
lowest PRESS and insignificant lack of fit was
selected. Coefficients of the model were
estimated for each response. Best-fit
regression equations were also developed.
Response surface graphs were drawn with the
help of Design expert 11.1.2.0 to know the
effect of independent variables on the
responses. The observed data was analyzed,
employing multiple regression technique. The
best fitting model was chosen, based on lack
of fit criteria (Cochran and Cox 1957).
Determination of textural properties
A Texture Analyzer TA – XT2i available at
Department of Post Harvest Process and Food
Engineering, CAE, Jabalpur is a highly
scientific device was used to study the
crispness, hardness and cutting strength of
extrudates.
Results and Discussion
The data obtained from the experiments for
different combinations (Table 2) were
analyzed by using multiple regression and
second order polynomial model and fitted to
the experimental data with coded values of
independent variables and inter- treated with
the help of models and graphs.
2166
Int.J.Curr.Microbiol.App.Sci (2019) 8(10): 2164-2179
From the tabulated values, three-dimensional
graphs
were
prepared
treating
two
independent variables to be constant and
showing the effect of other two variables on
textural properties i.e. crispness, hardness and
cutting strength of extrudates. Adequacy of
the model was tested using Fisher’s F-test.
The significance was established at p≤ 0.05.
The effects of variables have been interpreted.
The findings have been explained suitably
with logical reasons wherever possible. The
findings also have been discussed in the light
of theories and with the literature support to
the possible extent. The process parameters
considered were moisture content and blend
ratio of feed where as the operational
parameters were barrel temperature, die head
temperature
and
screw
speed.
The
experimental details are given in Table-2.
Effect of process and operational
parameters on crispness of extrudate
Crispiness is the most important texture
attribute which attracts the consumer’s
preference. Crispiness is measured as fractures
by texture analyzer and values ranged from
11– 22 fractures. The R2 had a value of 0.7941
for the model. The results of analysis of
variance (ANOVA) for model are presented in
Table-3 and regression coefficient and
standard error of second order mathematical
model are reported in Table-6 the significance
of each terms are also reported. The positive
coefficient at linear level indicated that there
was increase in response with increase in level
of selected parameters and vice versa.
Negative quadratic terms indicate that the
maximum value of the response was obtained
at the centre point while positive quadratic
term gave the minimum response.
Using CCRD and fitting of second degree
polynomial equation for representative
response surface of data resulted in the
development of following model;
Crispness = - 571.464 - 0.941692 x FMC 0.708455 x BR + 1.20834 x DHT + 4.3367 x
BT + 3.01754 x SS + 0.00841667 x FMC x
BR + 0.004625 x FMC x DHT - 0.0143333 x
FMC x BT + 0.0101667 x FMC x SS +
0.003025 x BR x DHT + 0.005425 x BR x BT
- 0.002225 x BR x SS - 0.0053 x DHT x BT +
0.00105 x DHT x SS + 0.00585 x BT x SS +
0.00823232 x FMC2 - 0.00875909 x BR2 0.00200909 x DHT2 - 0.0150364 x BT2 0.0155864 x SS2
………(1)
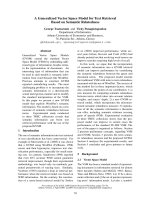
It is observed that crispness increases with
decrease in moisture content of feed as an
indicative of creation of more porous structure
of extrudates leading to increased crispness. It
has also observed that, the crispness of
extrudates increases, with decrease in percent
of dal broken flour, it contain higher amount
of protein and fiber than rice broken flour. It is
evident that with increase in barrel
temperature crispness of extrudates increases,
however, die head temperature had less effect
on the crispness of the extrudates. The
crispness of the extrudates varied between
11.31 to 16.66. Effects of process and
operational parameters on extrudate were
shown in Figures 1-10. Maximum value of
crispness of extrudates was observed at 21 %
moisture content of feed, 70:30 of blend ratio,
130 0C barrel temperature, 200 0C die head
temperature and 130 rpm screw speed.
Effect of process and operational
parameters on hardness of extrudate
Texture is the ultimate criteria on which
acceptability of any snack depends and
hardness is one important attribute to express
texture. Hardness was measured by
compression force using the texture analyzer.
The multiple regression analysis for hardness
of extrudates versus feed moisture content
(FMC), blend ratio (RB), barrel temperature
(BT), die head temperature (DHT) and screw
speed (SS) was done using CCRD and fitting
of second degree polynomial equation for
2167
Int.J.Curr.Microbiol.App.Sci (2019) 8(10): 2164-2179
representative response surface of data
resulted in the development of following
model;
Hardness = 165.149 + 10.6963 x FMC +
8.62283 *x BR + 1.93636 x DHT - 3.42295 x
BT - 4.99395 x SS - 0.0279583 x FMC x BR
+ 0.0167917 x FMC x DHT - 0.14325 x FMC
x BT + 0.0455 x FMC x SS - 0.0256875 x
BR x DHT - 0.018125 x BR x BT - 0.00715 x
BR x SS - 0.010975 x DHT x BT -0.00375 x
DHT x SS - 0.0048 x BT x SS - 0.0158712 x
FMC2 + 0.00430909 x BR2 + 0.00114659 x
DHT2 + 0.0327864x BT2 + 0.0237864 x
SS2...…….(2)
The R2 had a value of 0.7280 for the model.
The results of analysis of variance (ANOVA)
for model 2 are presented in Table-4.
The F-value 1.47 implies that the model is
non-significant. Regression coefficients of
second order mathematical model are reported
in Table-7, the significance of each terms is
also reported.
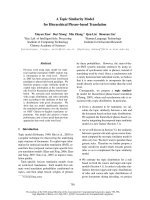
Hardness of extrudate is the resistance offered
to breaking when subjected to compressive
loading. The hardness of the extrudates varied
between 4.63 and 22.30 N. As clearly seen
from Fig. 11 the hardness of extrudates
reduces with decrease in blend ratio of dal
broken flour and has almost no effect with
change in barrel temperature and die head
temperature and slight increase with increase
in screw speed. Hardness of extrudate
increases with increase in blend ratio of dal
broken flour this may be because the dough of
dal broken flour constitutes a hard mass once
it is dried after melting which is mainly due to
the characteristics of protein present in dal
broken flour.
As it is seen from Fig. 13 that hardness
reduces with increase in die head temperature,
which may be mainly due to the changing of
protein and fibre content of dal broken flour
at higher temperature. Increase in screw speed
creates a better homogenous mass by better
shearing of melt inside the barrel which
creates a uniform porous structure of
extrudate imparting a soft upper coat to the
extrudate. Increase in temperature decreased
the hardness which is in agreement with the
result of rice and green gram extrudates
(Bhattacharya, 1997). Higher temperature
leads to expansion of extrudates as the
superheated steam is released and disrupts the
material due to shear which results in lighter
extrudates with less hardness. As moisture
content increased hardness increased which is
in agreement with the results of Ding et.al.,
(2006) where wheat based expanded snacks
were studied.
Effect of
parameters
extrudate
process and operational
on cutting strength of
The multiple regression analysis for cutting
strength of extrudates versus feed moisture
content (FMC), blend ratio (RB), barrel
temperature (BT), die head temperature
(DHT) and screw speed (SS) was done using
CCRD and fitting of second degree
polynomial equation for representative
response surface resulted in the development
of following model;
Cutting strength = - 204.902 - 14.732 x
FMC - 0.212967 x BR + 1.39705 x DHT +
1.13957 x BT + 1.58117 x SS + 0.0243958 x
FMC x BR + 0.0135625 x FMC x DHT +
0.0654583 x FMC x BT + 0.00729167 x FMC
x SS + 0.00215625 x BR x DHT -0.0168875
x BR x BT + 0.0127125 x BR x SS +
0.0023625 x DHT x BT - 0.0097875 x DHT x
SS + 0.042425 x BT x SS + 0.0719268 x
FMC2 + 0.00218591 x BR2 - 0.00171409 x
DHT2 -0.0288564 x BT2 - 0.0217464 x SS2
...…(3)
The R2 had a value of 0.7814 for the model.
The results of analysis of variance (ANOVA)
2168
Int.J.Curr.Microbiol.App.Sci (2019) 8(10): 2164-2179
for model 3 are presented in Table-5 and
regression coefficients of second order
mathematical model are reported in Table-8.
Table.1 Level of coded variables
Independent variable
Moisture Content (% w.b.)
Blend ratio
Barrel Temperature (oC)
Die Head Temperature (oC)
Screw Speed (rpm)
-2
9
90:10
120
180
120
Code levels
0
15
70:30
130
200
130
-1
12
80:20
125
190
125
1
18
60:40
135
210
135
2
21
50:50
140
220
140
Table.2 Experimental design matrix for parameter levels
Run
1
2
3
4
5
6
7
8
9
10
11
12
13
14
15
16
17
18
19
20
21
22
23
24
25
26
27
28
29
30
31
32
F-1
A
1
1
-1
1
-2
0
-1
2
0
0
-1
1
0
0
0
0
1
0
1
-1
0
0
-1
0
1
0
-1
0
-1
1
0
-1
F-2
B
-1
-1
1
-1
0
0
1
0
0
0
-1
1
0
0
0
0
1
0
-1
-1
0
0
-1
0
1
-2
-1
2
1
1
0
1
Coded Values
F- 3
F- 4
C
D
-1
-1
-1
1
1
1
1
1
0
0
-2
0
-1
1
0
0
0
0
2
0
1
1
-1
-1
0
0
0
-2
0
0
0
0
1
-1
0
0
1
-1
1
-1
0
0
0
0
-1
1
0
0
1
1
0
0
-1
-1
0
0
1
-1
-1
1
0
2
-1
-1
F-5
E
-1
1
-1
-1
0
0
1
0
0
0
1
1
2
0
0
0
-1
-2
1
-1
0
0
-1
0
1
0
1
0
1
-1
0
-1
F-1
A
40
40
20
40
10
30
20
50
30
30
20
40
30
30
30
30
40
30
40
20
30
30
20
30
40
30
20
30
20
40
30
20
F-2
B
12
12
18
12
15
15
18
15
15
15
12
18
15
15
15
15
18
15
12
12
15
15
12
15
18
9
12
21
18
18
15
18
Actual Values
F- 3
F- 4
C
D
125
190
125
210
135
210
135
210
130
200
120
200
125
210
130
200
130
200
140
200
135
210
125
190
130
200
130
180
130
200
130
200
135
190
130
200
135
190
135
190
130
200
130
200
125
210
130
200
135
210
130
200
125
190
130
200
135
190
125
210
130
220
125
190
A:Blend Ratio (%), B:Feed Moisture Content (%), C:Barrel Temperature (°C), D:Die Head Temperature (°C), E:Screw Speed (RPM)
2169
F-5
E
125
135
125
125
130
130
135
130
130
130
135
135
140
130
130
130
125
120
135
125
130
130
125
130
135
130
135
130
135
125
130
125
Int.J.Curr.Microbiol.App.Sci (2019) 8(10): 2164-2179
Table.3 ANNOVA table for quadratic model of response surface for Crispiness
Source
Model
A-FMC
B-BR
C-DHT
D-BT
E-SS
AB
AC
AD
AE
BC
BD
BE
CD
CE
DE
A²
B²
C²
D²
E²
Residual
Lack of Fit
Pure Error
Cor Total
Sum of Squares
142.20
3.76
2.61
8.76
23.05
0.0337
5.64
0.6084
0.0006
9.46
19.14
2.02
1.88
5.88
7.16
0.0009
8.72
39.12
0.0120
0.7027
0.8331
0.0000
0.0000
0.0000
142.20
df
20
1
1
1
1
1
1
1
1
1
1
1
1
1
1
1
1
1
1
1
1
11
6
5
31
Mean Square
7.11
3.76
2.61
8.76
23.05
0.0337
5.64
0.6084
0.0006
9.46
19.14
2.02
1.88
5.88
7.16
0.0009
8.72
39.12
0.0120
0.7027
0.8331
2.135E-06
3.914E-06
0.0000
F-value
3.330E+06
1.761E+06
1.224E+06
4.103E+06
1.080E+07
15808.06
2.642E+06
2.850E+05
292.74
4.429E+06
8.965E+06
9.445E+05
8.791E+05
2.754E+06
3.352E+06
421.55
4.084E+06
1.832E+07
5621.35
3.291E+05
3.902E+05
p-value
< 0.0001
< 0.0001
< 0.0001
< 0.0001
< 0.0001
< 0.0001
< 0.0001
< 0.0001
< 0.0001
< 0.0001
< 0.0001
< 0.0001
< 0.0001
< 0.0001
< 0.0001
< 0.0001
< 0.0001
< 0.0001
< 0.0001
< 0.0001
< 0.0001
Table.4 ANNOVA table for quadratic model of response surface for Hardness
Source
Model
A-FMC
B-BR
C-DHT
D-BT
E-SS
AB
AC
AD
AE
BC
BD
BE
CD
CE
DE
A²
B²
C²
D²
E²
Residual
Lack of Fit
Pure Error
Cor Total
Sum of Squares
412.96
0.2243
3.60
3.47
100.86
48.56
11.26
4.06
73.87
7.45
105.58
13.14
2.04
4.82
0.5625
0.2304
0.5985
5.45
0.3856
19.71
10.37
154.30
33.94
120.36
567.26
df
20
1
1
1
1
1
1
1
1
1
1
1
1
1
1
1
1
1
1
1
1
11
6
5
31
Mean Square
20.65
0.2243
3.60
3.47
100.86
48.56
11.26
4.06
73.87
7.45
105.58
13.14
2.04
4.82
0.5625
0.2304
0.5985
5.45
0.3856
19.71
10.37
14.03
5.66
24.07
2170
F-value
1.47
0.0160
0.2569
0.2471
7.19
3.46
0.8024
0.2895
5.27
0.5313
7.53
0.9368
0.1458
0.3435
0.0401
0.0164
0.0427
0.3883
0.0275
1.40
0.7395
p-value
0.2580
0.9017
0.6223
0.6289
0.0214
0.0897
0.3895
0.6013
0.0424
0.4813
0.0191
0.3539
0.7099
0.5697
0.8449
0.9003
0.8401
0.5459
0.8713
0.2609
0.4082
0.2350
0.9467
Int.J.Curr.Microbiol.App.Sci (2019) 8(10): 2164-2179
Table.5 ANNOVA table for quadratic model of response surface for Cutting Strength
Source
Model
A-FMC
B-BR
C-DHT
D-BT
E-SS
AB
AC
AD
AE
BC
BD
BE
CD
CE
DE
A²
B²
C²
D²
E²
Residual
Lack of Fit
Pure Error
Cor Total
Sum of
Squares
210.39
23.19
71.52
0.4902
5.99
0.3567
8.57
2.65
15.43
0.1914
0.7439
11.41
6.46
0.2233
3.83
18.00
12.29
1.40
0.8618
15.27
8.67
58.87
32.18
26.69
269.25
df
20
1
1
1
1
1
1
1
1
1
1
1
1
1
1
1
1
1
1
1
1
11
6
5
31
Mean
Square
10.52
23.19
71.52
0.4902
5.99
0.3567
8.57
2.65
15.43
0.1914
0.7439
11.41
6.46
0.2233
3.83
18.00
12.29
1.40
0.8618
15.27
8.67
5.35
5.36
5.34
F-value
p-value
1.97
4.33
13.36
0.0916
1.12
0.0667
1.60
0.4950
2.88
0.0358
0.1390
2.13
1.21
0.0417
0.7160
3.36
2.30
0.2619
0.1611
2.85
1.62
0.1248
0.0615
0.0038
0.7678
0.3127
0.8010
0.2318
0.4963
0.1176
0.8534
0.7163
0.1722
0.2952
0.8419
0.4155
0.0938
0.1578
0.6189
0.6959
0.1193
0.2293
1.00
0.5085
Table.6 Regression coefficient of second order mathematical model for Crispness of extrudates
Factor
Intercept
A-FMC
B-BR
C-DHT
D-BT
E-SS
AB
AC
AD
AE
BC
BD
BE
CD
CE
DE
A²
B²
C²
D²
E²
Coefficient
Estimate
15.49
-0.1767
-0.8675
0.1233
0.3775
0.1067
0.2525
0.1388
-0.2150
0.1525
0.3025
0.2713
-0.1113
-0.2650
0.0525
0.1462
0.0741
-0.8759
-0.2009
-0.3759
-0.3897
df
1
1
1
1
1
1
1
1
1
1
1
1
1
1
1
1
1
1
1
1
1
Standard
Error
0.4697
0.2404
0.2404
0.2404
0.2404
0.2404
0.2944
0.2944
0.2944
0.2944
0.2944
0.2944
0.2944
0.2944
0.2944
0.2944
0.2174
0.2174
0.2174
0.2174
0.2174
2171
95% CI Low
14.46
-0.7057
-1.40
-0.4057
-0.1515
-0.4223
-0.3954
-0.5092
-0.8629
-0.4954
-0.3454
-0.3767
-0.7592
-0.9129
-0.5954
-0.5017
-0.4044
-1.35
-0.6794
-0.8544
-0.8682
95% CI
High
16.52
0.3523
-0.3385
0.6523
0.9065
0.6357
0.9004
0.7867
0.4329
0.8004
0.9504
0.9192
0.5367
0.3829
0.7004
0.7942
0.5526
-0.3974
0.2776
0.1026
0.0889
VIF
1.0000
1.0000
1.0000
1.0000
1.0000
1.0000
1.0000
1.0000
1.0000
1.0000
1.0000
1.0000
1.0000
1.0000
1.0000
1.02
1.02
1.02
1.02
1.02
Int.J.Curr.Microbiol.App.Sci (2019) 8(10): 2164-2179
Table.7Regression coefficient of second order mathematical model for Hardness of extrudates
Factor
Intercept
A-FMC
B-BR
C-DHT
D-BT
E-SS
AB
AC
AD
AE
BC
BD
BE
CD
CE
DE
A²
B²
C²
D²
E²
Coefficient Estimate
10.12
0.0967
0.3875
-0.3800
-2.05
1.42
-0.8388
0.5037
-2.15
0.6825
-2.57
-0.9063
-0.3575
-0.5488
-0.1875
-0.1200
-0.1428
0.4309
0.1147
0.8197
0.5947
df
1
1
1
1
1
1
1
1
1
1
1
1
1
1
1
1
1
1
1
1
1
Standard Error
1.49
0.7645
0.7645
0.7645
0.7645
0.7645
0.9363
0.9363
0.9363
0.9363
0.9363
0.9363
0.9363
0.9363
0.9363
0.9363
0.6915
0.6915
0.6915
0.6915
0.6915
95% CI Low
6.83
-1.59
-1.30
-2.06
-3.73
-0.2602
-2.90
-1.56
-4.21
-1.38
-4.63
-2.97
-2.42
-2.61
-2.25
-2.18
-1.66
-1.09
-1.41
-0.7024
-0.9274
95% CI High
13.40
1.78
2.07
1.30
-0.3673
3.11
1.22
2.56
-0.0879
2.74
-0.5079
1.15
1.70
1.51
1.87
1.94
1.38
1.95
1.64
2.34
2.12
VIF
1.0000
1.0000
1.0000
1.0000
1.0000
1.0000
1.0000
1.0000
1.0000
1.0000
1.0000
1.0000
1.0000
1.0000
1.0000
1.02
1.02
1.02
1.02
1.02
Table.8 Regression coefficient of second order mathematical model for Cutting Strength of
extrudates
Factor
Intercept
A-FMC
B-BR
C-DHT
D-BT
E-SS
AB
AC
AD
AE
BC
BD
BE
CD
CE
DE
A²
B²
C²
D²
E²
Coefficient
Estimate
9.35
0.9829
1.73
0.1429
0.4996
-0.1219
0.7319
0.4069
0.9819
0.1094
0.2156
-0.8444
0.6356
0.1181
-0.4894
1.06
0.6473
0.2186
-0.1714
-0.7214
-0.5437
df
1
1
1
1
1
1
1
1
1
1
1
1
1
1
1
1
1
1
1
1
1
Standard
Error
0.9227
0.4722
0.4722
0.4722
0.4722
0.4722
0.5783
0.5783
0.5783
0.5783
0.5783
0.5783
0.5783
0.5783
0.5783
0.5783
0.4271
0.4271
0.4271
0.4271
0.4271
2172
95% CI
Low
7.32
-0.0564
0.6869
-0.8964
-0.5397
-1.16
-0.5410
-0.8660
-0.2910
-1.16
-1.06
-2.12
-0.6373
-1.15
-1.76
-0.2123
-0.2927
-0.7215
-1.11
-1.66
-1.48
95% CI
High
11.38
2.02
2.77
1.18
1.54
0.9174
2.00
1.68
2.25
1.38
1.49
0.4285
1.91
1.39
0.7835
2.33
1.59
1.16
0.7687
0.2187
0.3964
VIF
1.0000
1.0000
1.0000
1.0000
1.0000
1.0000
1.0000
1.0000
1.0000
1.0000
1.0000
1.0000
1.0000
1.0000
1.0000
1.02
1.02
1.02
1.02
1.02
Int.J.Curr.Microbiol.App.Sci (2019) 8(10): 2164-2179
Fig.1 Effect of feed moisture content and blend
ratio on crispness of extrudates
Fig.2 Effect of feed moisture content and
barrel temperature on crispness of extrudates
Fig.3 Effect of feed moisture content and die
head temperature on crispness of extrudates
Fig.4 Effect of feed moisture content and
screw speed on crispness of extrudates
2173
Int.J.Curr.Microbiol.App.Sci (2019) 8(10): 2164-2179
Fig.5 Effect of blend ratio and barrel
temperature on crispness of extrudates
Fig.6 Effect of blend ratio and die head
temperature on crispness of extrudates
Fig.7 Effect of blend ratio and screw speed
crispness of extrudates
Fig.8 Effect of barrel temperature and die
head temperature on crispness of extrudates
Fig.9 Effect of barrel temperature and screw
speed on crispness of extrudates
Fig.10 Effect of die head temperature and
screw speed on crispness of extrudates
2174
Int.J.Curr.Microbiol.App.Sci (2019) 8(10): 2164-2179
Fig.11 Effect of feed moisture content
and blend ratio on hardness of extrudates
Fig.12 Effect of feed moisture content and
barrel temperature on hardness of
extrudates
Fig.13 Effect of feed moisture content
and die head temperature on hardness of
extrudates
Fig.14 Effect of feed moisture content and
screw speed on hardness of extrudates
Fig.15 Effect of blend ratio and barrel
temperature on hardness of extrudates
Fig.16 Effect of blend ratio and die head
temperature on hardness of extrudates
2175
Int.J.Curr.Microbiol.App.Sci (2019) 8(10): 2164-2179
Fig.17 Effect of blend ratio and screw
speed on hardness of extrudates
Fig.18 Effect of barrel temperature and die
head temperature on hardness of
extrudates
Fig.19 Effect of barrel temperature and
screw speed on hardness of extrudates
Fig.20 Effect of die head temperature and
screw speed on hardness of extrudates
Fig.21 Effect of feed moisture content and
blend ratio cutting strength of extrudates
Fig.22 Effect of feed moisture content and
barrel temperature on cutting strength of
extrudates
2176
Int.J.Curr.Microbiol.App.Sci (2019) 8(10): 2164-2179
Fig.23 Effect of feed moisture content and
die head temperature on cutting strength of
extrudates
Fig.24 Effect of feed moisture content
and screw speed on cutting strength of
extrudates
Fig.25 Effect of blend ratio and barrel
temperature on cutting strength of
extrudates
Fig.26 Effect of blend ratio and die head
temperature on cutting strength of
extrudates
Fig.27 Effect of blend ratio and screw speed
on cutting strength of extrudates
Fig.28 Effect of barrel temperature and die
head temperature on cutting strength of
extrudates
Fig.29 Effect of barrel temperature and screw speed
on cutting strength of extrudates
Fig.30 Effect of die head temperature and screw
speed on cutting strength of extrudates
2177
Int.J.Curr.Microbiol.App.Sci (2019) 8(10): 2164-2179
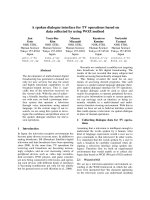
It is observed that when moisture content of
feed and blend ratio increased (increasing
protein content and decreasing starch), cutting
strength of extrudate also increased. It may be
because the feed materials became hard due to
increasing moisture content of feeding.
Further it was observed that barrel
temperature and screw speed increased
gradually, the cutting strength of extrudate
decreased. This may be because more
moisture was evaporated at high temperature
causing
formation
of
bubbles
and
consequently puffing. Therefore cutting
strength reduced.
Effects of process and operational parameters
on extrudate were shown in Figures 21-30.
Minimum value of cutting strength of
extrudate observed at 18% feed moisture
content, 80:20 of blend ratio, 135 rpm screw
speed, 130 0C barrel temperature and 210 0C
die head temperature
In conclusion, rice and pigeon pea are grown
in appreciable amount in most of the part of
India; the traditional milling process yields
significant amounts in the form of brokens
from rice and dal mill industries. That
brokens do not find appropriate market and
are listed as losses of the milling industries,
generally disposed off cheaply, only to be
used as animal feed or to acts as raw material
for manufacturing other complementary
products. The broken part of rice and pulses,
are equally rich in the nutrition as comparable
to whole grain. Moreover, high protein byproduct of industry offer scope for their use as
supplement but all these require heat
processing to make them suitable for human
consumption. Extrusion cooking is one of the
most important food processing technologies
which have been used for the production of
breakfast cereals, ready to eat snack foods and
other textured foods. Effects of extrusion
cooking on texture are ambiguous. As a
complex multivariate process, extrusion
cooking requires careful control if product
quality is to be maintained. In this study it has
to be mainly focused on the relationships
between process and operation parameters on
textural quality of extrudates which were
prepared by flour of rice and dal milling
industry’s by-products i.e. brokens. The
crispness of the extrudates varied between
11.31 and 16.66. The hardness of the
extrudates varied between 4.63 and 22.30 N
whereas the cutting strength of extrudate
varied from 4.07 to 15.86 kg. Minimum value
of hardness and cutting strength of extrudate
observed at 15% and 18 % moisture content
of feed respectively, 80:20 of feed blend ratio,
135 0C barrel temperature 190 0C die head
temperature and 135 rpm screw speed.
References
Adekola K A. (2014). Analytical engineering
designs for twin screw food extruder
dies.
International
Journal
of
Engineering Innovation and Research
3(5): 713-717.
Ahmed S M S, Zhang Q, Chen J and Shen Q.
(2013). Millets Grains: Nutritional
Quality, Processing and Potential
Health
Benefits.
Comprehensive
Reviews in Food Science and Food
Safety 12: 281-295.
Anderson, R.A., Conway, H.F., Pfeifer, V.F.,
Griffin, Jr. E.l. (1969). Gelatinization of
corn grits by roll and extrusion cooking.
Cereal Science Today, 14(4-7),11-12.
Badrie, N., Mellowes, W. A. (1991). Texture
and microstructure of cassava flour
extrudate. Journal of Food Science, 56,
1319–1322, 1364.
Balandran- quantana, R.R., Barbosa, J.J.,
Zazueta, J.J., Anzaldua, A., Quinterro,
A. (1998). Fuctional and nutritional
properties of extruded of whole pinto
bean meal (Phaseolus vulgaris l.).
Journal of Food Science, 63(1), 113116.
2178
Int.J.Curr.Microbiol.App.Sci (2019) 8(10): 2164-2179
Balasubramanian S, Singh K K, Patil RT and
Onkar K K. (2012). Quality evaluation
of millet-soy blended extrudates
formulated through linear programming.
J Food Sci Technol., 49(4): 450–458
Chen L and Opara U L. (2013). Texture
measurement approach in fresh and
processed foods – A review. Food
Research International 51(2): 823-835.
Cochran, W.G., Cox, G.M. (1957). A text
book of experimental designs. Publs.
John Wiley & Sons. Inc.:335-375
De Cindio B, Gabriele D, Pollini CM,
Peressini D, Sensidoni A (2002). Filled
snack production by extrusion-cooking:
Rheological modelling of the process. J
Food Eng 52: 67-74
Ding Q-B, Paul Ainsworth, Andrew Plunkett,
Gregory Tucker and Hayley Marson
(2006). The effect of extrusion
conditions on the functional and
physical properties of wheat-based
expanded snacks. J Food Eng 73(2):
142-148
Deshpande H W and Poshadri A. (2011).
Physical and sensory characteristics of
extruded snacks prepared from Foxtail
millet
based
composite
flours.
International Food Research Journal 18:
751-756.
Harper J M 1981. Extrusion of Foods, Baca
Raton, CRC: 212
IASRI (2016) Production and productivity in
agriculture during past 50 years. In:
Agriculture research Data Book 2016.
Indian Agriculture Statistical Research
Institute. URL: .
Liu Y, Hsieh F, Heymann H, Huff HE 2000.
Effect of process conditions on the
physical and sensory properties of
extruded oat–corn puff. Journal of Food
Science 65:1253–1259.
Myers R H, Montgomery D C and AndersonCook CM. (2008). Response surface
methodology Process and Product
Optimization
Using
Designed
Experiments 3rd Edition. Publ. John
Willey and Sons Inc. New Jersey. p 1.
Shah Abhay Arvind (2003). The effect of
extrusion conditions on aggregation of
peanut proteins, Published M.S. Thesis,
Submitted to the Graduate Faculty of
The University of Georgia, Athens,
Georgia.
Stanley D W. (1986). Chemical and structural
determinants of texture of fabricated
foods. Food Technology 40(3): 65-68,
76
Tosh S M and Yada S. (2010). Dietary fibres
in pulse seeds and fractions:
Characterization, functional attributes,
and applications. Food Research
International 43(2): 450-460.
How to cite this article:
Ajeet Sarathe, Ashwani Duggal and Mohan Singh. 2019. Development of Model for Extrusion
Cooking Based on Textural Properties of Extrudate Prepared from Rice Broken and Pigeon Pea
Dal Broken Flour Blends. Int.J.Curr.Microbiol.App.Sci. 8(10): 2164-2179.
doi: />
2179