Physical growth during the first year of life: A longitudinal study in rural and urban areas of Hanoi, Vietnam
Bạn đang xem bản rút gọn của tài liệu. Xem và tải ngay bản đầy đủ của tài liệu tại đây (587.02 KB, 9 trang )
Nguyen et al. BMC Pediatrics 2012, 12:26
/>
RESEARCH ARTICLE
Open Access
Physical growth during the first year of life.
A longitudinal study in rural and urban areas of
Hanoi, Vietnam
Huong Thu Nguyen1,2*†, Bo Eriksson2†, Liem Thanh Nguyen1†, Chuc Thi Kim Nguyen3†, Max Petzold2,4†,
Göran Bondjers4† and Henry Ascher2†
Abstract
Background: Good infant growth is important for future health. Assessing growth is common in pediatric care all
over the world, both at the population and individual level. There are few studies of birth weight and growth
studies comparing urban and rural communities in Vietnam. The first aim is to describe and compare the birth
weight distributions and physical growth (weight and length) of children during their first year in one rural and
one urban area of Hanoi Vietnam. The second aim is to study associations between the anthropometric outcomes
and indicators of the economic and educational situations.
Methods: Totally 1,466 children, born from 1st March, 2009 to June 2010, were followed monthly from birth to 12
months of age in two Health and Demographic Surveillance Sites; one rural and one urban. In all, 14,199
measurements each of weight and length were made. Birth weight was recorded separately. Information about
demographic conditions, education, occupation and economic conditions of persons and households was
obtained from household surveys. Fractional Polynomial models and standard statistical methods were used for
description and analysis.
Results: Urban infants have higher birth weight and gain weight faster than rural infants. The mean birth weight
for urban boys and girls were 3,298 grams and 3,203 grams as compared to 3,105 grams and 3,057 grams for rural
children. At 90 days, the urban boys were estimated to be 4.1% heavier than rural boys. This difference increased
to 7.2% at 360 days. The corresponding difference for girls was 3.4% and 10.5%. The differences for length were
comparatively smaller. Both birth weight and growth were statistically significantly and positively associated with
economic conditions and mother education.
Conclusion: Birth weight was lower and the growth, weight and length, considerably slower in the rural area, for
boys as well as for girls. The results support the hypothesis that the rather drastic differences in maternal education
and economic conditions lead to poor nutrition for mothers and children in turn causing inferior birth weight and
growth.
Background
Growth of children is influenced by maternal, environmental, genetic and hormonal factors. Nutrition is
assumed to be the one of the most important factors for
the growth of infants [1]. Some reasons for growth failure
in children could be problems in child well-being as well
* Correspondence:
† Contributed equally
1
Research Institute for Child Health, National Hospital of Pediatrics, 18/879 La
Thanh Road, Dong Da district, Hanoi, Vietnam
Full list of author information is available at the end of the article
as underlying chronic illnesses or inadequate nutrition
[2]. Slow intrauterine and infant growth can influence
the weight gain in childhood and later in life increase the
risk for diseases like coronary heart disease, type 2 diabetes and hypertension [3]. Assessing growth, both at
population and individual level, is common in pediatric
care all over the world. At a population level, growth
assessment of children means estimating prevalence of
undernourishment, overweight and identification of different groups in need of intervention [4]. Differences in
© 2012 Nguyen et al; licensee BioMed Central Ltd. This is an Open Access article distributed under the terms of the Creative Commons
Attribution License ( which permits unrestricted use, distribution, and reproduction in
any medium, provided the original work is properly cited.
Nguyen et al. BMC Pediatrics 2012, 12:26
/>
birth weight and growth of children between urban and
rural areas have been reported in some studies [5-8].
Inequality of family income, general living conditions,
average number of children in families and nutrition
have been pointed out as the main explanations for such
differences [6,7].
At the individual level, children are followed over time.
Growth of the single child is compared to a growth chart,
which is a diagram showing standard weight for age,
length or height for age, weight for height and other
anthropometric measures as functions of child age. The
graphic description most often includes mean with standard deviations as functions of child age, or in the case of
weight, of length or height. This follow-up is used to
evaluate deviations of the growth in individual children
which could be early signs of ill-health.
In Vietnam there has been a dramatic improvement in
economic conditions since the Doi Moi reforms starting
in 1986; income per capita has increased from $130 to
$900 from the early 1990s until 2008. Absolute poverty
has been reduced from 58 percent of the population in
1993 to 13 percent in 2008 [9]. The prevalence of underweight of children has decreased from 45% in 1990 to
26.6% in 2004. The rate of reduction of malnutrition has
been higher in urban areas than in rural areas [10]. The
percentage of low birth weight in Vietnam was estimated
to be higher in rural areas (5.9%) than in urban areas
(3.9%) in 2002 [11]. Over the last decades, a few longitudinal studies of rather small groups were conducted to
follow the growth of children born in delivery clinics or
maternal hospitals [12-14]. Generally, however, there is a
lack of knowledge about birth weight and growth of larger groups of children as well as comparisons between
urban and rural communities of Vietnam.
A hypothesis is that birth weight is lower and that
growth is slower in the rural area due to different nutritional conditions that could in turn be related to economic
resources and education. The first aim of this study is to
describe and compare the birth weight distributions and
physical growth (weight and length) of children from birth
to 12 months in one rural and one urban area of Hanoi,
Vietnam. A secondary aim is to study associations between
the anthropometric outcomes and variables indicating the
economic and educational situations.
Methods
Study sites
The study was conducted in two Health and Demographic
Surveillance Sites (HDSS), one urban and one rural, in
Hanoi, the capital of Vietnam. Dongda is an urban district
in central Hanoi with about 352,000 inhabitants. Three
communes, among 21, in the district, were strategically
selected to have different economic levels. In each commune a representative ward was selected. The populations
Page 2 of 9
of these, totally close to 40,000 persons in 11,500 households, were defined as the DodaLab HDSS in 2007 [15].
Bavi is a rural district, also within Hanoi with 250,000 persons. About 52,000 persons in 13,000 households situated
in 69 randomly selected clusters out of 352 called FilaBavi
HDSS, have been followed since 1999 [16].
Household surveys were undertaken in both sites during late 2007 and 2008 as well as during 2009 to obtain
information about demographic conditions, education,
occupation and economic conditions of persons and
households. In both sites, all households are routinely
visited every three months to record vital events, birth,
death, migration and pregnancies.
Study design and subjects in the follow-up of child
growth
The parents of all children reported to have been born
alive from 1st March, 2009 to 30th June, 2010, in DodaLab
and FilaBavi, were invited to enroll their child in the study.
Children with congenital and malformation diseases (two
in DodaLab and six in FilaBavi) were not invited. About
1%, totally 15 with 12 in DodaLab, of the mothers did not
give consent and the child was not enrolled. Altogether 12
children were born as twin and were not used in the present analysis. Low birth weight infants (below 2,500 g)
were included in the analysis, since their growth potential
was considered as normal [17]. The measurements made
on later out-migrated (61 from DodaLab and 27 from FilaBavi) or children who died (altogether five, four of them in
DodaLab) have been used in the analysis.
Totally 1,466 children were used to analyze growth during the first year of life. The 540 DodaLab children provided 4,964 measurements each of weight and length. In
FilaBavi 926 children contributed with 9,235 measurements. Totally 14,199 measurements were analyzed, that is
9.7 measurements per child.
Measurements and data collection
Birth weight information was provided by the mothers,
who reported the measurement made at the hospital or
commune health centers immediately after birth. For less
than 1% of the children birth weight information was not
obtained. The information about birth weight has been
analyzed separately from the subsequent measurements
of growth.
Given the mother’s consent, children were registered
for the study and scheduled for measurement of weight
and length every month from one month after birth to
the age of 12 months. The percentages of scheduled
measurements actually done were 65% for DodaLab and
77% for FilaBavi. The frequency of missed measurements increased with the age of the infant. The percentage of children actually followed to at least 11 months
was 80% in DodaLab and 90% in FilaBavi.
Nguyen et al. BMC Pediatrics 2012, 12:26
/>
Standardized equipment for measuring the child recommended from Hanoi Medical University was used. A number of commune health centre staff members in DodaLab
were trained specifically to measure children. In FilaBavi, a
number of the permanent interviewers were trained to
measure children. The principle of measurement was that
the same field worker should assess a child at each visit
using the same equipment. Weight was measured to the
nearest 10 gram with the child in light clothes using a portable infant scale. Length was measured to the nearest
centimeter in horizontal position using a length board.
Two person worked together in order to have valid and
reliable measurements [12].
The difference between the date of birth and the date for
the last menstruation reported by the mother can be
assumed to be correlated to the gestational age at birth. In
spite of the likely underestimation of the true pregnancy
time the difference is used as a proxy for the gestational
age and will subsequently be referred to as the Gestational
age proxy (Gap).
Data describing economy and education were taken
from the household surveys conducted 2009 in the two
sites. At household level we considered the reported yearly
household income and the household assets available
(according to a specified list) as indicators of economic
resources. The number of household members was also
studied.
For the mothers we studied age and education (primary,
secondary and higher). In the urban area the dominant
occupational category was office and service employment.
Farming was the most frequent occupation in the rural
area. However, occupation is strongly correlated to education and has not been used in the analysis.
Statistical analysis
Assessments of associations between the dependent variable birth weight and the independent area, sex, mother’s
age, education occupation, reported household income
and sum of household assets were made using linear
regressions. No distinction of term or preterm children
was made but the Gap indicator was used as an indicator
of gestational age.
The statistical description of weight and length growth
has two objectives, the estimation of mean and variation
of attained weight and length as functions of child age and
the corresponding growth velocity also as a function of
child age. Theoretically the velocity functions are the first
derivatives of the attained weight and length functions.
Several methods have been suggested for statistical
description and analysis of growth data [18]. The ambition
for the present work was to use a simple approach, still
theoretically and scientifically defendable. Some different
models for smoothing curves were tried. The finally
selected were Fractional Polynomial Models [19] which
Page 3 of 9
provided good fit with reasonably simple forms. The study
of residuals in the weight model (not for length) suggested
that a logarithmic transformation should improve normality. The models presented therefore are Fractional Polynomials of degree 2 with relative residuals assumed to be
normally distributed with constant variance, in the case of
weight after logarithmic transformation. Subgroup specific
fitted Fractional Polynomials were used to describe the
growth by area and sex.
Differences in growth between the sites and child sex
and other independent variables were assessed using
two- level, mixed effect linear models. The dependent
variables were the relative residuals (logarithmic for
weight) from the overall fitted Fractional Polynomials.
The deviations from the WHO standard curves were
evaluated for statistical significance using the child specific means of relative deviations from the standards.
Growth velocity was calculated as the first derivative
of the fitted fractional polynomials.
In addition the average growth velocity for each child
over the first year, obtained through collapsing the dataset to child level was used.
Three linear regression models were used for the analysis of birth weight and residuals from the growth
curve:
Model A. independent variables: area (urban vs.
rural), Gap and child sex.
Model B. independent variables: area (urban vs.
rural), Gap, child sex, education and household
assets.
Model C. independent variables: area (urban vs.
rural), child sex, Gap, education, household assets,
mother age, household income and number of
household members.
The software used for all analysis was STATA version
11. In the analysis we used only singleton children.
Ethical consideration
Approval of the project was obtained from the Scientific
and Ethical Committee of Hanoi Medical University,
Hanoi Health Bureau and Dongda district authorities.
The proposal was approved by the Ministry of Health
and permission for the study was given after the baseline survey. All mothers of infants were informed about
the purpose of the studies and their right to decline participation or withdraw. Consent for participation was
given by all mothers of the included infants.
Results
Birth weight
Wide and highly statistically significant differences in
mean birth weight were found between the urban and
Nguyen et al. BMC Pediatrics 2012, 12:26
/>
Page 4 of 9
rural areas. Table 1 shows means, standard deviations
and confidence intervals by area and child sex. The distribution of the birth weights reported by the mothers
was reasonably symmetric. The estimated birth weight
difference between the areas for boys was 193 g (95%
CI: 134; 252) and for girls 146 g (95% CI: 79; 213). The
mean birth weight of the urban girls was actually significantly higher than of the rural boys (p < 0.01).
Table 1 also gives an overview of the variables that
have been considered as independent variables in the
regression models i.e. area (urban vs. rural), child sex,
Gap, mother age, mother education (three levels),
household income, number of household members and
number of household assets. A key feature of this information is that rural mothers are younger and less educated than the urban. The reported number of assets
and income are higher in urban households, drastically
so for income. The household size is larger in the rural
area.
Table 2 shows the regression results. In model A and
B, area, child sex and Gap variables exhibit low p-values
but the regression coefficient for area decreases markedly. This tendency continues into Model C where the
coefficient is very low and accompanied with a high pvalue. The negative sign of the regression coefficient for
education in the birth weight analysis is due to the difference in distribution between the urban negatively
skewed and the rural positively skewed distributions.
Infant growth
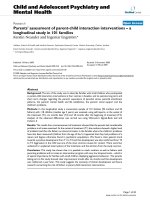
The estimated growth curves differed statistically significantly between the sites for both sexes (Figure 1). The
mean attained weight was generally higher in the urban
area than in the rural and, as seen in the graph,
increased in absolute term with increasing age. The pvalues from the two-level analysis of residuals were
smaller than 0.001 both for the area and the child sex
comparison. The same tendencies and p-values were
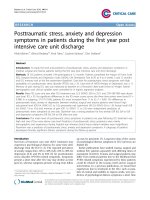
seen for the mean attained length (Figure 2).
Lines showing the WHO growth standards published
in 2006 [20] are included in Figures 1 and 2. The WHO
curve for weight falls between the fitted curves for the
urban and the rural area for both child sexes. The deviations from the WHO standard are statistically significant
in all cases (p < 0.01). The WHO standard for length is
significantly higher for the rural area (p < 0.01). For the
urban no significant deviation can be stated.
Estimated attained weight (grams) and limits for plus
and minus two standard deviations at 90, 180, 270 and
360 days of age differed between the two sites (Table 3).
The differences of infant growth in weight between
urban and rural areas increased with increasing age. At
90 days, the urban boys were estimated to be 4.1% heavier than the rural boys. This ratio increased to 7.2% at
360 days. The corresponding numbers for girls were
3.4% and 10.5%. Urban girls were almost 0.5 kg heavier
than rural boys at one year of age. The asymmetry of
the limits is due to the residual skewness.
The estimated attained length (cm) and limits for plus
and minus two standard deviations at 90, 180, 270 and
360 days of age also differed between the two sites
(Table 4). The residual distributions for length were
symmetrical and thus also the standard deviation limits.
Estimated weight growth velocity and length growth
velocity at 90, 180, 270 and 360 days decreased throughout the first year of life in both sites (Table 5). The differences of growth velocity between the rural and urban
infants increased over age. This was particularly evident
for the weight differences at all ages. Table 5 also shows
growth velocity in the first year of life with confidence
limits. The rural area estimates are significantly lower
than the urban for growth velocity in weight (p < 0.05).
For length, rural girls grow significantly slower than the
other groups (p < 0.05).
Table 1 Birth weight and background variables
Urban boys
Urban girls
Rural boys
Rural girls
Birth weight,
3298
3203
3105
3057
mean standard deviation
450
435
390
408
and 95% confidence interval, grams
(3263, 3422)
(3148, 3259)
(3071,3139)
(3017, 3097)
Low birth weight, %
2.3
4.2
4.1
4.9
Number of children in study
Days from reported last menstruation to birth, mean
300
272
237
271
513
271
409
272
Mother age, mean, years
28.7
28.3
25.4
25.3
Mother’ highest education primary school, %
8.6
4.9
54.8
54.6
Mother education higher than secondary school, %
58.2
67.1
17.4
16.8
Number of household members, mean
4.6
4.4
5.2
5.7
Number of household assets, mean
9.4
9.1
4.7
4.8
Yearly household income, median million VND
75 300 000
78 600 000
35 000
35 000
Nguyen et al. BMC Pediatrics 2012, 12:26
/>
Page 5 of 9
Table 2 Regression analysis of birth weight
Model A
Model B
Model C
Regression coefficient
p-value
Regression coefficient
p-value
Regression coefficient
p-value
179
0.000
158
0.000
20
0.877
Boys-girls
63
0.003
61
0.004
60
0.006
Gestational age proxy
4.4
0.000
4.3
0.000
4.3
0.121
2.1
0.366
Area urban-rural
Child sex
Mother age
Education
-24
0.133
-25
0.121
Assets gram incr. per item
Income (logarithm)
10
0.022
8.5
17
0.083
0.309
-5.2
R2 = 0.0976
0.301
Household members
Explanatory value R2
R2 = 0.0897
R2 = 0.0942
The associations between growth and the independent
variables described in Table 6 show the regression coefficients and p-values for Model A and C analysis of the
mean relative residuals for attained weight and length.
The results are significant and similar to those of birth
weight child sex, Gap, household assets and education.
The area variable association changes with the complexity
of the model as for birth weight. For length, only the child
sex and Gap variables are statistically significant.
Discussion
The main findings of the study are the differences
between urban and rural areas in birth weight as well as
in the subsequent growth, attained weight and length
Figure 1 Estimated mean curves for attained weight for age by sex together with WHO standard.
Nguyen et al. BMC Pediatrics 2012, 12:26
/>
Page 6 of 9
Figure 2 Estimated mean curves for attained length for age by sex together with WHO standard.
and growth velocity. For birth weight the differences
between boys and girls were expected as was also the
associations with the gestational age proxy. The latter is
the variable with the strongest correlation to birth
weight and is in turn related to subsequent attained
weight and length.
The area variable in itself, urban vs. rural, is of no
importance when other variables, with large differences
between the areas, are introduced in Model C. Some of
the added variables are not statistically significantly
associated to birth weight or growth but obviously form
an intricate pattern that “replaces” the area variable.
This finding is the same in the analysis of birth weight
and in the analysis of growth. Another common finding
is that there are associations between growth and household assets and education, particularly for weight
growth.
Growth velocity for weight differs between the areas
for both child sexes. The length growth velocity is lower
for rural girls. It shall be noted that all regression models have quite low values for the determination coefficient (R2) and that the largest part is contributed by the
Table 3 Attained weight (grams) with limits for plus and minus two standard deviations at selected ages
Urban area
Boys
Rural area
Girls
Boys
Girls
Age
Mean
(± 2 SD)
Mean
(± 2 SD)
Mean
(± 2 SD)
Mean
(± 2 SD)
90 days
6432
(5176,7992)
5999
(4703,7652)
6166
(4970,8562)
5794
(4646,7112)
180 days
8037
(6468,9986)
7541
(5912,8517)
7688
(6198,9490)
7156
(5783,8851)
270 days
9066
(7296,11264)
8618
(6757,9734)
8521
(6870,10568)
7982
(6451,9874)
360 days
9894
(7963,12294)
9644
(7561,12301)
9173
(7395,11377)
8624
(6970,10668)
Nguyen et al. BMC Pediatrics 2012, 12:26
/>
Page 7 of 9
Table 4 Attained length (cm) with limits for plus and minus two standard deviations at selected ages
Urban area
Boys
Rural area
Girls
Boys
Girls
Age
Mean
(± 2 SD)
Mean
(± 2 SD)
Mean
(± 2 SD)
Mean
(± 2 SD)
90 days
60.3
(54.6,66.0)
59.1
(53.4,64.8)
60.1
(55.0,65.2)
59.0
(54.3,63.8)
180 days
66.5
(60.2,72.9)
65.1
(58.9,71.3)
66.1
(60.5,71.8)
64.6
(59.4,69.8)
270 days
71.5
(64.7,78.3)
70.1
(63.4,76.8)
70.5
(64.4,76.5)
68.8
(63.3,74.3)
360 days
76.0
(68.8,83.2)
75.0
(67.8,82.2)
75.9
(67.6,80.2)
72.3
(66.5,78.1)
area and sex variables meaning that rather small fractions of the variation in birth weight and growth are
explained by the associations with Gap, area and child
sex differences and the social and economic variables.
The result from the present study is in accordance with
results from previous studies in other countries [6,7,21].
Differences in growth of infants between urban and rural
areas have been described in Peru in 1980. Height for age
and weight for age of rural infants did not catch up to
urban infants [21]. Newer studies in China show that
urban infants grow faster than rural infants [6,7].
Socioeconomic conditions, nutrition of mothers during
pregnancy, antenatal care, and increased maternal weight
gain during pregnancy have been seen to be associated to
the birth weight of the child [22-25]. Economic advantages, better education can lead to better nutrition for
mothers and faster fetal weight gain. A Vietnamese study
in 1996 found that 94% of rural farming women had insufficient food intake, compared to 40% for non- farming
women [26]. This situation has improved, but there can
still be considerable differences in food intake between
farming and non-farming women in Vietnam. The prevalence of anemia in women was higher in a rural area than
in an urban in India [27]. In Vietnam, no results on the
prevalence of anemia in urban areas are available but a
study in 2005 reported that in a rural area the prevalence
among pregnant women was as high as 43.2% [28].
The rural mothers of the children in the present study
attended antenatal care (ANC) later, had fewer visits
and much less of specific medical services than in the
urban mothers [15]. Differences in antenatal care could
be one factor behind the differences found in birth
weight and infant growth. Specifically poor adherence to
the guidelines for medical services can mean that conditions disadvantageous for growth are not detected.
Several conditions and factors have been shown as associated to poor growth of infants with nutrition as the most
important [1,29]. The nutritional status of under five children is proposed as a sensitive indicator of economic condition [30]. Some studies therefore explain differences in
child growth between rural and urban areas with differences in family income and general living conditions.
Fewer children in the urban families might lead to better
nutrition of each child [6,7]. Parent’s education has been
demonstrated to be one of the main contributing factors
for under five malnutrition in Bangladesh [30].
In Vietnam, the total fertility rate in the rural areas was
higher than in the urban area [31] but the income per
capita in urban areas was higher than in the rural [15,16]
Maternal education was also higher in the urban area
than in the rural. Both economy and education might
Table 6 Regression analysis of residuals from growth
curves
Model A
Weight
Area
Table 5 Growth velocity at selected ages and average
velocity from 90 to 360 days with 95% confidence
intervals
Age
Model C
Length
Coeff
p
Weight
Coeff
p
Length
Coeff
p
Coeff
p
.057
.000 .010
.000 .044
.157 -.012
.292
.061
.000 .021
.000 .060
.000 .020
.000
urban- rural
Child sex
Boys-girls
Weight (gram/day)
Length (cm/10 days)
Gestational age .00041 .002 .00014 .003 .00041
proxy
Urban
Urban
Mother age
-.00006 .917 .0002
Education
Assets gram
incr. per item
.010
.0029
.010 .0024 .125
.010 .00072 .106
Income
(logarithm
-.0010
.802 .0022
Household
members
.00002
.988 -.0007 .162
.1674
.0995
Boys
Girls
Rural
Boys
Girls
Boys
Girls
Rural
Boys
Girls
90 days
24.0
20.9
23.3
21.4
.84
.82
.79
.76
180 days
14.1
13.8
12.2
11.4
.60
.56
.59
.59
270 days
10.0
11.5
7.8
7.7
.51
.43
.53
.42
360 days
7.7
10.3
5.7
5.8
.47
.35
.53
.36
Average
12.8
13.5
11.1
10.5
.58
.59
.59
.49
Lower limit
12.2
12.7
10.7
9.9
.56
.57
.57
.48
Upper limit
13.4
14.3
11.6
11.1
.60
.61
.60
.50
Explanatory
value R2
.1523
.0857
.003 .00001 .011
.238
.191
Nguyen et al. BMC Pediatrics 2012, 12:26
/>
contribute to a better nutritional situation for infants in
urban areas. The present study shows drastic differences
in the educational and economic situation between the
urban and rural mothers and households. There is also a
tendency to smaller households in the urban area.
The differences in weight gain between rural and
urban infants found in this study are established at an
early age. One important factor may be differences in
breastfeeding patterns, especially the duration of exclusive breastfeeding. The absolute differences in growth of
infants between urban and rural areas increased with
increasing ages. Use of different types of supplement
food for infants in the two sites could explain this.
Infants in the urban area are likely to have easier
access to child health care than rural infants. Some barriers to access child health care in rural areas in Vietnam, like distance and long travel times, do exist.
Financial, sociocultural, language, ethnicity are other
possible barriers together with lack of knowledge, awareness and inequalities in quality of health care [32].
The differences of length growth between the two sites
were comparatively smaller at low ages, but increased in
absolute terms during infancy. This result is in agreement
with results of studies from China where urban children
were taller than rural children at all ages from one to 12
months of age [6,7]. One study found that the difference
of growth in length of children between rural and urban
areas is statistically significant only after six months and
especially after 2 years of age [6].
Different standards for child growth have been published by various institutions and international organizations. Recently, the World Health Organization (WHO)
launched growth standards in 2006. These were constructed to show child growth under ideal conditions
[20]. A study in Vietnam that assessed the growth of
children by using the new WHO child growth standards
as reference showed that deficient growth of infant is
widespread in Vietnam [14]. Another study in an urban
area of Hanoi found that the growth of Vietnamese
infants was also lagging behind the earlier used National
Centre for Health Statistic reference population [13].
The present results put urban boys and girls above the
WHO standards and the rural children below for
weight. For length again the rural curves are below the
standard. This can be seen as an indication that genetic
factors could not explain deviations in weight growth at
a population level in Vietnamese infants. A detailed analysis of the relation between the present results and the
WHO standards is beyond the scope of this paper but
further analysis seems urgent, not at least to explore
when early signs and warning of subsequent overweight
can be detected.
Compared to results of a study in urban Hanoi in the
1990’s, the birth weight and growth of infants in the
Page 8 of 9
present study are higher for both sites [13], indicating
that the birth weight and growth of infants in both rural
and urban areas of Hanoi have improved. There is, however, still a gap between the rural area and the urban
area suggesting differences in child health care and
nutrition.
One limitation of the study is the short follow-up
time. One year is not enough to study if differences
tend to decrease or increase as the children get older.
The ambition for further research shall be to continue
follow-up to at least 5 years to see if the rural children
catch up with urban children or if the gaps are further
widened. Also the exploration of overweight tendencies
will require longer follow-up. Certain unavoidable differences between the study designs, data collection and
administrative procedures might be seen as limitations.
For example the two cadres of interviewers have different employment conditions. But the good training and
the quality control have probably minimized this problem. The situation that there are unequal sample sizes
in the two areas is not optimal for comparison.
The research was conducted in two sites within the capital of Vietnam. These areas are generally considered to
have rather good socioeconomic conditions compared to
the rest of country. Even so, the birth weights and growth
of infants are higher in the urban area than in the rural
area. This suggests that differences are likely to occur also
in other, comparatively poorer, settings in Vietnam.
Conclusion
Mean birth weight as well as weight growth of infants,
described both as attained weight at different ages and
growth velocities were different between the investigated
areas in Vietnam. The birth weight was lower and the
growth considerably slower in the rural area, for boys as
well as for girls. The corresponding differences in length
growth of the infants were more modest but increased
with age during the first year of life. The results support
the hypothesis that the rather drastic differences in
mother education and economic conditions leads to
poor nutrition for mothers and children in turn causing
inferior birth weight and growth. The importance of
health care utilization and breastfeeding are two areas
that will need further exploration.
Acknowledgements
The authors would like to thank all field workers, mothers of infants and
infants at the two Health and Demographic Surveillances sites: FilaBavi and
DodaLab for their contribution to data collection. We also would like to
thank Dr Tran Khanh Toan for cooperation and advice. The study was
supported by grants from Sida/Swedish Research Council and the Nordic
School of Public Health, Sweden.
Author details
1
Research Institute for Child Health, National Hospital of Pediatrics, 18/879 La
Thanh Road, Dong Da district, Hanoi, Vietnam. 2Nordic School of Public
Nguyen et al. BMC Pediatrics 2012, 12:26
/>
Health, PO Box 12133, SE-402 42 Gothenburg, Sweden. 3Family Medicine
Department, Hanoi Medical University, No.1 Ton That Tung Street, Hanoi,
Vietnam. 4Sahlgrenska Academy, University of Gothenburg, PO Box 440, SE405 30 Gothenburg, Sweden.
Authors’ contributions
HNT led and supervised the fieldwork and data management. She also
drafted and completed this paper. BE assisted in the research design as well
as in the statistical analyses, interpretation of results and revising the
manuscript. HA, LNT, CNTK, MP and GB were involved in the design of the
study, supervised the study and revised the manuscript. All authors have
read and approved the final manuscript.
Authors’ information
Huong Nguyen Thu MD, researcher and pediatrician of the Research
Institute of Child Health and the National Hospital of Pediatrics in Hanoi,
Vietnam. She is also a PhD student of the Nordic School of Public Health in
Gothenburg, Sweden
Bo Eriksson PhD, Professor emeritus of the Nordic School of Public Health in
Gothenburg, Sweden
Liem Nguyen Thanh MD, PhD, Professor and Director of the Research
Institute of Child Health and the National Hospital of Pediatrics in Hanoi,
Vietnam
Chuc Nguyen Thi Kim PhD, Associated professor of Hanoi Medical University
Max Petzold is PhD, Professor of the Nordic School of Public Health and the
Gothenburg University in Sweden
Göran Bondjers MD, PhD is Professor of Gothenburg University in Sweden
Henry Ascher MD, PhD, Associate professor of Nordic School of Public
Health, Gothenburg, Sweden
Competing interests
The authors declare that our findings have not been influenced by our
personal or financial relationship with other person or other organization.
Received: 9 September 2011 Accepted: 12 March 2012
Published: 12 March 2012
References
1. Wei C, Gregory JW: Physiology of normal growth. Paediatr Child Health
2009, 19:5.
2. Harjunmaa U: Current growth patterns of Finnish children aged from 0-4
years. Master’s thesis University of Tampere; 2009.
3. Barker DJP: Fetal programming of coronary heart disease. Endocrinol
Metab 2002, 13(9):364-368.
4. Onis Md, Wijnhoven TMA, Onyango AW: Worldwide practices in child
growth monitoring. J Pediatr 2004, 144(4):461-465.
5. Reading R, Raybould S, Jarvis S: Deprivation, low birth weight, and
children’s height: a comparison between rural and urban areas. BMJ
1993, 307:1458-1462.
6. Li H, Zong X, Zhang J, Zhu Z: Physical growth of children in urban,
suburban and rural mainland China: a study of 20 years change. Biomed
Environ Sci 2011, 24(1):1-11.
7. He M, Mei J, Jiang Z, Chen Q, Ma J, Dai J, Li M, Su Y, Lui SS, Yeung DL,
et al: Growth of infants during the first 18 months of life in urban and
rural areas of southern China. J Paediatr Child Health 2001, 37(5):456-464.
8. Shen T, Habicht JP, Chang Y: Effect of economic reforms on child growth
in urban and rural areas of China. N Engl J Med 1996, 335(6):400-406.
9. Economic Integration and Vietnam’s Development: Final Report. 2009
[ />20and%20Vietnam’s%20Development.pdf].
10. Khan NC, le Tuyen D, Ngoc TX, Duong PH, Khoi HH: Reduction in
childhood malnutrition in Vietnam from 1990 to 2004. Asia Pac J Clin
Nutr 2007, 16(2):274-278.
11. WHO: Department of Making Pregnancy Safer. Vietnam Country profile.
2007 [ />12. Yen NT: Longitudinal observation of growth and development of
Vietnamese children from birth to five year-olds. PhD’s thesis Hanoi
Medical University; 2004.
13. Hop LT, Gross R, Giay T, Schultink W, Thuan BT, Sastroamidjojo S:
Longitudinal observation of growth of Vietnamese children in Hanoi,
Vietnam from birth to 10 years of age. Eur J Clin Nutr 1997, 51(3):164-171.
Page 9 of 9
14. Vaktskjold A, Trí ĐV, Phỉ DT, Sandanger T: Infant growth disparity in the
Khanh Hoa provine in Vietnam: A follow- up study. BMC Pediatr 2010,
10:62.
15. Tran TK, Nguyen CT, Nguyen HD, Eriksson B, Bondjers G, Gottvall K,
Ascher H, Petzold M: Urban-rural disparities in antenatal care utilization: a
study of two cohorts of pregnant women in Vietnam. BMC Health Serv
Res 2011, 11(1):120.
16. Chuc NT, Diwan V: FilaBavi, a demographic surveillance site, an
epidemiological field laboratory in Vietnam. Scand J Public Health Suppl
2003, 62:3-7.
17. WHO: Child Growth Standards: length/height-for age, weight-for length,
weight for height and body mass index-for-age: method and
development. 2006 [ />technical_report/en/].
18. Borghi E, de Onis M, Garza C, Van den Broeck J, Frongillo EA, GrummerStrawn L, Van Buuren S, Pan H, Molinari L, Martorell R, et al: Construction
of the World Health Organization child growth standards: selection of
methods for attained growth curves. Stat Med 2006, 25(2):247-265.
19. Roystone P, Altman D: Regression using fractional polynomials of
continuous covariates: parsimonious parametric modeling. J R Stat Soc
Ser A 1994, 43(3):429-467.
20. WHO: Child Growth Standards based on length/height, weight and age.
Acta Paediatr Suppl 2006, 450:76-85.
21. Graham GG, MacLean WC Jr, Kallman CH, Rabold J, Mellits ED: Urban-rural
differences in the growth of Peruvian children. Am J Clin Nutr 1980,
33(2):338-344.
22. Satpathy R, Das DB, Bhuyan BK, Pant KC, Santhanam S: Secular trend in
birthweight in an industrial hospital in India. Ann Trop Paediatr 1990,
10(1):21-25.
23. Hop LT: Secular trend in size at birth of Vietnamese newborns during
the last 2 decades (1980-2000). Asia Pacific J Clin Nutr 2003, 12(3):266-270.
24. Chowdhury S, Ammari F, Burden AC, Gregory R: Secular trend in birth
weight in native White and immigrant South Asian populations in
Leicester, UK: possible implications for incidence of type 2 diabetes in
the future. Practical Diabetes Int 2000, 17(4):104-108.
25. Ulijaszek S: Secular trend in birthweight among the Purari delta
population, Papua New Guinea. Ann Hum Biol 2001, 28(3):246-255.
26. Dinh PH, To TH, Vuong TH, Hojer B, Persson LA: Maternal factors
influencing the occurrence of low birthweight in northern Vietnam. Ann
Trop Paediatr 1996, 16(4):327-333.
27. Maninder K, Kochar G: Burden of Anaemia in Rural and Urban Jat
Women in Haryana State, India. Mal J Nutr 2009, 15(2):175-184.
28. Aikawa R, Khan NC, Sasaki S, Binns CW: Risk factors for iron-deficiency
anaemia among pregnant women living in rural Vietnam. Public Health
Nutr 2005, 9(4):443-448.
29. Nguyen ND, Allen JR, Peat JK, Schofield WN, Nossar V, Eisenbruch M,
Gaskin KJ: Growth and feeding practices of Vietnamese infants in
Australia. Eur J Clin Nutr 2004, 58(2):356-362.
30. Rayhan I, Khan SH: Factors Causing Malnutrition among under Five
Children in Bangladesh. Pak J Nutr 2006, 5(6):558-562.
31. Hung HV, Jampaklay A, Chamratrithirong A, Soonthorndhada K: Do RuralUrban Migrants Have Higher Fertility than Urban Non-Migrants in
Vietnam? Journal of Population and Social Studies 2009, 18(1):23-48.
32. WHO: Reaching the poor. Challenges for child health in the western
pacific region. The WHO Western Pacific Region; 2007 [ />pmnch/topics/child/reachingthepoor/en/index.html].
Pre-publication history
The pre-publication history for this paper can be accessed here:
/>doi:10.1186/1471-2431-12-26
Cite this article as: Nguyen et al.: Physical growth during the first year
of life. A longitudinal study in rural and urban areas of Hanoi, Vietnam.
BMC Pediatrics 2012 12:26.