Evaluation of water resources demand and supply for the districts of central Narmada valley zone
Bạn đang xem bản rút gọn của tài liệu. Xem và tải ngay bản đầy đủ của tài liệu tại đây (197.08 KB, 8 trang )
Int.J.Curr.Microbiol.App.Sci (2020) 9(2): 3043-3050
International Journal of Current Microbiology and Applied Sciences
ISSN: 2319-7706 Volume 9 Number 2 (2020)
Journal homepage:
Original Research Article
/>
Evaluation of Water Resources Demand and Supply for the Districts of
Central Narmada Valley Zone
Vinay Kumar Gautam1* and M.K. Awasthi2
Department of Soil & Water Engineering, College of Agricultural Engineering, JNKVV,
Jabalpur-482004 (M.P.), India
*Corresponding author
ABSTRACT
Keywords
Water resource,
Demand, Supply,
Rainfall, Water
balance, CNV
Article Info
Accepted:
20 January 2020
Available Online:
10 February 2020
The theme of this paper focused on the water resource availability and demand coupled
with projection for future in various sector economy of Central Narmada Valley (CNV) in
Madhya Pradesh. The study provides the information about water balance. National
Commission on Agriculture (NCA) has given a procedure to compute water budget of a
state based on rainfall and water demand by various sectors like crop water management,
domestic livestock demand and water demand towards industries. As per NCA guidelines
the major input for the water balance of an area is its normal rainfall and when it
multiplied by the geographical area it gives quantum of water generated. The annual
normal rainfall is 1200 to 1600 mm. The Water available for utilization and demand at
zonal level is 728644 ha m and 565313 ha m respectively. As for as the excess water
concerns the zone has 163331 ha m of surplus water and this is 29 % of total utilization At
block level the per unit hectare water availability in Hoshangabad district is 32 cm while it
is 27.5 cm in Narsingpur district. About 40% and 60% Utilizable water resources
availability in Narsinghpur and Hoshangabad District respectively. Seoni malwa block of
Hoshangabad district in zone level has maximum demand of water has a value 86979.74
ha m. The industrial demand is computed as 6% of available water thus total zonal demand
comes out as 565313 ha m. The relationship between water resource demand and supply is
discussed and water balance in the various provinces determined.
Introduction
Water budget is a demand and supply analysis
of water resources. The major input for the
water balance of an area is its normal rainfall
and when it multiplied by the geographical
area it gives quantum of water (Surface and
Ground water) generated. Water demand of a
single district is computed by adding water
consumed by different sectors viz. agriculture,
domestic, livestock and industrial. A study
shows that the water demand towards
domestic use and for livestock is much less
than the water required towards crops. About
80% of utilizable water is consumed by the
agriculture sectors. Water adequacy aims
towards optimum use of water to get
maximum production and maximum net
3043
Int.J.Curr.Microbiol.App.Sci (2020) 9(2): 3043-3050
return with available land resources. The
Agro climatic zone IV – Central Narmada
Valley has two districts namely Hoshangabad
and Narsingpur and comes under Wheat zone
having black soils. Annual normal rainfall of
zone varies from 1200 to 1600 mm. The
annual rainfall exceeded 14.6% and 32.3%
times than the normal annual rainfall in
Hoshangabad and Narsingpur districts
respectively.
appropriate measures may be proposed for
better management of the water resources in
the basin (Thomas et. al., 2015). The main
objective of this study is to assert the best
estimates for water demand and supply in the
Central Narmada Basin for various purposes
at present as well as the future. We argue here
that the current supply and demand can be
partially balanced in that region by available
strategic water resources that are not yet
utilized and through rational use of water
from recycling/treatment of these unexploited
water resources. We justify this by showing
that the region has a large footprint from the
demand side, with so far only a single source
from the supply side, and that supplying
sufficient quantity and quality of PW is a
good and a manageable option.
This is shown by calculating demand and
supply for irrigation, industry, domestic and
livestock purposes to determine the water
balance and water shortages, based on
Information from the authentic data from
international and national institutes and
sometimes locally available information
sources. This is study will help to quantifies
the water resources demand and supply for
the Central Narmada Basin and proposes
better implementation of solutions to the
water scarcity in the region.
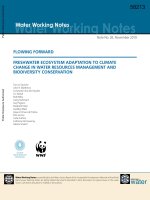
Fig.1 Location of Study area
Rainfall is the prime and sole input of water
to any area. Central Narmada Valley receives
total quantum of water towards rainfall as
1599893 ha m. Singh et. al. (1999) presented
a water resource assessment approach based
on water balance analysis of huruluwewa
watershed Silence. Watershed based water
management approach was found to be
feasible option to alleviate the problem of
water scarcity.
They concluded that water resource planning
is strongly linked to land use planning. The
Analysis of monsoon rainfall variability over
Narmada basin in central India suggested that
Materials and Methods
This study has three components: 1.
Assessment of water resources, 2. Estimation
of water demand and 3. Evaluation of current
water demand–supply status. Data used in the
assessment include climate data (rainfall,
temperature), census (demography, livestock),
water demand of different sectors and
agricultural production and industry. Water
resources assessment for the districts was
done from 1970 to 2015 using observed
rainfall inputs.
3044
Int.J.Curr.Microbiol.App.Sci (2020) 9(2): 3043-3050
Assessment of utilizable water resources in
cnv
Total water resources
The total amount of local water resources here
includes both surface water (natural runoff)
and ground water. So, the total water resource
available for utilization at zonal level is
728644 ha m in 2015 (of which the utilizable
surface water was 351718 ha m). This is
12.5% more than the year before, 1.5% more
than the annual average amount between 1970
and 2015, Ground water also adds to the
surface flow and it is taken as 23.739% of
surface flow. According to NCA guideline,
Water available for ground water storage is
12.5% of precipitation. The total ground
water available is 21.492% of total
precipitation. 31.625% of total ground water
is available for ground water utilization.
crops are gram (134819 ha), Pigeon pea
(33872 ha). Narsingpur is dominated in
pigeon pea (99.1%) and pulse cultivation
(94.3%). Sugarcane is also coming up in
steady way as now it is grown in 40960 ha
area of Narsingpur.
Domestic Water Demand
Domestic water demand includes use for
drinking, preparing food, bathing, washing
clothes and dishes, air conditioning,
gardening and other household purposes.
Total population of the zone is 2333116 as
per Census 2011. For domestic purpose per
capita water requirement is 135 liter/day as
per the WHO recommendations. According to
this the total domestic water requirement is
calculated. Although the water requirement
for urban and rural areas varies a lot, this
figure is adopted for understanding of the
gravity of the situation accordingly.
Water demand
Livestock Water Demand
From the population Figures of 2011 census,
the present population and projected
population for 2020 was estimated
considering the prevailing growth rate of
12.5%. Following data was used, to
characterize urban, agricultural and industrial
water demand.
1. Human population 2. Animal population 3.
Crop irrigation
Water requirement of crops and Irrigation
Water needs for growing crops depend mainly
on crop type and climate conditions. Such
water can be supplied to the crops by rainfall,
irrigation, or a combination of the two.
Detailed water demands for irrigation was
estimated of various crops that are grown in
the four provinces in the valley. The zone is a
Wheat zone has 353429 ha under wheat in
which Hoshangabad has contribution of
73.6%. Rice grown in 59303 ha. Other major
To assess the demand quantitatively, we
estimated the water required for livestock
farming and breeding according to norms
given by WHO in daily basis. Narsingpur has
more cross breed cattles as against
Hoshangabad as its percentage is 13.5% in
comparison to Hoshangabad percentage of
6.1% of total available cattles of these
districts. Both districts have scope of breeding
improvement programmes.
Industrial Water Requirement
The river banks of the both districts are
surrounded by small industries like marvel,
sugar, lather and gelatin industries and the
main sources of water for the industrial sector
are fresh groundwater and surface water. The
positive side of this trend is that water used in
industrial processes can be recycled, unlike in
agriculture where very little of it is actually
3045
Int.J.Curr.Microbiol.App.Sci (2020) 9(2): 3043-3050
consumed. In India, the water demand for the
industrial sector is on a rise and will account
for 8.5 per cent of the total freshwater
abstraction in 2025, the current level of 6 per
cent of the total freshwater abstraction by the
industries in 2010. (FICCI Water Mission,
New Delhi, 2011).
Water budget
Water budget is a necessary tool to estimate
the gap between demand and availability of
water resources from different sources.
National Commission on Agriculture has laid
down norms for water budgeting of an area
and as per its estimate the losses of water as
evaporation, surface water flow and ground
water flow out of the area is calculated in
present estimation.
Similarly, addition of water into the area as
runoff generated from the zone, addition of
soil moisture and to the ground water is also
computed. The available water within zone is
the sum of the district contribution. The
relationship between water availability was
addressed by water balance accounting and
order of priority. The basic demand
(Domestic and agriculture) has the highest
priority followed by the normal (Livestock
and Industry) demand.
strategies were discussed. This study
exploited the rank of relationship between
availability and demand to assess water
resource status in the CNV.
Utilizable water resources
The Central Narmada Valley (CNV) has two
district based on factors that influence water
resources availability and use. Annual normal
rainfall is 1200 to 1600 mm. The annual
rainfall exceeded 14.6% and 32.3% times
than the normal annual rainfall in
Hoshangabad and Narsingpur districts
respectively. The distribution of rainfall in the
zone is shown in fig. 1. The amount and onset
of rainfall in the zone vary with location.
Central Narmada Valley receives total
quantum of water towards rainfall as 1599893
ha m. the total water resource available for
utilization at zonal level is 728644 ha m in
2015.
Results and Discussion
Efficient water distribution strives to use
robust techniques to estimate the water
availability and demand, setup evaluation
tools. In addition to quantify the available
water resources and assessment procedures
need to address the relationship between
available water and biological indicators of an
adequate environmental flow (Jain, 2012;
Richter et al., 2003). A NCA norms were
used to assess water resource availability and
demand in data limited valley. Input data
requirement and data processing and
Fig. 1.1 Distribution of rainfall in CNV zone
Water demand
Domestic and Livestock water demand
Total population of the zone is 2333116 as
per Census 2011. Total human water needs of
the zone is 11496 ha m. Livestock population
comprises of cattle both cross breed and
indigenous, buffalo, bovine, sheep, goat,
3046
Int.J.Curr.Microbiol.App.Sci (2020) 9(2): 3043-3050
horses and ponies, mules, donkey, pigs, dogs,
rabbits, fowls, ducks, turkey and other
poultry. Narsingpur has more cross breed
cattles as against Hoshangabad as its
percentage is 13.5% in comparison to
Hoshangabad percentage of 6.1% of total
available cattles of these districts. Both
districts have scope of breeding improvement
programmes. Bovine is the main cattle class
(900871) followed by population of buffaloes
(239756). Except fowls in the Hoshangabad
(154219) which is three times more than the
Narsingpur all other animals are found in
these two districts are more or less of the
same quantity.
Water requirement of crops
The zone is a Wheat zone has 353429 ha
under wheat in which Hoshangabad has
contribution of 73.6%. Rice grown in 59303
ha. Other major crops are gram (134819 ha),
Pigeon pea (33872 ha). Apart from this other
pulses (Rabi) are also taken in 56669 ha and
in Kharif. It occupies 87346 ha. Narsingpur is
dominated in pigeon pea (99.1%) and pulse
cultivation (94.3%). Sugarcane is also coming
up in steady way as now it is grown in 40960
ha area of Narsingpur. For the zone Wheat is
the major Rabi crops and its water
requirement is 13640 ha m. Sugarcane is
another crop water requirement is 38450 ha
m.
Water budget
The Agro climatic zone- Central Narmada
Valley receives total quantum of water from
rainfall as 1599893 ha m. National
Commission on Agriculture has given some
guidelines for water budgeting of an area and
as per its estimate the losses of water as
evaporation, surface water flow and ground
water flow out of the area. Ground water also
adds to the surface flow and it is taken as
23.739% of surface flow.
Thus, surface flow arrives to be 723120 ha m
which is 45.198% of total precipitation. The
soil moisture increases due to rainfall as well
as from irrigation. 41.3% of rainfall and
7.067% of total surface flow is considered as
soil moisture storage. Total zonal soil moisture
storage is 711872 ha m and out of this 268184
ha m is available as ET for the crops.
Utilization of water takes place in four major
categories. These are, domestic and animal
water needs, crop water requirement and
requirement of water for industrial purposes.
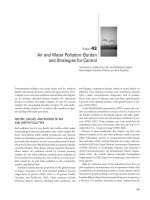
A water demand of different sectors in
districts of zone is presented in Fig. 2.
Total crop water requirement of the zone is
490886 ha m. In comparison to the crop water
demand the water demand towards domestic
and animal husbandry is very low as it is
respectively 11496 ha m and 8844 ha m. The
industrial demand is computed as 6% of
available water thus total zonal demand
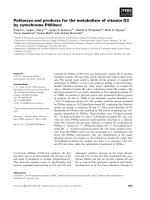
comes out as 79129 ha m.Total Water supply
and demand of different districts of zone is
presented in Fig. 3. The Excess is also shown.
The Water available for utilization at zonal
level is 728644 ha m. As for as the excess
water concerns the zone has 163331 ha m of
surplus water and this is 29 % of total
utilization. Considering net sown area as
623303 ha the average depth of excess water
available per hectare is 26 cm.
At district level the per unit hectare water
availability in Hoshangabad is 34 cm while it
is 18 cm in Narsingpur district. It means, the
future plans to enhance crop production or
alternate cropping may be based on this much
depth of water. on and industrial growth
driven by increased wealth. The water needed
for irrigation may also increase due to climate
change besides the effect of population
growth; however, in the zone, effect of
population growth on water demand will be
much larger than that of climate change.
3047
Int.J.Curr.Microbiol.App.Sci (2020) 9(2): 3043-3050
Fig.2 Water demand of different sectors in districts of Central Narmada Valley zone (ha m)
Fig.3 Total utilizable water resources demand and supply of both districts of Central Narmada
Valley zone (ha m)
3048
Int.J.Curr.Microbiol.App.Sci (2020) 9(2): 3043-3050
Conclusions
As we can see that water shortage in present
time in the CNV zone is not a serious issue
that will be expected to worsen in the future
because of population growth, increased
abstractions upstream, poor management of
the available water resources and climate
change. The Water available for utilization at
zonal level is 728644 ha m as compared to
565313 ha m for water demand. Analysis
shows that the 45 % and 60% of utilizable
water is used as crop irrigation purposes in
Narsinghpur and Hoshangabad district of the
zone respectively. This study represents the
most interesting scenario that water
consumption (water demand) can be manage
by knowing that crop water requirement is the
most water consumer sector in the study area.
The study also provides insight to the
vulnerability of the water resources in CNV.
References
Anonymous. 2002a. National Commission on
Agriculture, Ministry of Agriculture and
Irrigation, Govt. of India, New Delhi.
Anonymous. 2002b. National Water Policy,
Ministry of Water Resources, Govt. of
India, New Delhi.
Anonymous. 2005. Water Supply &Water
Demand and Agricultural Water
Scarcity in China: A Basin Approach.
International
water
management
institute.
Anonymous. 2015a. District Statistical Book.
District
Statistics
and
Planning
Department, Narsinghpur, Govt. of
M.P.
Anonymous. 2015b. District Statistical Book.
District
Statistics
and
Planning
Department, Hoshangabad, Govt. of
M.P.
Awasthi MK, Tomar VS, Nema RK, Lodhi
AS, Srivastava RN, Sharma SK, Pyasi
SK. 2018.A Book on Water Budgeting
of Madhya Pradesh, College of
Agricultural Engineering JNKVV,
Jabalpur, M.P.
Bhat NR, Lekha VS, Suleiman MK, Thomas
B, Ali SI, George P and Al-Mulla
L.2012
.Estimation
of
water
requirements for young date palms
under arid climatic conditions of
Kuwait. World Journal of Agricultural
Sciences 8 (5), pp 448–452.
Dessu Shimelis Behailu, M. Melesse Assefa,
Bhat Mahadev G., McClain Michael
E.2014. Assessment of water resources
availability and demand in the Mara
River Basin. Catena 115 (2014) 104–
114.
FICCI. 2011. Water Risk in Indian industry
survey report, a report published by
FICCI, New Delhi.
Jain SK. 2012. Assessment of environmental
flow requirements. Hydrol. Process. 26,
pp 3472–3476.
K.K Liu, Li CH, Yanga XL, Hua J, Xiaa
XH.2009. Water Resources SupplyConsumption
(Demand)
Balance
Analyses in the Yellow River Basin in
2009.2012.
The
18th
Biennial
Conference of the International Society
for Ecological Modelling. Procidia
Environmental science 13(2012), pp
1956-1965.
Kiniouar Hocine, Hani Azzedine, Kapelan
Zoran.
2017.
Water
Demand
Assessment of the Upper Semi-arid
Sub-catchment of a Mediterranean
Basin. International Conference on
Technologies and Materials for
Renewable Energy, Environment and
Sustainability. Beirut Lebanon. Energy
Procedia 119 (2017), pp 870–882.
Mustafa Al-Furaiji, Karim Usama, Hulscher
Suzanne,
Waisi
Basma.
2016.
Evaluation of water demand and supply
in the south of Iraq. Journal of Water
Reuse and Desalination, pp 214-226.
Richter BD. Mathews R, Harrison DL,
3049
Int.J.Curr.Microbiol.App.Sci (2020) 9(2): 3043-3050
Wigington R. 2003. Ecologically
sustainable
water
management:
managing river flows for ecological
integrity. Ecol. Appl. 13, 206–224.
Singh AK, Prinz D and Makin IW. 1999.
Water resource assessment as a basis for
watershed management. A study from
Huruluwewa, Srilanka 2nd Inter-
Regional Conference on Environment –
Water 99.
Thomas T, Gunthe SS, Ghosh NC, Sudheer
KP. 2015. Analysis of monsoon rainfall
variability over Narmada basin in
central India: Implication of climate
change. Journal of Water and Climate
Change. pp 615-627.
How to cite this article:
Vinay Kumar Gautam, Awasthi. M.K. 2020. Evaluation of Water Resources Demand and
Supply for the Districts of Central Narmada Valley Zone. Int.J.Curr.Microbiol.App.Sci. 9(02):
3043-3050. doi: />
3050