Lesson Communication systems simulation - I
Bạn đang xem bản rút gọn của tài liệu. Xem và tải ngay bản đầy đủ của tài liệu tại đây (653.48 KB, 10 trang )
Introduction
• First we study what simulation methods are
available
– Use of the Monte Carlo method is investigated
more thoroughly
• Then we study the structure of communication
systems and discuss their simulations
– What parts can be found in communication
systems?
– What is simulated in different parts?
Communication Systems
Simulation - I
Harri Saarnisaari
Part of Simulations and Tools for Telecommunication
Course
2
Simulation methods
Monte Carlo method
• Monte Carlo (MC) method
– Repeated random trials
• Quasianalytical (QA) method (or semianalytical)
– Average signal (e.g., bit/symbol decisions) is obtained by
passing a noiseless signal through the system
• Simulation part of QA
– Average is then used to obtain the result via analytical tools
• Assumed noise statistics is used
• Analytical part of QA
– May be also mixed with the MC method
• Also other less used techniques exits
• Only the MC method will be discussed hereafter
– Although QA is also useful
• Communication signals are random,
– Random data, random channel coefficient, random noise
(thermal noise, environmental noise), random delay,
random carrier frequency error, …
• Therefore, a single realization does not explain the whole
story
– It may even yield to misleading conclusions
• E.g., you send (in a simulator) a bit through a bad channel
and receive it correctly and then claim that BER is 0
although it really is 0.4 after serious simulations
• Several realizations are needed to see the average behavior
• In the MC method the same experimental is repeated
several times such that random phenomena in the process
are modeled as random variables and generated again and
again using random number generators (RNGs)
3
4
1
Monte Carlo method
Monte Carlo methods
• Basically, one measures how many times the
trial succeeds and how many times not
– i.e., the probability of success is calculated
• One is also interested to know how reliable the
obtained results are
– Confidence interval
• Simulations should be made in such a fashion that
the results have a desired error margin or result can
be expressed as
result = value ± desired conf. interval
• How many trials are needed for reliable results?
– In order that statistical measures are reliable,
a certain amount of experiments have to be
made
– The larger the number of trials N is, the
reliable the results are since
• Average often converges to the actual value
• Confidence intervals tend to zero at rate (1/N)1/2
• i.e., as N increases
– The average of trials becomes closer the actual value
– Interval at which the actual value is within certain limits of the
average becomes smaller
5
6
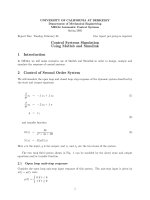
Monte Carlo methods, BER case
Monte Carlo methods, BER case
Number of
simulated
symbols
10 expected
errors
• From the previous fig one can draw the following
results
• If we consider 95 % conf. limit
– And have 10 expected errors the conf. limit is
4×10-(v-1) – 2,8 ×10-v
– And have 100 expected error the conf. limit is
9×10-(v+1) – 1,8 ×10-v
100 expected errors
7
8
2
Monte Carlo methods
Monte Carlo methods, estimation
• BER analysis
– 10-100 successful experiments (i.e., bit errors) have to be
made in order that BER analyses are reliable
• The larger value is better
• This means that if we want to reliably simulate results down to
BER 10-5 we have to send at least 106 bits or (preferably) 107 bits,
both very large numbers
– At very low BER simulation time may become very long
– Desired BER level depends on application
• For uncoded BER > 10-5 is usually sufficient
• For coded BER ≤ 10-6 is usually required
• For voice 10-2 -10-3 is often sufficient whereas data requires 10-6
• Simulations may be arranged such that you have a maximum
number of iterations Nmax and a minimum number of errors Nerr
– Simulation is stopped whichever limit is first reached
– This fastens simulations at low SNR/SINR since Nerr is usually
achieved much faster than Nmax
9
• Communication signals have to be synchronized
before data communication is possible
– Time, frequency, phase, amplitude are possible
synchronization/channel estimation targets
• The receiver has estimators for this purpose
• The performance of these estimators has to be
simulated (or analyzed if possible)
• The MC method is used also herein
– The random phenomena are modelled by RNGs
as in BER analysis
10
Monte Carlo methods, estimation
Monte Carlo methods, estimation
• In estimation algorithm studies simulations may
concern
– the mean and variance of the estimator and/or
– the probability that the estimator finds and/or
does not find the correct value
• For the latter case previous BER rules can be
used, i.e., 10-100 successful measurements
• Estimator is unbiased if its average value is equal
to the actual value
– Otherwise it is biased, i.e., there is a bias
between estimated and actual value
• The estimator is said to be efficient if the
variance attains the theoretical lower bound
known as the Cramer-Rao bound
• Estimator analysis usually contain comparison of
simulated results to this bound
– Often as a function of SNR
11
12
3
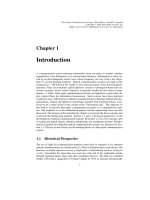
Monte Carlo methods, estimation
Monte Carlo methods, estimation
• The estimated variance σ2 is often used to set the
confidence limit as follows
– It is assumed that the estimator has Gaussian
distribution
• How many MC iterations are needed?
– The book explains that this is a difficult question
• The rule of thumb is that the larger the SNR the easier the
estimation and the less iterations are needed for reliable
results
• If scientific papers are considered 100 even 1000 iterations
are often used, but values outside this interval are also
common
• this is often valid, at least approximately due to the
central limit theorem
– It is well known that in Gaussian case
• 65% of samples are within ±σ of the mean and
• 95% of samples are within ±2σ of the mean
• Accuracy usually increases at rate (1/N)1/2
• As a rule of thumb, the result curves should be smooth, not
fluctuating
– 95 % accuracy or 2σ (2sigma) accuracy are
often used terms in system design
no
13
yes
14
Monte Carlo methods, estimation
Monte Carlo methods, estimation
• One way to solve the problem of number of iterations is as
follow
– Let a successful trial be such that the estimator gives a
result B that is within certain interval around ±δ the true
value A,
i.e., A-δ < B < A+δ
– If the number of successful trials is 10-100, the
iterations can be stopped (large value is better, even
larger than 100)
• Some even use conditioned estimation results
– they take into account for the mean and variance
calculation only the successful trials
– Depending on application this may be a valid way to do
it
15
• Use of limits is often sensible since
– In order that data system works at all, the
synchronization errors should be inside certain margins
– Synchronizers often have a coarse phase (acquisition)
and a fine tuning phase (tracking) and the latter usually
assumes that errors are within its pull in range
• NOTE
– Sometimes also maximum errors, maximum and
minimum BER, etc are recorded and these are reported
together with means,
– Or, 95% (or X %) results are calculated in simulations
instead assumed to be approximated from theory (look
the figure)
16
4
Communication simulations
Communication simulations
• A communication system designer has
requirements the system has to satisfy and also
limitations that have to be taken in the account
– These may be given in a requirements
definition document by the “customer”
• Simulations (in addition to analysis and
prototyping) are used to verify are the
requirements and limitations possible to satisfy
with the selected elements or to find which
elements satisfy the requirements and limitations
• A communication network consist of set of nodes
• The target
– of a node is to send information to some other
node or nodes
– and of a network is to allow these connections
• The nodes are devices that consist of
– Hardware
– Software
• The totality therefore consists of different
(sub)systems
17
Communication simulations
18
Some possible requirements
• Thus, we have
– System level requirements
– Bit rates the system has to support
• May be different for different services
• The overall system has to satisfy the requirements
– voice, data, video,…
– BER targets
– Subsystem level requirements
• The subsystems have to satisfy their requirements
• May be different for different services:
– voice, data, video,…
• Also frame or packet error rate may be of interest
– Number of nodes the (sub)system has to support
– Nodes should be networked possibly in different ways
– Level and type of interference the system has to tolerate
• Interference from other systems at nearby frequency bands
• Intentional interference in military systems
– The system possibly has to operate in different environments
– The system has to have connections to other systems
– …
19
20
5
Some possible requirements/limitations
Communication simulations
• Communication systems can be considered at different
levels
– Higher and lower levels contain different parts of the
systems
• Nodes jointly form (communication) networks (higher level)
• Different (kind of) networks jointly form larger networks
• Nodes are connected through (communication) links (lower
level)
– Links consists of
– Costs
– Size and weight of equipments
– Power consumption
• E.g., effect to operation time without battery
recharge
– Interference to other systems
• E.g., adjacent band interference
• Transmitter
• Propagation medium (optic, wired, wireless)
• Receiver
–…
• At different levels the simulations concern different things
21
22
Communication simulations
• Transmitters and receivers (transceivers) are indented to
execute some functions such that data can be
communicated
• Transceivers consist of different elementary parts
– Hardware (HW)
– Software (SW)
• Both parts do some functions and consist of several
building blocks
– Each block and their entity has to satisfy given
requirements
• The overall transceiver (HW+SW) has to satisfy the
requirements
Networks are usually
linked somehow since
the goal in communications
is to send information
from a place to another (not
just inside a network)
Networks and links are just
means to attain the goal
23
24
6
Communication simulations
Network level simulations
• Communication simulations can be divided into
several parts
– Network level simulations
– Link level simulations
– Algorithm level simulations
• Performance of algorithms in a link are investigated
separately
– Platform level SW simulations
– Platform level HW simulations
• Network level simulations are used to see
– How information flows inside a network and/or between
networks
– How applications and devices are able to send and
receive information
– How networking functions (algorithms) affect to this
capability
– Which networking algorithms satisfy requirements
– Where, in which situations, certain networking algorithm
is useful
• Networking
– Routing (NET)
– Medium access control (MAC)
• often MAC and NET investigated separately
– Link control
25
Network level simulations
26
Network level simulations
• Possible variables
– Number of nodes
– Density of nodes in certain area
– Propagation loss and range between nodes
– Mobility of nodes
– Interference,
• What is simulated
– Data throughput as a function of the number of nodes or
some other variable
• Maximum (capacity of the network), average
– Latency (end-to-end delay) and jitter (change of delay)
of messages
• Important e.g. for voice and other (near) real time services
• e.g., co-channel interference effects
– Usability and effects of
– Information packet size and birth rate
• E.g., follow certain statistical distributions (that are
obtained as approximation based on real measurements)
• It is obvious that voice and data (e.g. video) packet sizes
are different
– Possible communications data rates for a link
(models modulation level, channel coding, etc)
• Routing protocols,
– Proactive, reactive
• Access protocols, MAC
– Carrier Sensing (CSMA), TDMA, FDMA, CDMA, ALOHA
• Packet addressing protocols (like IPv6),
• QoS (quality of service) protocols (like packet priority), ….
– voice (low latency), real time video vs non-real time, etc
– How much capacity networking commands require?
• What is networking overhead?
27
28
7
Network level simulations
Network level simulations
• What is simulated
– Scalability of protocols
• Does them work with different number of nodes? E.g., with 10
nodes and also with 200 nodes
– Mobility of nodes
• How this affects the performance?
– How interference or for some other reason lost
connections (links) affect to the system
• One has to think what are relevant features the network
simulator has to have
• Usually links are modeled using a high level model
– Link budget is calculated for the desired and interfering
signals
• Gives SINR (signal-to-interference-plus-noise ratio)
– BER is calculated analytically based on SINR like
BER=f(SINR)
• Robustness of the network
– How packets are distributed inside network
– How network recovers from problematic situations
• In AWGN f() is well known Q-function
• E.g., lost connections (auto-recover, self-fixing)
• Rush hours
• i.e., transceivers are not actually simulated
– This saves efforts, time and costs
– This is a QA method
– What is the utilization rate of the network
29
Network level simulations
30
Link level simulations
• Sensor networks
– Cheap simple sensors are deployed in an area. Collected
information is used to make decisions.
– Hundreds or thousands of nodes
• Simulation only meaningful way to test
– Must be energy efficient
• Stand-alone nodes must be operable as long as possible
– Energy efficient simple routing protocols are needed
• Obtained BER at different channels using different modulations
and receiver algorithms
• Supported bit rates at different channels (BER goals in mind)
• RF and antenna effects
• Effects of uncertainties in synchronization/channel estimation to
BER
• Performance of different synchronization and channel estimators
(algorithms) in different environments
• Performance of different detection and demodulation algorithms,
channel coding schemes, …
• We consider the link level hereafter (since the book does it too)
31
32
8
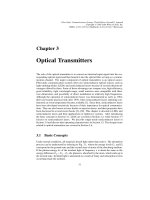
Typical elements of a link
To RF frequency,
power amplification
Link simulations
Digital signal
formation
Coding part
• Random elements are
– Data symbols (bits)
– Additive (thermal) noise
– Amplitude and phase of multipath components (in fading
channels)
– Number of multipath components
– Frequency error in some channels
– Delay (time-of-arrival)
– Delay and frequency spread
– Direction-of-arrival (in cases the direction matters like
multiantenna, directional antenna)
– External interference usually contains random features
– …
33
RF Simulations
Effects of
RF/DA
Other
signals
R
a
d
i
o
c
h
a
n
n
e
l
Effects of Thermal
RF/AD
noise
Decoding part
Digital signal processing for
demodulation/synchronization/
channel estimation
From RF to
IF/baseband
34
RF Simulations
• RF simulations and corresponding tools are used
for RF design
• These are used to design, e.g.,
– Antennae and antenna groups
(e.g., mutual coupling)
– RF filters
– Power amplifiers
– Mixers (up and downconversion)
– Combinations of these
35
• Different RF building blocks may have existing
models (e.g., from manufacturers)
• Blocks are combined to form a complete RF block
• Simulation shows does the RF part perform as it
should or are changes needed
• Note:
– RF simulations give also the transfer function
of the RF part
– Can be used in link level simulations to model
the RF part
36
9
Platform Simulations
Platform Simulations
• Platform is a device or set of devices on which the
transceiver is implemented
• There are several topics that have to be considered
– AD/DA conversion
• Sufficient word length
• Effects of limiting in reception (insufficient AGC)
– Finite word length effects
• Fixed point vs floating point
• How algorithms perform with these
– How many bits are needed for satisfactory performance
» Input word length, internal word length
» E.g., how many internal bits are needed for sufficient performance
for given input word length
• How to scale signal to prevent overflow?
• How overflow affects?
37
• How signal flows between different blocks
• Simulation of different finite word length
algorithms
– Filters
– Matrix inversions
– (I)FFT
– ...
• Etc.
38
Other Simulation Examples
• Simulations are also used to design base station
locations
– Propagation models in addition with map and
geographical information (hills, vegetation,
streets, buildings) are used to estimate base
station coverage areas
• Network time synchronization
– How clocks are kept to show equal time
– Needed, e.g., in time stamping of events
39
10