Functional and molecular characterization of T cells and Natural killer (NK) cells in rainbow trout (Oncorhynchus mykiss)
Bạn đang xem bản rút gọn của tài liệu. Xem và tải ngay bản đầy đủ của tài liệu tại đây (13.53 MB, 172 trang )
LUẬN VĂN TIẾN SỸ
ĐẶNG THỊ HƯƠNG
VIỆT NAM
Functional and molecular characterization of
T
cells
and
Natural
killer
(NK)
cells in
rainbow trout (Oncorhynchus mykiss)
Inauguraldissertation zur Erlangung des akademischen Grades
doctor rerum naturalium (Dr. rer. nat.)
an der Mathematisch-Naturwissenschaftlichen Fakultät
der Ernst-Moritz-Arndt-Universität Greifswald
vorgelegt von
Huong Dang Thi
geboren am 27.05.1982
in Bac Giang, Viet Nam
Greifswald, 2015
Dekan:
1.Gutachter: Prof.Dr.Mettenleiter
2.Gutachter: Prof.Dr.Steinhagen (Hannover)
Tag der Promotion: 29.09.2015
List of content
Content
List of figures ...................................................................................................................... I
List of tables..................................................................................................................... III
Abbreviations .................................................................................................................. IV
Zusammenfassung........................................................................................................... VI
Summary ....................................................................................................................... VIII
Chapter 1.
General introduction .................................................................................. 1
1.1.
Aquaculture ..................................................................................................................... 1
1.2.
Aquaculture production of rainbow trout .................................................................... 1
1.3.
Taxonomy of rainbow trout ........................................................................................... 3
1.4.
Problems in modern aquaculture production .............................................................. 4
1.4.1.
Antibiotic treatment.................................................................................................... 5
1.4.2.
Increasing survival of fish caused by probiotic treatment.......................................... 6
1.4.3.
Vaccination................................................................................................................. 7
1.5.
Immune system of teleost.............................................................................................. 10
1.5.1.
Immune organs in fish .............................................................................................. 10
1.5.2.
Innate immune system in fish................................................................................... 12
1.5.3.
Adaptive immune system ......................................................................................... 13
1.5.4.
B cells and Immunoglobulins ................................................................................... 15
1.5.5.
T cells and TCR receptors in teleost ........................................................................ 15
1.5.6.
NK cells in teleost .................................................................................................... 18
1.5.7.
CD56 ........................................................................................................................ 21
1.6.
Aims of the present study ............................................................................................ 24
Chapter 2.
Distribution of T cell subpopulations in lymphoid and mucosal organs
of rainbow trout (Oncorhynchus mykiss) characterized by new lineage
marker specific monoclonal antibodies .................................................. 25
2.1.
Abstract .......................................................................................................................... 26
2.2.
Introduction ................................................................................................................... 27
2.3.
Material and methods ................................................................................................... 29
2.3.1.
Animals and organ sampling .................................................................................... 29
2.3.2.
Leukocyte preparation .............................................................................................. 29
2.3.3.
Generation of monoclonal antibodies ...................................................................... 29
2.3.4.
Single and dual flow cytometry ............................................................................... 30
List of content
2.3.5.
Immunoprecitation .................................................................................................... 30
2.3.6.
Separation of lymphocyte subpopulations ................................................................ 31
2.3.7.
RT-PCR and real-time PCR ...................................................................................... 32
2.3.8.
Functional assays ...................................................................................................... 32
2.3.8.1. Reaction pattern of mab D11, mab D30 and mab 89 on stimulated cells ........................... 32
2.3.8.2. Kinetics of B and T cells in allogeneic stimulated trout ..................................................... 32
2.3.8.3. Cell mediated allogeneic cytotoxicity assay ....................................................................... 33
2.4.
Results ............................................................................................................................. 34
2.4.1.
Mab D11, mab D30 and mab 89 display a unique staining pattern .......................... 34
2.4.2.
Mab D11 and D30 recognize the same leukocyte population .................................. 39
2.4.3.
The marker recognized by mab 89 is not expressed on all T cells ........................... 40
2.4.4.
Naive B cells or thrombocytes are not labelled by mabs D11, D30 or 89................ 41
2.4.5.
Immunochemical characterization of the T cell surface marker recognized by mab
D11 and mab D30 ..................................................................................................... 42
2.4.6.
Distribution of T lymphocyte subpopulations in lymphoid organs of rainbow trout42
2.4.7.
CD8α- T cells are characterized by expression of CD4 mRNA as Th cells. ............ 44
2.4.8.
The expression of specific transcription factors reveals the presence of Th cell
subpopulations. ......................................................................................................... 46
2.4.9.
2.5.
Functional characterization of rainbow trout T cells ................................................ 49
Discussion ....................................................................................................................... 51
Chapter 3.
A multicolour flow cytometry identifying leukocyte subsets of rainbow
trout (Oncorhynchus mykiss) .................................................................. 55
3.1.
Abstract .......................................................................................................................... 56
3.2.
Introduction.................................................................................................................... 57
3.3.
Material and methods.................................................................................................... 57
3.4.
Results and discussion ................................................................................................... 58
Chapter 4.
CD56 (NCAM1) positive leukocyte population in rainbow trout –
molecular and functional characterization ............................................ 62
4.1.
Abstract .......................................................................................................................... 63
4.2.
Introduction.................................................................................................................... 64
4.3.
Material and Methods ................................................................................................... 66
4.3.1.
Fish............................................................................................................................ 66
4.3.2.
Leukocyte preparation and cell sorting ..................................................................... 66
4.3.3.
RNA extraction and cDNA synthesis ....................................................................... 67
4.3.4.
Cloning and sequencing of CD56 ............................................................................. 67
4.3.5.
Sequence analysis ..................................................................................................... 67
List of content
4.3.6.
Identification of alternative splicing in trout CD56 ................................................. 68
4.3.7.
RT-PCR analysis ...................................................................................................... 68
4.3.8.
Generation of monoclonal antibodies using recombinant protein ........................... 68
4.3.9.
Immunofluorescence analysis of cells...................................................................... 69
4.3.10.
4.4.
NK cell cytotoxicity in xenogeneic model ............................................................ 69
Results ............................................................................................................................ 71
4.4.1.
Sequence analysis and characterization of trout CD56 ............................................ 71
4.4.2.
Phylogenetic analysis ............................................................................................... 76
4.4.3.
Characterization of CD56 variability by VASE element ......................................... 78
4.4.4.
Characterization of CD56 variability by MSD element ........................................... 80
4.4.5.
In vivo expression of CD56 isoform transcripts in tissues and leukocytes .............. 89
4.4.6.
Trout CD56 expression in T and myeloid cells contrast to
IgM+ B cells and
thrombocytes ............................................................................................................ 90
4.4.7.
Up-regulation of trout CD56 expression upon xenogeneic stimulation ................... 91
4.4.8.
Natural cytotoxicity assay ........................................................................................ 92
4.4.9.
Characterization of anti-trout CD56 mabs ............................................................... 94
4.5.
Discussion ....................................................................................................................... 97
Chapter 5.
General discussion and outlook ............................................................ 103
5.1.
Monoclonal antibody production............................................................................... 103
5.2.
New established antibodies, new immune tools for studying T cells of fish immune
system (chapter 2 of the present thesis)..................................................................... 106
5.3.
Gene duplication.......................................................................................................... 109
5.4.
CD56 diversity, a typical example indicating the success of salmonids ................. 111
5.5.
Rainbow trout CD56, a marker NK cell ................................................................... 116
5.6.
Outlook ......................................................................................................................... 119
Appendix ......................................................................................................................... 121
Appendix 1:
Genbank accession numbers ....................................................................... 121
Appendix 2:
Sequence of primers .................................................................................... 122
Appendix 3:
Nucleotide sequence of a clone containing triplet “AAG” in front of M30
exon ............................................................................................................... 124
Appendix 4:
The possible membrane bound trout MSD combinations of trout CD56
transcripts ..................................................................................................... 125
References ....................................................................................................................... 128
Acknowledgement .......................................................................................................... 149
About the author ............................................................................................................ 151
List of content
List of publication and oral presentation ............................................................................. 151
Resume ..................................................................................................................................... 153
Personal Data........................................................................................................................ 153
Education .............................................................................................................................. 153
Work experience .................................................................................................................. 153
Muster der Erklärung ................................................................................................... 154
List of figures
List of figures
Figure
1
Global
aquaculture
production
of
rainbow
trout
from
1973-‐2012
(FAO
2014b)
______________
2
Figure
2
World
leading
countries
in
the
aquaculture
production
of
rainbow
trout
in
2012
(FAO
2014b)
__
2
Figure
3
Production
of
main
fishes
in
Germany
(FAO
2014b)
____________________________________
3
Figure
4
The
evolutionary
position
of
rainbow
trout
(Berthelot
et
al.
2014)
________________________
4
Figure
5
Comparison
of
antibiotic
use
and
salmon
production
in
Norway
in
relation
to
appearance
of
bacterial
diseases
and
introduction
of
anti-‐bacterial
vaccines
(modified
from
Sommerset
study
(Sommerset
et
al.
2005))
_________________________________________________________
8
Figure
6
Receptors
of
CD56
in
NK
cells
(Cooper
et
al.
2001b)
___________________________________
22
Figure
7a
Flow
cytometry
pattern
of
mab
D11
with
leukocytes
from
different
lymphoid
tissues
________
34
Figure
7b
Flow
cytometry
pattern
of
mab
D30
with
leukocytes
from
different
lymphoid
tissues
________
35
Figure
8
Flow
cytometry
pattern
of
mab
89
with
leukocytes
from
different
lymphoid
tissues
_________
36
Figure
9
Immunomagnetic
sorting
of
leukocyte
subpopulations
from
spleen
using
different
mabs
specific
for
lineage
marker
_____________________________________________________________
37
Figure
10
Relative
mRNA
expression
of
lineage
marker
molecules
in
immunomagentically
enriched
leukocyte
subpopulations
_______________________________________________________
38
Figure
11
Single
and
double
labelling
pattern
of
mab
D11
and
D30
on
trout
leukocytes
from
thymus,
blood
and
spleen
___________________________________________________________________
39
Figure
12
Two-‐color
flow
cytometry
of
leukocytes
from
thymus,
intestine
and
gills
using
D11
mab
and
89
mab
________________________________________________________________________
40
Figure
13
Two
color
flow
cytometry
staining
of
spleen
leukocytes:
mab
D11
+
mab
anti-‐IgM
of
B
cells
or
mab
thrombocyte
or
intestine
leukocytes:
mab
89
+
mab
anti-‐Ig
light
chain
of
B
cells
_______
41
Figure
14
Immunoprecipitation
of
membrane
proteins
from
thymus
leukocytes
using
D11
mab
and
D30
mab
________________________________________________________________________
42
Figure
15
Double
labelling
of
leukocytes
with
mab
D11/D30
or
mab
89
and
anti-‐trout
CD8α
mab
______
43
Figure
16
Double
labelling
profile
of
mab
D11
+
anti-‐trout
CD8α
or
mab
89
+
anti-‐trout
CD8α
in
leukocytes
from
primary
(head
kidney,
thymus)
peripheral
(blood,
spleen)
and
mucosal
(gill,
intestine)
lymphatic
organs
______________________________________________________________
44
Figure
17
Fluorescence
based
cell
sorting
of
CD8α
and
CD8
T
cells
using
mab
D11
and
anti-‐trout
CD8α
45
+
-‐
Figure
18
mRNA
patterns
of
sorted
CD8α
or
CD8α
T
cells
from
thymus,
spleen
and
intestine
_________
45
+
-‐
Figure
19
Expression
patterns
of
transcription
factors
in
CD8α
and
CD8α
T
cells
from
thymus
isolated
+
-‐
from
5
trout
after
fluorescence
based
sorting
_______________________________________
46
Figure
20
Expression
patters
of
transcription
factors
in
CD8α
and
CD8α
T
cells
from
thymus
and
spleen
+
-‐
isolated
from
two
trout
_________________________________________________________
47
Figure
21
Example
of
sorting
trout
thymus
leukocytes
into
four
subpopulations
using
mab
D11
and
anti-‐
trout
CD8α
___________________________________________________________________
47
Figure
22
mRNA
pattern
of
sorted
leukocyte
subpopulation
from
thymus
measured
by
real-‐time
PCR
___
48
Figure
23
mRNA
patterns
of
four
leukocyte
subpopulations
isolated
from
intestine
_________________
49
I
List of figures
+
Figure
24
Relative
amount
of
total
versus
CD8α T
cells
after
xenogeneic
or
allogeneic
stimulation
in
spleen
or
gill
24h
post
stimulation.
_______________________________________________
49
Figure
25
Kinetics
of
D11
T
cells
and
IgM
B
cells
in
spleen
after
allogeneic
stimulation
_____________
50
+
+
Figure
26
Kinetics
of
D11
T
cells
in
spleen
after
repeated
allogeneic
stimulation
___________________
50
+
Figure
27
Analysis
of
the
cell
composition
in
the
peripheral
blood
leukocytes
of
rainbow
trout
using
6 -‐color
flow
cytometry
_______________________________________________________________
59
Figure
28
Genomic
trout
CD56
organization
and
three
main
isoforms
in
transcripts
generated
after
transcription
and
splicing
of
trout
CD56
___________________________________________
72
Figure
29
Deduced
amino
acid
sequence
of
trout
CD56
aligned
to
zebrafish
CD56
__________________
73
Figure
30
Evolutionary
relationship
between
members
of
NCAM
gene
family
______________________
77
Figure
31
Nucleotide
sequences
of
trout
CD56-‐VASE
gene
a
and
b
exon
and
intron
boundaries
and
adjacent
splice
junctions
in
trout
genomic
DNA
_____________________________________
78
Figure
32
Comparison
of
deduced
amino
acid
alignment
of
VASE
domain
in
trout
CD56
a
and
b
genes
with
those
of
other
CD56
genes
from
other
vertebrates
___________________________________
79
Figure
33
Expression
patterns
of
transcripts
of
CD56
with
the
VASE
elements
at
the
exon
7/8
junction
in
different
trout
tissues
__________________________________________________________
79
Figure
34
Alternatively
spliced
MSD
domain
in
six
main
trout
CD56
isoforms
______________________
80
Figure
35
Nucleotide
sequences
of
trout
CD56-‐MSD
exon
and
intron
boundaries
and
adjacent
splice
junctions
in
trout
genomic
DNA
(continue
next
page)
_________________________________
82
Figure
36
Nucleotide
and
deduced
AA
of
trout
MSD
sequences
_________________________________
86
Figure
37
Nucleotide
and
deduced
AA
sequence
of
isoforms
containing
M65,
M15’M58,
intron281a
_______
87
Figure
38
In
vivo
expression
of
MSD
domain
in
different
trout
tissues
by
RT-‐PCR
___________________
88
Figure
39
In
vivo
expression
of
six
different
trout
CD56
isoform
transcripts
in
different
tissues
by
RT-‐PCR
89
Figure
40
In
vivo
expression
of
six
different
trout
CD56
isoforms
in
leukocytes
at
mRNA
level
by
RT-‐PCR
_
90
Figure
41
Expression
of
mRNA
transcripts
in
leukocyte
subpopulation
____________________________
90
Figure
42
mRNA
expression
analysis
of
trout
CD56
and
effector
molecules
after
xenogeneic
injection
__
92
Figure
43
Natural
cytotoxicity
of
trout
spleen
leukocytes
against
P815
cells
at
different
effector
to
target
cell
ratio
____________________________________________________________________
93
Figure
44
Natural
cytotoxicity
of
trout
spleen
leukocyte
subpopulations
against
P815
cells
at
different
effector
to
target
cell
ratio
______________________________________________________
93
Figure
45
Immunofluorescense
staining
of
transfected
3T3
cells
using
anti-‐trout
CD56
mab
__________
94
Figure
46
Immunofluorescense
staining
of
trout
brain
cells
using
anti-‐trout
CD56
mab
______________
94
Figure
47
Immunofluorescense
staining
of
trout
leukocytes
using
anti-‐trout
CD56
mab
______________
95
Figure
48
Flow
cytometry
of
leukocytes
from
different
lymphatic
tissues
staining
with
anti-‐trout
CD56
mab
___________________________________________________________________________
96
Figure
49
Two-‐color
flow
cytometry
staining
trout
leukocytes
using
anti-‐trout
CD56
and
other
anti-‐trout
mabs
_______________________________________________________________________
96
Figure
50
Evolution
of
trout
CD56
genes
__________________________________________________
110
Figure
51
Predicted
proteomic
diversity
of
trout
CD56
_______________________________________
115
II
List of tables
List of tables
Table
1
Fundamental
features
of
adaptive
immune
systems
of
teleost
fish
and
mammals
(Sunyer
2013)
14
Table
2
Antigens
expressed
differentially
by
resting
human
NK
cell
subsets
(Cooper
et
al.
2001a)
_____
23
Table
3
Percentage
of
labelled
leukocytes
from
different
organs
taken
from
10
healthy
unstimulated
trout.
________________________________________________________________________
36
Table
4
The
specificity
of
monoclonal
antibodies
together
with
selected
fluorochrome
used
in
current
study
is
listed
in
table
below
______________________________________________________
58
Table
5
The
identity
of
trout
CD56
with
CD56
from
other
animals
at
amino
acid
level
_______________
71
Table
6
Summary
of
MSD
sequences
______________________________________________________
84
Table
7
Antibodies
against
teleost
surface
molecules
________________________________________
103
Table
8
CD
markers
pattern
of
vertebrate
leukocyte
subsets
__________________________________
104
III
Abbreviations
Abbreviations
All abbreviations used in this thesis are listed in alphabetical order.
IV
Ab
Antibody
AIS
Adaptive Immune System
APC
Antigen Presenting Cell
AS
Alternative Splicing
CCR7
CC-chemokine receptor 7
CD
Cluster of Differentiation
CD56 (NCAM1)
Neural adhesion molecule 1
CIS
Combinatorial Immune Response
CTL
Cytotoxic T Lymphocyte
CXCR
CX-chemokine receptor
Cys
Cysteine
DAMPs
Danger-Associated Molecular Patterns
DAP12
TYRO protein tyrosine kinase-binding protein
Facs
Fluorescence Activated Cell Sorting
FcγR
Fc gamma receptor
FNIII
Fibronectin type III
GPI
Glycosyl Phosphatidyl Inositol
IC
Intracellular
ICOS
Inducible Costimulator
IFN
Interferon
IFNγ
Interferon gamma
Ig
Immunoglobulin
IL
Interleukin
IL-1RAcP
Interleukin-1 Receptor Accessory Protein
ILT-2
Ig-Like Transcript 2
ITAM
Immunoreceptor Tyrosine-based Activation Motif
ITIM
Immunoreceptor Tyrosine-based Inhibitory Motif
KIR
Killer Ig-Like Receptor
LFA-1
Leukocyte Function-associated Antigen 1
mab
Monoclonal antibody
MCSFR
Macrophage Colony Stimulating Factor Receptor
MHC
Major Histocompatibility Complex
Abbreviations
MNC
Mononuclear cells
MSD
Muscle Specific Domain
NCCs
Nonspecific Cytotoxic Cells
NILT
Novel Immunoglobulin-Like Transcript
NITRs
Novel Immune Type Receptors
NK
Natural Killer
NKT
Natural Killer T cell
ORF
Open Reading Frame
PAMPs
Pathogen-Associated Molecular Patterns
PBS
Phosphate Buffered Saline
PHA
Phytohaemagglutinin
PLCγ
Phospholipase C gamma
PRR
Pattern Recognition Receptor
PSGL-1
P-selectin glycoprotein ligand 1
RAG
Recombination Activating Gene
SP
Signal Peptide
SVC
Spring Viraemia of Carp
Tc
T cytotoxic cells
TCR
T Cell Receptor
Th
T helper
Th1, Th2, Th17, Treg, Tfl
Subsets of Th: Th1, Th2, Th17, regulatory T, follicular T
TM
Transmembrane
TNF
Tumor Necrosis Factor
WGD
Whole Genome Duplication
V
Zusammenfassung
Zusammenfassung
Das Immunsystem aller Vertebraten ist verantwortlich dafür, die Homöostase des
Organismus, über die Eliminierung entarteter oder gealterter Körperzellen und durch den
Schutz vor Infektionen (Viren, Bakterien, Pilze, Parasiten) (Murphy et al., 2012) aufrecht zu
erhalten. Es ist ein komplex reguliertes Netzwerk angeborener und erworbener
Immunmechanismen bei denen humorale Faktoren und zelluläre Effektoren interagieren.
Diese Immunmechanismen basieren auf einer Unterscheidung zwischen “Eigen” und
“Fremd” Strukturen. Pathogene oder veränderte Körperzellen werden darüber von
verschiedenen Rezeptorkomplexen auf Immunzellen erkannt. Muster erkennende Rezeptoren
(pattern recognition receptors, PRR) binden dabei an evolutionär konservierte Strukturen auf
Pathogenen
(pathogen
associated
molecular
patterns,
PAMP)
oder
mit
einer
Gewebszerstörung verbundenen Zellmarker (danger associated molecular patterns, DAMP)
(Takeuchi and Akira 2010). Fehlende MHC I Moleküle (major histocompatibility class I)
werden von Rezeptoren auf natürlichen Killerzellen erkannt (Fischer, Koppang and Nakanishi
2013, Raulet 2006). Fremdpeptide werden in eigenen MHC I bzw. MHC II Molekülen an B
bzw. T-zellen präsentiert und von spezifischen Rezeptorkomplexen erkannt (BCR; TCR).
Diese Aktivierung führt zu einer Proliferation und Reifung der B- bzw. T-Lymphozyten bis
zu Effektorstadien
Einige zelluläre Rezeptoren sind auf allen Leukozyten permanent exprimiert (z.B.
MHC I), andere nur in bestimmten Reifungs- und Funktionsstadien bzw. auf bestimmten
Leukozytenpopulationen. (Monozyten, Granulozyten, NK-Zellen, Lymphozyten) (Murphy et
al., 2012). Basierend spezifischen monoklonalen Antikörpern, die spezifisch solche Moleküle
binden wurde für verschiedene Säuger (Mensch, Maus, Ratte, Schwein, Rind, Hund) eine
System von Differenzierungsmarkern (Cluster of Differentiation Molecules, CD) auf
Leukozyten etabliert (Cobbold and Metcalfe 1994, Hopkins, Ross and Dutia 1993, Haverson
et al. 2001, Mason et al. 2001). Mit diesen mAk ist es nicht nur möglich Entwicklungs- und
Funktionsstadien einzelner Leukozytensubpopulationen zu bestimmen sondern auch die
Interaktion solcher Populationen zu untersuchen.
Für Knochenfisch existiert ein solches System nicht. Nur eine kleine Anzahl von mAk
gegen Leukozytenmarker ist bisher publiziert (Köllner et al. 2004, Köllner et al. 2001, Zhang
et al. 2010, Ramirez-Gomez et al. 2012, Wen et al. 2011, DeLuca, Wilson and Warr 1983,
Toda et al. 2011, Toda et al. 2009, Takizawa et al. 2011a, Hetland et al. 2010, Araki et al.
2008). Die meisten von diesen mAk sind zudem strikt Spezies spezifisch.
VI
Zusammenfassung
Ziel der vorliegenden Arbeit war es daher, solche mAk spezifisch für TZellpopulationen der Regenbogenforelle (Oncorhynchus mykiss) zu entwickeln (Kapitel 2).
T-Lymphozyten sind durch die Expression eines T-Zell-Rezeptorkomplexes charakterisiert,
der
aus
verschiedenen
Ketten
des
(α α, δ β) und
dem
CD3
Molekül
mit
α, β, γ, δ, ε und ζ) Ketten gebildet wird. Zytotoxische T-Zellen binden an MHC I präsentierte
Fremdpeptide über diesen TCR Komplex und dem Ko-Rezeptormolekül CD8. T-HelferZellen erkennen MHC II präsentierte Fremdpeptide über den TCR Komplex und dem KoRezeptor CD4.
In den letzten Jahren sind die Gene, die für solche Moleküle kodieren, bei
verschiedenen Fischarten kloniert und sequenziert worden. Spezifische mAk gegen diese
Moleküle z.B. im Goldfisch halfen deren Expression auf Leukozyten in morphologischem
und funktionellen Kontext zu charakterisieren Mak spezifisch für den TCR Komplex konnten
bisher nicht etabliert werden. Mit den in dieser Arbeit charakterisierten anti-pan-T-Zell mAk
konnte die Organverteilung sowie die Aktivierung von T-Zellen in der Regenbogenforelle
erstmalig beschrieben werden (Kapitel 2). Darüber hinaus wurde eine Methode etabliert, bei
der durch Kombination verschiedener mAk spezifisch für Differenzierungsmarker die
Verteilung und Reaktionskinetik von Leukozytensubpopulationen untersucht werden kann
(Kapitel 3).
Die erste Verteidigungslinie gegen Pathogene wird durch die evolutionär alten
Monozyten und NK-Zellen gebildet. Diese angeborenen Immunmechanismen sind hoch
entwickelt in Knochenfischen. Zwei Subpopulationen von NK-Zellen wurden in Fischen
bisher beschrieben: natürliche zytotoxische Zellen und NK-Zellen (Shen et al. 2002, Shen et
al. 2003, Shen et al. 2004, Fischer et al. 2013). Funktionstest zur Charakterisierung von
angeborenen und erworbenen zellulären Immunmechanismen sind bisher nur in wenigen
Fischarten etabliert worden, ohne das jedoch spezifische mAk vorhanden sind, um diese
Zellen direkt zu messen. Daher wurde hier das ein NK-Zelle Marker CD56 molekular
charakterisiert und die Expression auf verschiedenen Leukozytenpopulationen untersucht
(Kapitel 4).
Die hier etablierten mAk sowie die Funktionstest erlauben zukünftig eine detaillierte
Untersuchung
angeborener
und
erworbener
zellulärer
Immunmechnismen
in
der
Regebogenforelle.
VII
Summary
Summary
The immune system of all vertebrates primarily is responsible to maintain the
organism's homeostasis by either eliminating neoplastic or altered body cells and to protect
against foreign invaders (viruses, bacteria, fungi, parasites) (Murphy 2012). It is a highly
regulated network of innate and adaptive mechanisms between humoral factors and
leukocytes.
The successful elimination or protection is crucially based on differentiation of self
from non-self. Pathogens and altered body cells are recognized by different receptor
complexes on immune cells. Expressed pathogen- or danger-associated molecular patterns
(PAMPs or DAMPs, respectively) are bound by pattern recognition receptors (PRR)
(Takeuchi and Akira 2010). Missing major histocompatibility (MHC) class I molecules or
non-self (e.g. allogeneic or xenogeneic cells) MHC are recognized by natural killer cell
receptors (Fischer, Koppang and Nakanishi 2013, Raulet 2006). Foreign non-self peptides are
presented through MHC class I (intracellular) or through MHC class II (extracellular) to Bcell or T cell receptor complexes.
This initial activation is regulated by humoral factors or cellular interactions (receptorligand interactions) resulting in the activation, proliferation and effector function within an
immune response. Some of the cellular receptors are permanently expressed on all leukocytes
on a high level (MHC class I), whereas others only are expressed during certain
developmental or activation stages or on certain leukocyte populations (monocytes,
granulocytes, NK cells, lymphocytes) (Murphy 2012, Biosciences 2010).
For different mammals (man, mouse, rat, but also swine, cattle, dog), a system of
characterized leukocyte surface molecules primarily based on the recognition of these
molecules by specific monoclonal antibodies (mabs) was summarized at international
workshops as clusters of differentiation (CD) (Cobbold and Metcalfe 1994, Hopkins, Ross
and Dutia 1993, Haverson et al. 2001, Mason et al. 2001). Using these mabs, it is not only
possible to characterize the developmental and functional stage of different leukocyte
subpopulations but also to define the interactions between these populations.
For bony fish, such a system does not exist. Only a limited number of mabs against
leukocyte surface molecules is available and most of them are strongly specific for species
(Köllner et al. 2004, Köllner et al. 2001, Zhang et al. 2010, Ramirez-Gomez et al. 2012, Wen
VIII
Summary
et al. 2011, DeLuca, Wilson and Warr 1983, Toda et al. 2011, Toda et al. 2009, Takizawa et
al. 2011a, Hetland et al. 2010, Araki et al. 2008).
The goal of this PhD work, therefore, was to develop monoclonal antibodies against
surface markers of rainbow trout (Oncorhynchus mykiss) T cell population (chapter 2). The
lymphocytes are characterized by the expression of a T cell receptor complex composed of
TCR chains (α and β) and CD3 chains (α, β, γ, δ, ε and ζ). Cytotoxic T lymphocytes (CTLs)
binds to MHC class I bound peptide on the infected host cell using their T cell receptor (TCR)
and its co-receptor CD8 resulting in specific killing. Th cells recognize peptides through their
T cell receptor (TCR) and their co-receptor CD4 after extracellular antigens uptake,
processing and presentation via MHC class II by professional antigen presenting cells
(macrophages, dendritic cells and B cells). During recent years, genes encoding MHC class I
and II, TCR and their co-receptors CD8 and CD4 have been cloned in several fish species and
antibodies have been developed to study protein expression in morphological and functional
contexts. However, mabs specific for TCR or CD3 have not been established yet. Therefore,
using pan-T cell marker specific mabs, the activation and kinetics of T cell subpopulation
should be investigated (chapter 2). Moreover, a flow cytometry method was established
using different lineage marker specific mabs to measure different leukocyte populations and
their involvement in immune mechanisms of trout using a single tube assay (chapter 3).
The first line of defense against altered body cells or pathogens is provided by
evolutionarily ancient macrophages and natural killer (NK) cells. These innate mechanisms
are well developed in bony fish. Two types of NK cell homologues have been described in
fish: non-specific cytotoxic cells and NK-like cells (Shen et al. 2002, Shen et al. 2003, Shen et
al. 2004, Fischer et al. 2013). Functional assays for innate and adaptive lymphocyte responses
have been developed in only a few fish species. However, there are no tools available until
now in trout to follow these cells directly in the immune response. The molecular
characteristics and the expression on leukocyte subpopulations of CD56 were therefore
analyzed. Furthermore, a mab that is specific for a molecule expressed only in NK cells but
with uncommon expression kinetics was established (chapter 4).
Overall, the established tools and methods allow a more detailed characterization of
cellular immune mechanisms against intracellular pathogens in rainbow trout.
IX
Chapter 1. General introduction
Chapter 1.
1.1.
General introduction
Aquaculture
The importance of fish for human nutrition in the light of environmental protection is
mentioned in 2014 by the general Director of the Food and Agricultural Organization José
Graziano da Silva: “In a world where more than 800 million continue to suffer from chronic
malnourishment and where the global population is expected to grow by another 2 billion to
reach 9.6 billion people by 2050 – with a concentration in coastal urban areas – we must
meet the huge challenge of feeding our planet while safeguarding its natural resources for
future generations” (FAO 2014c). This fact “(...) highlights the significant role that fisheries
and aquaculture play in eliminating hunger, promoting health and reducing poverty. Never
before have people consumed so much fish or depended so greatly on the sector for their
well-being. Fish is extremely nutritious – considered a vital source of protein and essential
nutrients, especially for many poor members of our global community. Fisheries and
aquaculture are a source not just of health but also of wealth.” (Lloyd, Horrocks and Yeo
1999, Marineharvest 2014, Dimitroglou et al. 2011). Recently, aquaculture is considered the
fastest growing animal-food producing sector, which accounted for close to half of total fish
production (FAO 2014c), supplying 66,6 million tons of fish in 2012 (FAO 2014c)
The sector is currently dominated by Asia-Pacific region, with predominant role of
China, which accounted for 65% of global production in 2012, while the production in
Europe and North America substantially slowed. Dominating position of Asia in world
aquaculture also influences the composition of produced species, dominated by freshwater
fish (37 million tons) such as carp, followed by crustaceans (2,5 million tons). Diadromous,
molluscs and marine fishes accounted together for 1,5 million tons (Korytar 2012, FAO
2014b).
1.2.
Aquaculture production of rainbow trout
Rainbow trout is native to cold water tributaries of the pacific Ocean in Asia and
North America (Wikipedia 2015, Council 2000). Rainbow trout is one of the most popular
and easily reared aquaculture fish because it grows very fast and is a crowding tolerant fish,
1
Chapter 1. General introduction
making it well suited to captive breeding. Consequently, nearly all of rainbow trout
production is obtained from aquaculture (Burden 2014). Rainbow trout aquaculture
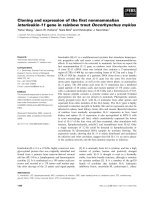
production increased very fast from 197 thousand tons in 1985 to 856 thousand tons (99,77%
total rainbow trout production) with value 3631 million USD in 2012, representing as one of
the third biggest produced diadromous fish after Atlantic Salmon and milkfish (Fig. 1) (FAO
2014b).
900
800
700
Thousand tons
600
500
400
300
200
100
10
20
11
20
12
09
20
06
20
03
20
00
20
97
20
94
19
91
19
88
19
85
19
82
19
79
19
76
19
19
19
73
0
Year
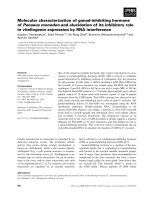
Figure 1
Global aquaculture production of rainbow trout from 1973-2012 (FAO 2014b)
The production of rainbow trout has grown exponentially since the 1970s, especially
in Chile and more recently in Iran and Turkey. One-third of rainbow trout production comes
from Europe where it is dominated by Norway, Italy, Denmark and France (Fig. 2).
Figure 2
World leading countries in the aquaculture production of rainbow trout in 2012
(FAO 2014b)
2
Chapter 1. General introduction
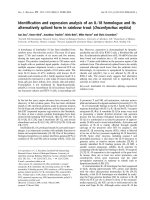
Germany belongs to top ten of main producer in Europe, producing 9394 tons of
rainbow trout in the value of 39 million USD 2012 (FAO 2014a).
Tons
!
Year
Figure 3
Production of main fishes in Germany (FAO 2014b)
In Germany, rainbow trout contributes around 60% of annual aquaculture production
and surpass common carp and other fish species (Fig. 3) (FAO 2014a).
1.3.
Taxonomy of rainbow trout
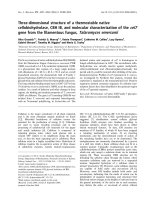
The rainbow trout (Oncorhynchus mykiss) belongs to Oncorhynchus genus, family
Salmonidae that also includes Atlantic salmon. Evolutionally, rainbow trout together with
Atlantic salmon belong to teleost group evolved early after the lobe and ray-finned fish
branches have split (Berthelot et al. 2014). One lobe-finned fish lineage evolved into
tetrapods and land animals while the ray-finned fish independently led to the teleost.
Interestingly, vertebrates appear to have experienced two round whole genome duplications
(WGD) early in their evolution and teleost fishes experienced a third round or fish-specific
WGD (Meyer and Van de Peer 2005). In addition, salmon family including rainbow trout has
undergone an additional and relatively recent WGD, termed Salmonid specific 4th WGD or
Ss4R (Fig. 4) (Berthelot et al. 2014). As a consequence of duplication events, rainbow trout
are polyploidy.
There are three main evolutionary advantages of polyploidy discussed: (1) heterosis
which causes polyploidy to be more vigorous than their diploid progenitors; (2) gene
redundancy which provides raw materials for mutation, diversity, innovation and the origin
3
Chapter 1. General introduction
of novel gene functions; (3) Asexual reproduction enabling polyploids to reproduce in the
absence of sexual mates (Comai 2005). The genomic complexity of particular rainbow trout
or teleost suggests that it might be the reason for their evolutionary success and astounding
biological diversity (Meyer and Van de Peer 2005).
Fish model for my thesis
!
Figure 4
The evolutionary position of rainbow trout (Berthelot et al. 2014)
The red stars show the position of the teleost-specific (Ts3R) and the Salmonid specific (Ss4R)
WGDs. The groups of species with available genomic sequence are shown in red bold type (Berthelot
et al. 2014).
1.4.
Problems in modern aquaculture production
Although aquaculture represents attractive alternative to the capture fishery, a number
of disadvantages are connected to the production of fish in aquaculture:
- Increased negative impact on environment,
- Increased stress to the animals, and
4
Chapter 1. General introduction
- Increased risk of epidemics by infectious microorganisms (The Scottish Association
for Marine Science and Napier University 2002, Naylor et al. 2000, Silva et al. 2009).
Due to the fact that fish is in modern aquacultures kept in densities more than 1000
times higher than under natural conditions, it is not surprising that this is leading to increased
stress and disease susceptibility (Pulkkinen et al. 2010). Subsequently, cultured trout is prone
to many disease causing organisms including bacteria, parasites, viruses and fungi which
account for high economic losses (O’Neill 2006). These economical risks lead to treatments
to protect fish in aquaculture.
1.4.1. Antibiotic treatment
Treatment of infected fish with antibiotics represents the first option in the fight
against bacterial diseases. The first fish disease treated with modern drugs such as
sulfonamides and nitrofurans was furunculosis, caused by Aeromonas salmonicida (Gutsell
and S. 1948). During the 1980s, salmon farming in Norway experienced huge losses due to
bacterial diseases (mostly Vibrio spp.) and a total crash in the industry was only prevented by
the use of vast amount of antibiotics (Sommerset et al. 2005).
Nowadays, antibiotics are not only used to combat bacterial disease after outbreaks,
but also often used as a prophylaxis in fish feed and occasionally in bath and injections
(Markestad and Grave 1997, Cabello 2006). However, the extensive use of antibiotic
represents severe threat to the fish, environment and consumer. A number of studies
indicated that antimicrobial treatment changed the composition of bacteria in the aquatic
environment surrounding aquaculture and increased number of antibiotic resistant bacteria
(Miranda and Zemelman 2002b, Hektoen et al. 1995, Miranda and Zemelman 2002a, Cabello
2006).
The beneficial effects of antibiotic treatment on fish survival in aquaculture is
counteracted by concern that chemicals, antibiotics and pollutants can drastically affect the
composition of intestinal microbiota and may lead to the elimination of individual species
from the whole microbial community (Nayak and Sukanta 2010, Sugita et al. 1988, Austin
and Alzahrani 1988). Although the use of antibiotic may reduce the mortality during
outbreaks, its negative impacts on fish and consumers health resulted in the EU moratorium
5
Chapter 1. General introduction
on the banning of antibiotic growth promoters in animal feeds (European Commission 2008)
which promoted search for new strategies in aquaculture.
1.4.2. Increasing survival of fish caused by probiotic treatment
One current strategy aims to eliminate the chances of pathogenic bacteria to colonize
and penetrate intestine by supporting proper composition of microbiota. Fish intestine
harbors more than 108 bacteria per gram and is dominated by the genera Acinetobacter,
Aeromonas, Flavobacterium, Lactococcus, Pseudomonas, Bacteroides, Clostridium and
Fusobacterium (Austin 2002, Perez et al. 2010, Nayak and Sukanta 2010). As shown by
gnotobiotic zebrafish, the role of intestine microbiota in the host development is evolutionary
conserved. The ‘probiotic microflora’ seems to positively influence on the organism welfare
by education of the immune system, to improve the integrity of intestinal mucosal barrier and
to play a key role in extracting and processing of nutrients (Rawls, Samuel and Gordon
2004). This positive effect is also based on the competition of microbiota with pathogens for
specific receptors on mucosal surfaces and production of antimicrobial substances that
restrict growth of pathogens (Bernet-Camard et al. 1997, Coconnier et al. 1992, Balcazar et
al. 2007). Feeding with Carnobacterium augments the immune response upon challenge with
Aeromonas salmonicida and Yersinia ruckeri, increasing phagocytic activity, respiratory
burst and lysozyme activity (Kim and Austin 2006). Trout fed with three freeze-dried
bacteria (Lactobacillus ramnosus, Enterococcus faecium and Bacillus subtilis) exhibits the
enhanced production of superoxide anion and activity of the alternative complement pathway
(Panigrahi et al. 2007). Since any negative change of the bacterial composition might have
drastic effects on fish immune system, current research focuses on probiotic additives to fish
feed to positively manipulate the microbial populations (Merrifield et al. 2010). Importance
of microbiota and probiotic feeding was also evaluated by in vivo trials with fry or
fingerlings, where the feeding with viable Carnobacteirum, Bacillus sp. and Aeromonas
sorbia and even with formaldehyde inactivated Vibrio fluvialis, Aeromonas hydrophila and
Carnobacterium spp reduced mortality after challenge with Aeromonas salmonicida
(Robertson et al. 2000, Brunt, Newaj-Fyzul and Austin 2007, Irianto and Austin 2003).
However, a routine use of probiotic treatment in aquaculture still has to overcome problems
with the selection of appropriate probiotics, delivery method and assessment of dosage and
duration of application (Merrifield et al. 2010).
6
Chapter 1. General introduction
1.4.3. Vaccination
Vaccination is still considered the most effective method in large-scale commercial
fish farming to control pathogenic bacteria, as well as viruses. Vaccination has been a key
reason for the success of salmon cultivation. In addition to salmon and trout, commercial
vaccines are available for channel catfish, European seabass and seabream, Japanese
amberjack and yellowtail, tilapia and Atlantic cod (Sommerset et al. 2005).
Mostly empirically developed vaccines against bacterial diseases were based on
inactivated bacterial pathogens. The first formulation of protective vaccine was published
more than 70 years ago (Duff 1942). Fish immersion vaccines based on formalin-inactivated
bacterial cultures had proven to be effective against Vibriosis in the USA in the 1970s
(Evelyn 1997, Sommerset et al. 2005). Similar vaccines were developed in Norway against
Vibriosis diseases in salmon and efficacy of these vaccines resulted in a declined use of
antibiotics. However, an immersion vaccine proved ineffective against furunculosis caused
by Aeromonas salmonicida in the early 1990s in Norway. Therefore a number injection
vaccines were developed (Lillehaug, Lunder and Poppe 1992, Johnson and Amend 1984).
The combination of intraperitoneal injection with a good antigen preparation and oil adjuvant
resulted in dramatic decline of antibiotic treatment and in increase of produced salmon (Fig.
5). The intraperitoneally delivered vaccines are still providing the best protection against a
number of pathogens (Toranzo et al. 2009).
Recently, polyvalent vaccines protecting
simultaneously against the majority of bacterial pathogens dominate the commercial market
with fish vaccines
7