DO DO BIEN DANG NHO CUA TRUC
Bạn đang xem bản rút gọn của tài liệu. Xem và tải ngay bản đầy đủ của tài liệu tại đây (673.62 KB, 21 trang )
See discussions, stats, and author profiles for this publication at: />
Axial and Lateral Small Strain Measurement of Soils in Compression Test
using Local Deformation Transducer
Article in Journal of Engineering and Technological Sciences · March 2018
DOI: 10.5614/j.eng.technol.sci.2018.50.1.4
CITATION
READS
1
690
4 authors, including:
Hasbullah Nawir
Khairurrijal Khairurrijal
Bandung Institute of Technology
Bandung Institute of Technology
15 PUBLICATIONS 74 CITATIONS
372 PUBLICATIONS 1,223 CITATIONS
SEE PROFILE
Some of the authors of this publication are also working on these related projects:
Garlic extract View project
Developing TiO2 based Solar Cells View project
All content following this page was uploaded by Khairurrijal Khairurrijal on 13 July 2018.
The user has requested enhancement of the downloaded file.
SEE PROFILE
J. Eng. Technol. Sci., Vol. 50, No. 1, 2018, 53-72
53
Axial and Lateral Small Strain Measurement of Soils in
Compression Test using Local Deformation Transducer
Hasbullah Nawir1,2,*, Dayu Apoji2, Riska Ekawita3 & Khairurrijal Khairurrijal4
1
Geotechnical Engineering Research Group, Faculty of Civil and Environmental
Engineering, Institut Teknologi Bandung, Jalan Ganesha No. 10,
Bandung 40132, West Java, Indonesia
2
Soil Mechanics Laboratory, Faculty of Civil and Environmental Engineering, Institut
Teknologi Bandung, Jalan Ganesha No. 10, Bandung 40132, West Java Indonesia
3
Faculty of Mathematics and Natural Sciences, University of Bengkulu,
Jalan W.R Supratman, Bengkulu, 38371,Indonesia
4
Department of Physics, Faculty of Mathematics and Natural Sciences, Institut
Teknologi Bandung, Jalan Ganesha No. 10, Bandung 40132, West Java, Indonesia
*E-mail:
Abstract. This paper presents the development of a method using local
deformation transducers (LDTs) to locally and sensitively measure small axial
and lateral strains in soil in a compression test. A local strain measurement
system comprising of axial and lateral LDTs was developed referring to the
original LDT system and the cantilever LDT system, respectively. The LDTs
were calibrated both in air and under water. Their insensitivity to pressurized
water was confirmed. The calibration factors for the axial and lateral LDTs were
found to be 1.695 mm/volt and 1.001 mm/volt, respectively. The performance in
terms of repeatability and stability of the LDT system was evaluated. The
repeatability test showed that the average standard deviation of the lateral LDT
was 0.015 volt, while the stability test showed that the average standard error of
the axial and lateral LDT were 3.13 × 10⁻⁵ volt and 2.65 × 10⁻⁵ volt, respectively.
Unconfined compression tests were conducted on three reconstituted clay
samples to examine the proposed axial and lateral LDT system. The stress-strain
relationship indicates a nonlinear relationship between the axial and lateral strain
of soil instead of the conventionally assumed constant relationship. The results
demonstrate this nonlinear behavior even at small strain levels, which were
successfully measured using a domestically built axial and lateral LDT system.
Keywords: axial strain; lateral strain; local deformation transducer; nonlinear
behavior; small strain measurement; unconfined compression test.
1
Introduction
It has been reported that external strain measurements of soil specimen
deformation (i.e. measurements of axial deformation of the specimen outside
the triaxial cell or at the specimen cap) may seriously underestimate the true
stiffness for various types of stiff soils [1] and soft rocks [2]. This error can
Received April 18th, 2017, 1st Revision November 2nd, 2017, 2nd Revision December 27th, 2017, Accepted for
publication February 28th, 2018.
Copyright ©2018 Published by ITB Journal Publisher, ISSN: 2337-5779, DOI: 10.5614/j.eng.technol.sci.2018.50.1.4
54
Hasbullah Nawir, et al.
occur because of: (i) system compliance (e.g. deflection of cell pressure, top
cap, loading piston, etc.); (ii) tilting of the specimen; (iii) bedding errors at the
top and bottom of the specimen; and (iv) strain non-uniformity of the specimen,
including shear bending [3]. Local strain measurement by direct contact
between the strain gauge and the soil specimen, unlike external strain
measurement, can produce a more reliable result.
Several devices that locally and sensitively measure strain in a triaxial test have
been developed in the last three decades to understand the small-strain behavior
of soil. Up to now, several types of local strain gauges have been developed,
including: (i) electrolytic level gauge [4]; (ii) Hall effect semiconductor [5,6]:
(iii) proximity transducer [7]; (iv) local deformation transducer (LDT) [3,8];
and (v) linear variable differential transformer (LVDT) [9,10]. Other methods,
such as image processing, have also been developed [11,12]. A comprehensive
review of local deformation measurement systems for triaxial tests has been
reported by Yimsiri and Soga [13].
The selection of a local deformation measurement system is often made based
on cost effectiveness. Among the available systems, LDT is considered to be
one of the most low-cost devices [8]. The original LDT system was developed
by Goto, et al. [3] based on the theory of elasticity for hinged thin columns
subject to axial force. Subsequently, Yimsiri, et al. [8] modified it to a
cantilever-type LDT system, where the transducer behaves as a cantilever beam
and the deflection at its free end is measured by the output from the strain
gauges attached near the fixed end. The local axial strain is obtained from the
relative movements of two cantilever LDTs. Although the cantilever type LDT
has lower sensitivity, it has several advantages compared to the original LDT.
For instance: (i) it exhibits a linear calibration curve; (ii) it is capable of
releasing itself at large strains; and (iii) it has a larger working range [8].
Recently, a pin type LDT has been developed to comply with shear deformation
of hollow cylindrical specimens under torsional loading [14,15].
Despite the continuous development of LDT systems, most previous studies
focused on the measurement of the axial strain of the specimen [3,8,16]. It is
important to note that the deformation of a triaxial test specimen takes place not
only in its axial direction but also in its lateral direction. Consequently, local
sensitive measurement of both axial and lateral strain is required to accurately
evaluate the stress-strain behavior of triaxial test specimens and strain paths in
terms of volumetric and shear strain exhibited by the specimen. A cantilever
type local lateral strain gauge has been developed by Tatsuoka, et al. [17]. A
lateral LDT system has also been applied successfully on a large cubical
specimen [18-21]. Nevertheless, only a limited number of studies discuss this
type of deformation in cylindrical soil specimens [22].
Axial and Lateral Small Strain Measurement of Soils
55
Furthermore, although LDT has been developed and used widely by other
researchers globally, it has not been applied prevalently Indonesia, where only
few researches on the topic of experimental soil mechanics and small strain
measurement of soils have been conducted. Despite having a huge land area and
innumerable types of soils, only a limited number of studies have been
comprehensively performed to characterize these materials, especially their
small strain behaviors.
In this study, an LDT system was developed to locally measure axial and lateral
deformations of cylindrical soil specimens in unconfined compression tests. The
axial LDT was developed according to the original LDT [3], while the lateral
LDT was developed based on the cantilever type LDT [8,17]. The LDTs were
calibrated both in air and under water inside a triaxial cell. Their insensitivity to
pressurized water was confirmed. The proposed system was then validated by
repeatability and stability tests. Subsequently, unconfined compression tests
were conducted on three clay samples to evaluate the performance of the
proposed LDT system.
This study is part of a development program on experimental soil mechanics
that is currently being piloted at the Soil Mechanics Laboratory, Institut
Teknologi Bandung. The objectives of this study are: (i) to demonstrate the
development of a domestically built LDT system in Indonesia; (ii) to establish
an integrated axial and lateral measurement system for soil using LDTs; and
(iii) to validate the developed LDT system in ‘basic’ compression testing before
implementing it in more comprehensive soil testing in future experiments.
2
Theory of Axial and Lateral LDTs
2.1
Deformation of Axial LDT
An axial LDT is attached to the lateral face of the specimen and allowed to bend
according to the specimen’s axial deformation during the compression (or
shearing) stage. In this system, the measured strain (i.e. output voltage) of the
LDT is considered the axial strain of the specimen. The theoretical background
of the relationship between gauge strain and axial strain has been discussed by
Goto, et al. [3] and is briefly presented in this section.
As mentioned above, the concept of axial LDT is based on the theory of
elasticity for a hinged thin column subjected to axial force [3]. Figure 1 shows
an LDT strip with the axial direction arranged on the x axis and bent toward the
y axis.
56
Hasbullah Nawir, et al.
Figure 1 Deformation mode of axial LDT (taken from [3]).
The LDT’s length ( ) can be calculated from a definite integral of a region from
x = 0 to x = L. By defining the length of the deformed LDT as , the relative
deformation (∆) is given in Eq. (1) as follow:
∆=
− =
−
1+
(1)
Applying a polynomial series and assuming that the plate’s deformation is
= ∙
/ ), where is a coefficient, the relative deformation can be
further derived as in Eq. (2) below:
∆=
"
!
"
$%&'
#
()
*
+
=
!)
,"
(2)
This equation can also be stated in another form expressed in Eq. (3):
=
-∆. "
(3)
!
Using the general theory of the bending moment of a deflected plate,
), the bending moment at the original point of
0 = −12
/
can be
expressed as:
0 = 12 3
!
! 4
"
"
5
(4)
Eq. (4) can be substituted into the theoretical stress and bending moment
relationship, 6 = 07/22. In this case, the stress can be expressed in Eq. (5) as:
6 =
9:;39
(
<*
'=>
;
()4
*
5?
(5)
Axial and Lateral Small Strain Measurement of Soils
57
where 7 is plate thickness and 2 is moment of inertia.
Further, by substituting coefficient
expressed in Eq. (6) as:
6 =
:!
∆=
"A
∆
"
"
∙7∙
into this equation, the stress can be
! 4
"
(6)
Using Hook’s stress-strain relationship of @ = 6 /1 and substituting Equation
6 into this equation, the strain and deformation relationship can be determined
in Eq. (7) as follows:
!?)
@
(7)
Figure 2 shows the elastic bending of the LDT material in detail. The ABCD
plane denotes the region of the LDT that undergoes bending deformation.
Resistance-wire strain gauges should be located inside this region to measure
the deformation accurately. In bending deformation, the AC region and BD
region receive inversely proportional forces. For example, the BD region is
stretched when the AC region is contracted. The sum of all moments acting on
the plane is referred to as the bending moment. In this study, a resistance wire
strain gauge was fixed inside the AC region.
Figure 2 Elastic bending of LDT material.
2.2
Deformation of Lateral LDT
Figure 3 shows the deformation mode of the lateral LDT. One tip of the LDT
strip is fixed to a cantilever beam and the other tip is allowed to move following
the lateral displacement of the specimens. The strip deformation is assumed to
be taking place only in this lateral displacement ( ). The axial deformation of
the LDT strip is envisaged to be insignificant and thus can be neglected. Using
the same stress and bending moment theory as in the previous case, the
relationship between lateral strain ( @B ) and lateral deformation is given in Eq.
(8) as follow:
=−
CD
E?
(8)
58
Hasbullah Nawir, et al.
Figure 3 Deformation mode of the lateral LDT.
3
Setup
3.1
LDT Device
An LDT device is composed of a thin rectangular strip of linear elastic material
with resistance-wire strain gauges attached to its sides. Commonly, the material
is selected to comply with the type of the proposed resistance-wire strain gauge.
In this study, the LDTs were made of thin rectangular strip of copper beryllium
(CuBe) with modulus elasticity equal to 131 kN/mm2. The lengths of the axial
and the lateral LDT strips were 50 mm and 35 mm, respectively. Width and
thickness of both axial and lateral LDT strips were 50 mm and 0.2 mm,
respectively. These dimensions were selected to comply with the dimensions of
the clay specimens used in the compression test (i.e. 38.1 mm diameter and 76.2
mm height). The dimensions of the LDT could be varied depending on the size
and shape of the specimens.
Unlike in the previous study, only a single resistance-wire strain gauge was
attached to each LDT strip. This approach was considered to simplify the LDT
design and further reduce the cost. The resistance-wire strain gauge used in this
study was KFG-5-120-C1-16L1M2R (Kyowa Electronic Instruments Co. Ltd.,
Japan) with a gauge factor of 2.1 Ω and a gauge resistance of 119.6±0.4 Ω. For
the axial LDT, the single resistance-wire strain gauge was attached to the center
of the LDT strip. For the lateral LDT, the single resistance-wire strain gauge
was attached at 5 mm from the edge of each of the four LDT strips. CC-33A
adhesive and a waterproof seal (Kyowa Electronic Instruments Co. Ltd.) were
used to bond the resistance-wire strain gauge to the LDT strip.
Axial and Lateral Small Strain Measurement of Soils
3.2
59
Compression Test Apparatus and LDT System
Unconfined compression tests were performed in this study to examine the axial
and lateral deformation measurement of soil specimens using the proposed LDT
system. The unconfined compression tests were carried out using a triaxial test
apparatus (ELE International Ltd.). The compression test was performed under
confined conditions as the basic compression conditions in [23,24] before the
proposed system was further subjected to a more multifaceted test under the
triaxial conditions in the subsequent study [25]. To measure the deformation of
the specimen in the axial and lateral directions during shearing, the specimen
was instrumented with a single axial LDT and four lateral LDTs, as shown in
the schematic illustration in Figure 4.
Figure 4 Schematic illustration of the axial and lateral LDT setup in the triaxial
test (taken from [14]).
Following the original LDT setup described by Goto, et al. [3], an axial LDT
was attached to the membrane in the longitudinal direction of the specimen. A
single axial LDT was considered sufficient for this test since no significant
eccentricity in the axial loading system was observed from a previous
compression test using a rubber dummy specimen [27]. In that study, three axial
LDTs attached to the dummy specimen produced comparable measurements. It
60
Hasbullah Nawir, et al.
would be more recommended to use a pair of axial LDTs arranged at the
opposite ends of the specimen diameter to compensate for errors due to
inevitable inclination of the specimen axis upon axial loading. In this study,
however, only a single axial LDT was used due to limited available space. The
use of a pair of axial LDTs in a compression test will be performed after
acceptable performance of the single axial LDT has been confirmed.
As shown in Figure 5, the lateral LDT strip was fastened between a rectangular
metal piece and a cantilever metal beam of 80 mm height, 10 mm width, and 3
mm thickness to secure the LDT’s position. The bottom of each cantilever beam
was attached to the top of an aluminum cylinder of 50 mm height, 80 mm
diameter, and 10 mm thickness.
Figure 5 Arrangement of the lateral LDT.
3.3
Electronical System
The electronical system is one of the key elements in LDT-based small strain
measurement [28]. In this study, each of the developed LDTs was connected to
a Wheatstone bridge system, as shown in Figure 6. The Wheatstone bridge
system comprised of an LDT device, two resistors of 120 Ω and a variable
resistor. The system was powered by a 3.3-volt VCC from a LM3940 regulator
that was used to stabilize the VCC voltage. This Wheatstone bridge enabled the
strain measurement by converting the resistance alteration due to LDT strip
deformation to an output voltage. To avoid influence of ambient temperature
Axial and Lateral Small Strain Measurement of Soils
61
changes on the system and its output, the laboratory temperature was kept
constant at 25 C during the experiment.
An IC multiplexer 4051 was assembled to the Wheatstone bridge to read the
system’s voltage. Subsequently, the voltage readings were amplified using an
AD620 instrument amplifier (Figure 7). This amplifier is a closed-loop
amplifier comprised of several operational amplifiers. In this system, the input
differential and the amplification magnitude can be adjusted based on the value
of external resistor R2. Following the signal amplification, a 16 bits A/D
converter of ADS8509 (Texas Instruments Inc.) with an input voltage of 0-3.3
volt was used to convert the analog readings to digital signals. The resolution of
the logging system was 5 × 10⁻⁵ volt. The digital signals were then forwarded to
a microcontroller that was connected to a computer. The data acquisition was
carried out by processing the data in the microcontroller using a computer
program.
Figure 6 Wheatstone bridge arrangement.
Figure 7 Schematic diagram of instrument amplifier AD620.
62
4
Hasbullah Nawir, et al.
Calibration
Calibration of the LDTs was performed to determine the relationship between
the LDT deformation and the corresponding produced signal. In this calibration,
the LDTs were forced to deform over a particular distance (in mm). At a
specified distance increment, the signal (i.e. output voltage) as a response to the
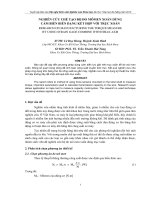
deformation was measured. Figure 8 shows the calibration result of the lateral
LDTs (A, B, C, D) and the axial LDT (E). As can be seen in this figure, the
axial LDT produced a nonlinear relationship between the deformation and the
output voltage. Having a system similar to the original LDT, this result
complies to the calibration curve produced by Goto, et al. [3]. In contrast,
essentially linear curves were produced by the lateral LDTs up to the considered
working range of 3 mm. These results are in accordance with the calibration
curve of the cantilever-LDT produced by Yimsiri, et al. [8]. These results are
reasonable since the deformation mechanisms of the lateral LDT were similar to
those of the cantilever LDT (free movement only at one end of the LDT strip).
The calibration was performed both inside and outside the water to evaluate the
sensitivity of the LDT performance toward the cell water in the triaxial cell. In
this study it was observed that the average voltage response differences
produced by the LDT calibration inside and outside the water were about 0.022
volt (for the axial LDT) and 0.021 volt (for the lateral LDT). It was determined
that the average secant calibration factor for the axial LDT for a range of
deformation between 0 to 1.0 mm was 1.695 mm/volt (voltage change of 0.59
volt for every 1 mm LDT deformation). Note that the non-linear function fitted
to the relation shown in Figure 9 was used to obtain the axial deformation for
each output voltage from the axial LDT.
1.0
LDT A
LDT B
LDT C
LDT D
LDT E
0.9
0.8
Voltage (Volt)
0.7
0.6
0.5
0.4
0.3
0.2
0.1
0.0
0.0
0.5
1.0
1.5
2.0
2.5
3.0
3.5
4.0
Deformation (mm)
Figure 8 Relationship between LDT deformation (mm) and voltage (V) of the
lateral LDTs (A, B, C, D) and the axial LDT (E).
Axial and Lateral Small Strain Measurement of Soils
63
It was also determined that the calibration factor for the lateral LDTs was 10.01
mm/volt (voltage change of 0.0999 volt for every 1 mm LDT deformation). The
data obtained from the calibration were then processed to produce their
deformation-related resistance value. The relationship between LDT
deformation (mm) and resistance change of the resistance-wire strain gauge (Ω)
is shown in Figure 9. A linear relationship was produced with all the lateral
LDTs, while the relationship was noticeably non-linear with the axial LDT. It
can be observed that this relationship was inversely proportional, where a
greater deformation of the LDT resulted in a smaller resistance of the strain
gauge. This result has been highlighted in a previous study by Ekawita, et al.
[26].
Strain Gauge Resistance (Ohm)
119.8
119.6
119.4
119.2
LDT A
LDT B
LDT C
LDT D
LDT E
119.0
118.8
0.0
0.5
1.0
1.5
2.0
2.5
3.0
3.5
4.0
Deformation (mm)
Figure 9 Relationship between LDT deformation (mm) and resistance changes
of the strain gauge (Ω) of the lateral LDTs (A, B, C, D) and the axial LDT (E).
5
Repeatability and Stability Tests
Repeatability tests were carried out to evaluate the elasticity performance of the
LDTs. This test was required to ensure that the material used as the LDT strip
would remain elastic even after it had been deformed many times. In this test,
the LDT was forced to deform up to 2.5 mm in 150 second. The force was then
reduced at an equivalent time rate until the LDT deformed back to its initial
condition. This process was carried out in three repetitions. The repeatability
test produced relatively similar relationships between the deformation and the
voltage in all repetitions. The average standard deviation against a maximum
variation of about 0.2 volt for a maximum deformation of 2.5 mm for LDTs A
to D was 0.014 volt, 0.011 volt, 0.023 volt, and 0.013 volt, respectively.
64
Hasbullah Nawir, et al.
Stability tests were carried out to evaluate the standard error of the LDT system,
in which the signal output of the LDT at a fixed position was recorded
repetitively (34000 data) for 10 hours. The error produced by this measurement
was then evaluated. The standard error is defined as the accuracy of the average
value produced by the measurement device. Based on this stability test, the
average standard error when the output was about 0.3 to 0.7 volt for LDT A to
D was 2.65 × 10⁻⁵ volt, 2.53 × 10⁻⁵ volt, 3.2 × 10⁻⁵ volt, 2.23 × 10⁻⁵ volt,
respectively. The average standard error of the axial LDT was 3.13 × 10⁻⁵ volt.
6
Compression Test Program
An unconfined compression test program was conducted to demonstrate the
performance of the developed LDT system in actual soil testing. The tests were
carried out on three reconstituted natural soil samples in Indonesia, which were
classified as clay with high plasticity under USCS. Dealing with natural soil,
having the same type of soil does not mean that the characteristics (i.e. soil
properties) of each of the sample are necessarily equivalent. The grain size test
results of the samples showed that the clay fraction was about 91 to 95% of the
samples. The specific gravity was 2.62 to 2.66, and the plasticity index was 18.1
to 26.8. The characteristics of the clay samples are not discussed further since
this paper focuses on the demonstration and evaluation of the LDT system.
Each of the samples was then prepared as a cylindrical specimen with a
diameter of 38.1 mm and a height of 76.2 mm (Figure 10).
Figure 10 Soil specimen instrumented with LDTs.
Axial and Lateral Small Strain Measurement of Soils
65
No saturation and consolidation processes were performed on the specimens in
this basic unconfined compression test. As a note, slight inaccuracies were
expected in the axial local strain measurements due to the absence of effective
confining pressure. Effective confining pressure is required to prevent slipping
between the inner face of the membrane and the outer surface of the specimen.
Undrained shearing was conducted to the unconfined specimens at a loading
rate of 0.05 mm/min. The axial and lateral deformations of the specimens were
measured over a fixed time increment during shearing. As previously
mentioned, this test program was designed to observe the performance of the
proposed LDT system under very basic compression conditions. The proposed
system will be applied to more comprehensive triaxial loadings in another test
program referring to the results of this study, as part of the triaxial test apparatus
development program at Soil Mechanics Laboratory, ITB, Indonesia.
7
Compression Test Results
7.1
Axial and Lateral Deformations
The axial and lateral deformations of the specimens are presented in Figure 11
and Figure 12, respectively. The vertical and horizontal axes of the graphs are
the deformation of the specimens in a particular direction and time in the
undrained stage, respectively. The time axis can be selected to substitute the
load (or stress) working on the specimens since the loading rate was kept
constant at 0.05 mm/min. The axial and lateral strains of the specimens were
derived from these deformation results, i.e. the change of specimen length
(contraction) over its initial length for axial strain, and the change of specimen
diameter (expansion) over its initial diameter for lateral strain. Considering the
repeatability test results, the maximum axial deformation applied in the soil
compression test was set to less than 2.5 mm in order to ensure the elasticity
performance of the LDTs.
As shown in Figure 11, the axial deformation of the specimens increased over
time due to the increase of the applied load. The results are in the form of
scattered data as the output of LDT measurement is a signal. The three
specimens exhibited a similar trend of axial deformation behavior, i.e. an
increase of deformation due to an increase of constant load over time. Data
scattering was relatively low, especially compared to the lateral deformation
data discussed above. The measurements show that the first sample may have
had uneven soil consistency. This presumption can be pointed out because an
erratic deformation pattern was exhibited during loading. On the other hand, the
second and the third sample displayed more consistent axial deformation
patterns, which could indicate their uniformity in soil consistency.
66
Hasbullah Nawir, et al.
Different trends can be observed in the lateral deformation pattern in Figure 12.
As can be seen in this figure, the lateral deformation of the third specimen
increased over time due to the increase of the applied load. However, the first
and the second specimen produced slightly different deformation patterns,
where the lateral deformation increased to a peak point at about 150 seconds
and slightly decreased after that point. This discrepancy may have occurred due
to system compliance. The recorded lateral deformation displayed more
scattered data than the recorded axial deformation, which is reasonable since (i)
more LDTs (i.e. 4) were used to record the lateral deformation measurement
(and consequently produced there is more data variation), and (ii) the system
boundary is less rigid in the lateral direction (accordingly producing less
uniform measurements).
The deformation of the specimens was measured over a time range of 5
minutes. The final readings, as presented in Table 1, were averaged. For
comparison, an external sensor system (i.e. linear displacement sensor) was also
installed on the cap of the specimens. The axial deformation of the specimens
measured by this external sensor system was recorded manually. As can be seen
in this table, the axial deformation based on the external sensor was always
higher than that based on the LDT. The difference of the measured axial
deformation for Specimen 1, Specimen 2, and Specimen 3 was about 18.8%,
16.3%, and 17.2%, respectively. Thus, on average, the external sensor measured
axial strains 17.4% higher than the LDT. As a note, Yimsiri, et al. [8] observed
that the discrepancies between local and external axial strains may range from
30% at very small strains to almost equivalent at larger strains. The
discrepancies of these results may have occurred due to the limitations of
indirect measurement [3,29].
Table 1 Summary of the Triaxial specimens’ deformation during the final
reading.
Triaxial test
specimens
Specimen 1
Specimen 2
Specimen 3
Axial deformation
(mm)
LDT
External
measurement
measurement
2.204
2.618
1.961
2.281
1.668
1.955
Lateral deformation
(mm)
LDT measurement
0.046
0.027
0.339
Axial and Lateral Small Strain Measurement of Soils
67
2.5
Specimen 1
Specimen 2
Specimen 3
Axial Deformation (mm)
2.0
1.5
1.0
0.5
0.0
0
50
100
150
200
250
300
Constant Load inTime (Second)
Figure 11 Axial deformation of the triaxial specimens based on the LDT
measurements.
Constant Load inTime (Second)
0
50
100
150
200
250
300
Lateral Deformation (mm)
0.0
-0.1
-0.2
-0.3
Specimen 1
Specimen 2
Specimen 3
-0.4
Figure 12 Lateral deformation of the triaxial specimens based on the LDT
measurements.
7.2
Axial and Lateral Strain Behaviors
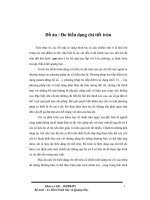
The deformation results of the first triaxial test specimen were further analyzed
to obtain its strain behavior. The relationship between the axial strain and the
lateral strain of the first specimen is presented in Figure 13. The analyzed
results were in the form of scattered data. The range of data scattering for the
68
Hasbullah Nawir, et al.
axial strain and the lateral strain was about 1% and 0.25%, respectively. The
data indicate a linear relationship between the axial strain and the lateral strain.
It can be observed that the produced lateral strain was smaller than the axial
strain at a ratio of about 0.4.
In axial compression tests, the axial deformation is in compression, thus the
axial strain is positive. On the other hand, the lateral deformation is tensile, thus
the lateral strain is negative. At the end of the measurement, the axial strain (εa)
was about to 2.3% and the lateral strain (εr) was about -1.0 %. This result shows
that the specimens exhibited close to zero volumetric strain (εvol = εa + 2εr), or
constant volume behavior, which is reasonable for nearly saturated clay in axial
compression.
Curve fitting lines (i.e. linear and polynomial) are presented here to elaborate
any exhibited relationship between axial and lateral strain. The linear curve can
be represented by the equation y = -0.39x, which is a sensible coefficient
considering the undrained shearing that was performed on the specimens. On
the other hand, it is interesting to see that the nonlinear curve, represented by a
polynomial equation of y = -0.66x2 + 0.15x, displayed a better R2 compare to
the linear curve (i.e. 0.97 to 0.94). Considering this result, it can be said that the
axial and lateral strain behavior of soils may exhibit a nonlinear association
instead of a conventional constant relationship, such as Poisson’s ratio.
Axial Strain, a (%)
0.0
0.00
0.5
1.0
1.5
2.0
2.5
Y = -0.39X
R2=0.94
Lateral Strain, r (%)
-0.25
-0.50
Y = -0.66X2 + 0.15X
-0.75
R2=0.97
-1.00
Figure 13 Relationship between axial strain and lateral strain.
Axial and Lateral Small Strain Measurement of Soils
7.3
69
Stress-Strain Relationship
Figure 14 presents the relationship between the shear strain and the shear stress
of the first specimen. The shear stress is defined as (1 – 3) / 2, where 1 and
3 are applied axial pressure and confining pressure, respectively. As previously
described, no confining pressure was applied in this test program (3 = 0). The
shear strain was defined as axial strain minus lateral strain (a – r). The
analyzed results are also presented in the form of scattered data. Unlike the data
presented in Figure 13, the range of scattering does not increase to a great extent
with straining throughout the curve. This is due to the fact that the curve
associates shear strength to a more regular shear stress value, while the previous
curve relates axial strain to highly erratic lateral strain data. Yet, the maximum
range of scattering occurred at small shear strains, where the range of scattering
in the measured shear strain and shear stress were about 0.25% and 80 kN/m2,
respectively.
Shear Stress, ( ) (kN/m2 )
800
600
400
Y = -20.94X2 + 327.74
R2= 0.996
Y = 285.65X
R2= 0.994
200
0
0.0
0.5
1.0
1.5
2.0
2.5
3.0
Shear Strain, ar(%)
Figure 14 Relationship between shear strain and shear stress.
Like in the previous section, curve fitting lines (i.e. linear and polynomial) are
also presented to elaborate the stress-strain behavior of soils. The linear curve
can be represented by y = 285.65x, while the nonlinear curve can be represented
by y = -20.94x2 + 327.74x. Neither peak of shear stress nor strain softening
behavior was observed in this axial range, which indicates that the specimen did
not reach its plastic yielding and was still in its pre-peak deformation phase.
Moreover, it can be observed that the nonlinear curve displays a better R2 value
compared to the linear curve, showing the nonlinear relationship between the
70
Hasbullah Nawir, et al.
shear strain and the shear stress of soil. This result confirms the previous studies
on soil nonlinearity (e.g. [30-32]) and further demonstrates the nonlinear
behavior soil exhibits even at small strain levels.
8
Conclusion
An LDT system to locally measure, respectively, axial and lateral strains of a
specimen in compression tests was successfully developed. An axial LDT was
developed according to the original LDT, while a lateral LDT was developed
with a concept similar to the cantilever LDT. Both LDTs were calibrated inside
and outside water to evaluate their sensitivity to water inside the triaxial cell.
The average difference of the voltage response produced by the LDT’s
calibration inside and outside the water was about 0.022 volt (for the axial LDT)
and 0.021 volt (for the lateral LDT). The calibration factor for the axial and
lateral LDTs was 1.695 mm/volt (voltage change of 0.59 volt for every 1 mm
LDT deformation) and 1.001 mm/volt (voltage change of 0.999 volt for every 1
mm LDT deformation), respectively. The LDT system was validated by
repeatability and stability tests. The repeatability test was carried out to evaluate
the elasticity (i.e. the reversibility of deformation) of the LDTs. Furthermore, a
stability test was carried out to evaluate the accuracy of the LDT system, which
was represented by a standard error value.
A test program was conducted on three reconstituted natural clay samples to
demonstrate the performance of the proposed LDT system under basic
compression conditions. Curve fitting lines (i.e. linear and polynomial) were
presented to elaborate the relationship between the axial and the lateral strain. A
nonlinear curve, represented by a polynomial equation of y = -0.66x2 + 0.15x,
displayed a better R2 compared to a linear curve (i.e. 0.97 to 0.94), which may
indicate the nonlinearity of the axial and lateral strain relationship of soil instead
of a conventional constant relationship, such as Poisson’s ratio. Furthermore,
the stress-strain relationship of the specimen was analyzed. Neither peak of
shear stress nor strain softening behavior was observed in this axial range,
which indicates that the specimen did not reach its plastic yielding. A nonlinear
relationship between shear strain and shear stress, represented by the
polynomial equation y = -20.94x2 + 327.74x, was exhibited in the results.
The results have confirmed and further demonstrated the nonlinear behavior that
soil exhibits even at small strain levels, which was successfully measured using
a domestically built axial and lateral LDT system. Future developments can be
for example to evaluate the long-term performance of the LDT in cyclic
loadings and to apply the system in more comprehensive and advanced soil
testing environments. Even though LDT development is globally ubiquitous,
Axial and Lateral Small Strain Measurement of Soils
71
this study is essential to provide a basic platform for the development of
experimental soil mechanics in Indonesia.
References
[1]
[2]
[3]
[4]
[5]
[6]
[7]
[8]
[9]
[10]
[11]
[12]
[13]
[14]
[15]
Jardine, R.J., Symes, M.J. & Burland, J.B., The Measurement of Soil
Stiffness in the Triaxial App., Géotechnique, 34(3), pp. 323-340, 1984.
Nakano, R., Shimazaki, F. & Shimizu, H., Anisotropic Mech. Prop. of
Diatomaceous Mudstone-with Special Reference to Tensile Young’s Mod.
and Mech. Prop. of Fault Clay of Tuffaceous Mudstone in Relation to
Tunnelung, Proc 7th Jpn. Symp. Rock Mech., pp. 67-72, 1987.
Goto, S., Tatsuoka, F., Shibuya, S., Kim, Y. & Sato, T., A Simple Gauge
for Local Small Strain Meas. in the Lab., SF, 31(1), pp. 169-180, 1991.
Burland, J.B. & Symes, M., A Simple Axial Displacement Gauge for use
in the Triaxial Apparatus, Géotechnique, 32(1), pp. 62-65, 1982.
Clayton, C.R.I., Khatrush, S.A., Bica, A.V.D. & Siddique, A., The Use of
Hall Effect Semiconductors, Geot. Instrument., 12(1), pp. 69-76, 1989.
Clayton, C.R.I. & Khatrush, S.A., A New Device for Measuring Local
Axial Strains on Triaxial Spec., Géotechnique, 36(4), pp. 593-597, 1986.
Hird, C.C. & Yung, P.C.Y., The Use of Proximity Transducers for Local
Strain Measurements in Triaxial Tests, 12(4), pp. 292-296, 1989.
Yimsiri, S., Soga, K. & Chandler, S.G., Cantilever-Type Local
Deformation Transducer for Local Axial Strain Measurement in Triaxial
Test, 28(5), pp. 1-7, 2005.
Cuccovillo, T. & Coop, M.R., The Measurement of Local Axial Strains in
Triaxial Tests using LVDTs, Géotechnique, 47(1), pp. 167-171, 1997.
Ibraim, E. & Benedetto, H.D., New Local System of Measurement of
Axial Strains for Triaxial Apparatus Using LVDT, Geotechnical Testing
Journal, 28(5), pp. 436-444, 2005.
Bagherieh, A.R., Habibagahi, G. & Ghahramani, A, A Novel Approach to
Measure the Volume Change of Triaxial Soil Samples based on Image
Processing, J. Appl. Sci., 8(13), pp. 2387-2395, 2008.
Ekawita, R., Widiatmoko, E., Nawir, H. & Susila, E., Color Image
Processing for Measuring Length Deformation in Compression Test,
Proc in 2nd International Conference on Instrumentation,
Communications, Information Tech., and Biomedical Eng., 2011.
Yimsiri, S. & Soga, K., A Review of Local Strain Measurement System
for Triaxial Testing of Soils, Geotech Engineering, 33, pp. 43-52, 2002.
Hongnam, N. & Koseki, J., Quasi-Elastic Def. Prop. of Toyoura Sand in
Cyclic Triaxial & Torsional Load., SF, 45(5), pp. 19-37, 2005.
Kiyota, T., Silva, L.I.N.D., Sato, T. & Koseki, J., Small Strain
Deformation Characteristics of Granular Materials in Torsional Shear
and Triaxial Tests with Local Deformation Measurements, Proc. Soil
72
[16]
[17]
[18]
[19]
[20]
[21]
[22]
[23]
[24]
[25]
[26]
[27]
[28]
[29]
[30]
[31]
[32]
View publication stats
Hasbullah Nawir, et al.
Stress-Strain Behavior: Measurement, Modeling and Analysis, Springer,
Dordrecht, pp. 557-566, 2007.
Nyunt, T.T., Leong, E.C. & Rahardjo, H., Strength and Small-Strain
Stiffness. Characteristic of Unsaturated Sand, Geot. Testing J., 34(5), pp.
1-11, 2011.
Tatsuoka, F., Teachavorasinskun, S., Dong, J., Kohata, Y. & Sato, T.,
Importance of Measuring Local Strains in Cyclic Triaxial Tests on
Granular Materials, Proc Dynamic Geotechnical Testing II, 1994.
Nawir, H., Viscous Effects on Yielding Characteristics of Sand in Triaxial
Compression, PhD Dissertation, University of Tokyo, 2002.
Nawir, H., Tatsuoka, F. & Kuwano, R., Effects of Viscous Prop. on The
Shear Yield. Charac. of Sand, Soil & Foundation, 43(6), pp. 33-50, 2003.
Nawir, H., Tatsuoka, F. & Kuwano, R., Experimental Evaluation of The
Viscous Properties of Sand in Shear, SF, 43(6), pp. 13-31, 2003.
Tatsuoka, F., Nawir, H. & Kuwano, R., A Modelling Procedure for Shear
Yielding Characteristics Affected by Viscous Properties of Sand in
Triaxial Compression, Soil & Foundation, 44(6), pp. 83-99, 2004.
Messerklinger, S. & Springman, S.M., Local Radial Displacement
Measurements of Soil Specimens in a Triaxial Test Apparatus Using
Laser Transducers, Geot. Testing Journal, 30(6), pp. 454-465, 2007.
Consoli, N.C., Rotta, G.V. & Prietto, P.D.M., Yielding Compressibility
Strength Relationship for An Artificially Cemented Soil Cured under
Stress, Géotechnique, 56(1), pp. 69-72, 2006.
Consoli, N.C., Foppa, D., Festugato, L. & Heineck, K.S., Key Parameters
for Strength Control of Artificially Cemented Soils, J. Geotech.
Geoenvironmental Eng., 133(2), pp. 197-205, 2007.
Lade, P.V., Triaxial Testing of Soils, John Wiley & Sons, 2016.
Ekawita, R., Munir, M.M., Nawir, H. & Suprijadi, A Comprehensive
Characterization of a Linear Deformation Sensor for Applications in
Triaxial Compression Tests, Proc in Computer, Control, Informatics and
Its Applications (IC3INA), pp. 191-194, 2013.
Ekawita, R., Development of Measurement System of Sample Dimension
on Triaxial Test (in Bahasa), Ph.D. Thesis, ITB, 2015.
Leong, E.C., Nyunt, T.T. & Low, K.S., Local Displacement Transducer
with Anderson Loop, ASTM Geot. Testing J., 34(6), pp. 676-684, 2011.
Kung, G.T.C., Equipment and Testing Procedures for Small Strain
Triaxial Tests, J. Chin. Inst. Eng., 30(4), pp. 579-591, 2007.
Viggiani, G. & Atkinson, J.H., Stiffness of Fine-Grained Soil at Very
Small Strains, Géotechnique, 45(2), pp. 249-265, 1995.
Atkinson, J.H., Non-linear Soil Stiffness in Routine Design,
Géotechnique, 50(5), pp. 487-508, 2000.
Clayton, C.R.I. & Heymann, G., Stiffness of Geomaterials at Very Small
Strains, Géotechnique, 51(3), pp. 245-255, 2001.