Optimization of machining parameters of turning operations based on multi performance criteria
Bạn đang xem bản rút gọn của tài liệu. Xem và tải ngay bản đầy đủ của tài liệu tại đây (226.82 KB, 10 trang )
International Journal of Industrial Engineering Computations 4 (2013) 51–60
Contents lists available at GrowingScience
International Journal of Industrial Engineering Computations
homepage: www.GrowingScience.com/ijiec
Optimization of machining parameters of turning operations based on multi performance
criteria
Abhijit Sahaa* and N.K.Mandalb*
a
M. Tech.Student, National Institute of Technical Teachers Training & Research, Kolkata 700106,India
Associate Professor, National Institute of Technical Teachers Training & Research, Kolkata, India
b
CHRONICLE
ABSTRACT
Article history:
Received August 20 2012
Received in revised format
November 18 2012
Accepted November 20 2012
Available online
21 November 2012
Keywords:
Turning
Power consumption
Surface roughness
Grey relational analysis
Frequency of tool vibration
The selection of optimum machining parameters plays a significant role to ensure quality of
product, to reduce the manufacturing cost and to increase productivity in computer controlled
manufacturing process. For many years, multi-objective optimization of turning based on
inherent complexity of process is a competitive engineering issue. This study investigates multiresponse optimization of turning process for an optimal parametric combination to yield the
minimum power consumption, surface roughness and frequency of tool vibration using a
combination of a Grey relational analysis (GRA). Confirmation test is conducted for the optimal
machining parameters to validate the test result. Various turning parameters, such as spindle
speed, feed and depth of cut are considered. Experiments are designed and conducted based on
full factorial design of experiment.
© 2013 Growing Science Ltd. All rights reserved
1. Introduction
Turning is one of the most basic machining processes in industrial production systems. Turning process
can produce various shapes of materials such as straight, conical, curved, or grooved work pieces. In
general, turning uses simple single-point cutting tools. Many researchers have studied the effects of
optimal selection of machining parameters in turning. Tzeng and Chen (2006) used grey relational
analysis to optimize the process parameters in turning of tool steels. They performed Taguchi
experiments with eight independent variables including cutting speed, feed, and depth of cut, coating
type, type of insert, chip breaker geometry, coolant, and band nose radius. The optimum turning
parameters were determined based on grey relational grade, which maximizes the accuracy and
minimizes the surface roughness and dimensional precision.
Similarly, the researchers have applied grey relational analysis (GRA) to different machining
processes, which include electric discharge machining Lin et al. (2002), determining tool condition in
turning (Lo, 2002), chemical mechanical polishing (Lin & Ho, 2003), side milling (Chang & Lu, 2007),
* Corresponding author. Tel: 09883738503
E-mail: (A. Saha)
© 2013 Growing Science Ltd. All rights reserved.
doi: 10.5267/j.ijiec.2012.011.004
52
and flank milling (Kopac & Krajnik, 2007) to compare the performance of diamond tool carbide inserts
in dry turning (Arumugam et al., 2006), and optimization of drilling parameters to minimize surface
roughness and burr height (Tosun, 2006). Lin (2004) implemented grey relational analysis to optimize
turning operations with multiple performance characteristics. He analyzed tool life, cutting force, and
surface roughness in turning operations.
Tosun (2006) reported the use of grey relational analysis for optimizing the drilling process parameters
for the work piece surface roughness and the burr height is introduced. This study indicated that grey
relational analysis approach can be applied successfully to other operations in which performance is
determined by many parameters at multiple quality requests. Al-Refaie et al. (2010) used Taguchi
method grey analysis (TMGA) to determine the optimal combination of control parameters in milling,
the measures of machining performance being the MRR and SR.
Based on the ANOVA; it was found that the feed rate is important control factor for both machining
responses. If there are multiple response variables for the same set of independent variables, the
methodology provides a different set of optimum operating conditions for each response variable. The
grey system theory initiated by Deng (1982) has been proven to be useful for dealing with poor,
incomplete, and uncertain information. The grey relational based on the grey system theory can be used
to solve the complicated interrelationships among the multiple performance characteristics effectively
(Wang et al., 1996).
Therefore, the purpose of the present work is to introduce the use of grey relational analysis in selecting
optimum turning conditions on multi-performance characteristics, namely the surface roughness, power
consumption and frequency of tool vibration. In addition, the most effective factor and the order of
importance of the controllable factors to the multi-performance characteristics in the turning process
were determined.
2. Experimentation procedure and test results
The cutting experiments were carried out on an experimental lathe setup using a HSS MIRANDA S400 (AISI T – 42) cutting tool for the machining of the IS: 2062, Gr. B Mild Steel bar, which is 24 mm
in diameter. The percent composition of the work piece material is listed in Table 1. Mar Surf PS1
surface roughness tester was used to measure the Surface roughness Ra (µm) of the machined samples
and Lathe tool dynamometer was used to measure the cutting forces and measuring cutting tool
vibration using Pico Scope 2202
Table 1
Chemical composition of IS: 2062, Gr. B. mild steel
Material Composition
C
Mn
Weight Percentage (%)
0.15
0.79
Si
0.22
S
0.022
P
0.030
In the present experimental study, spindle speed, feed and depth of cut have been considered as
machining parameters. The machining parameters with their units and their levels as considered for
experimentation are listed in Table 2.
Table 2
Machining parameters and their limits
Symbol
Machining Parameter Unit
A
Spindle Speed
RPM
B
Feed rate
mm/rev
C
Depth of cut
mm
Level 1
160
0.08
0.1
Level 2
240
0.16
0.15
Level 3
400
0.32
0.2
53
A. Saha and N. K. Mandal / International Journal of Industrial Engineering Computations 4 (2013)
Table 3
Experimental conditions, cutting force and calculated power
Exp. No
Spindle Speed
N
(RPM)
Feed rate
F
(mm/rev)
Depth of cut
dcut (mm)
Response main force
Fc
(N)
Cutting speed Vc
(m min−1)
Power calculated Pc
(W = N * Vc ) Watt
1
2
3
4
5
6
7
8
9
10
11
12
13
14
15
16
17
18
19
20
21
22
23
24
25
26
27
160
160
160
160
160
400
240
400
160
400
240
400
240
240
240
160
240
160
400
160
400
240
400
240
400
240
400
0.08
0.08
0.32
0.32
0.16
0.32
0.16
0.16
0.16
0.16
0.16
0.08
0.32
0.08
0.08
0.08
0.08
0.32
0.08
0.16
0.16
0.32
0.32
0.32
0.32
0.16
0.08
0.15
0.2
0.15
0.1
0.1
0.15
0.1
0.15
0.2
0.1
0.15
0.2
0.1
0.1
0.15
0.1
0.2
0.2
0.15
0.15
0.2
0.15
0.1
0.2
0.2
0.2
0.1
48
64
192
87.04
43.68
130.56
50.68
70.52
107.36
54.68
80.52
64
100.04
25
48
33
64
174.08
38
80.52
127.36
192
109.36
194.08
174.08
127.36
27.34
12.06
12.06
12.06
12.06
12.06
30.16
18.09
30.16
12.06
30.16
18.09
30.16
18.09
18.09
18.09
12.06
18.09
12.06
30.16
12.06
30.16
18.09
30.16
18.09
30.16
18.09
30.16
9.65
12.86
38.6
17.5
8.8
65.63
15.28
35.5
21.6
27.5
24.28
32.17
30.16
7.54
14.47
6.63
19.3
35
19.1
16.2
64.02
57.9
56
58.5
87.5
38.4
13.74
Table 4
Experimental design and collected response data
Parameter
Response features
Exp
No.
Spindle Speed
N(RPM)
Feed rate
f(mm/rev)
Depth of cut
dcut (mm)
Power consumption
P(W)
Surface
roughness
Ra (µm)
Frequency of tool
vibration
f (Hz)
1
2
3
4
5
6
7
8
9
10
11
12
13
14
15
16
17
18
19
20
21
22
23
24
25
26
27
160
160
160
160
160
400
240
400
160
400
240
400
240
240
240
160
240
160
400
160
400
240
400
240
400
240
400
0.08
0.08
0.32
0.32
0.16
0.32
0.16
0.16
0.16
0.16
0.16
0.08
0.32
0.08
0.08
0.08
0.08
0.32
0.08
0.16
0.16
0.32
0.32
0.32
0.32
0.16
0.08
0.15
0.2
0.15
0.1
0.1
0.15
0.1
0.15
0.2
0.1
0.15
0.2
0.1
0.1
0.15
0.1
0.2
0.2
0.15
0.15
0.2
0.15
0.1
0.2
0.2
0.2
0.1
9.65
12.86
38.6
17.5
8.8
65.63
15.28
35.5
21.6
27.5
24.28
32.17
30.16
7.54
14.47
6.63
19.3
35
19.1
16.2
64.02
57.9
56
58.5
87.5
38.4
13.74
1.97
2.01
6.84
6.16
2.58
5.46
2.38
1.68
3.02
2.29
2.20
1.66
6.01
1.59
1.80
1.88
1.82
6.72
1.54
3.42
2.60
5.84
5.82
6.28
5.89
2.84
1.38
270.7
281
335
322.9
295
395
326.5
362
310
347
337.7
355
350
297
321
260
327
347
340
302.7
384
370
376
375.7
420
357
322
54
3. Methodologies
3.1 Grey relational analysis
Original Taguchi method has been designed to optimize a single performance characteristic. The Grey
relational analysis based on the Grey system theory can be used to solve complicated multiple
performance parameters effectively. As a result, optimization of the complicated outputs can be
converted into optimization of a single Grey relational grade. Grey relation analysis is used to find out
whether there is consistency between the changing trends of two factors or not, and to find out the
possible mathematical relationship among the factors or in the factors themselves.
3.1.1 Data preprocessing
Data preprocessing is normally required since the range and unit in one data sequence may differ from
the others. Data preprocessing is also necessary when the sequence scatter range is too large or when
the directions of the target in the sequences are different. Data preprocessing is a means of transferring
the original sequence to a comparable sequence. Depending on the characteristics of a data sequence,
there are various methodologies of data preprocessing available for the gray relational analysis.
If the target value of the original sequence is infinite, then it has a characteristic of the “higher is
better.” The original sequence can be normalized as follows:
xi* (k ) =
xi0 (k ) − min xi0 (k )
.
max xi0 (k ) − min xi0 (k )
(1)
When the “lower is better” is a characteristic of the original sequence, then the original sequence
should be normalized as follows:
xi* (k ) =
max xi0 (k ) − xi0 (k )
.
max xi0 (k ) − min xi0 (k )
(2)
However, if there is a definite target value (desired value) to be achieved, the original sequence will be
normalized in from:
x (k ) = 1 −
*
i
xi0 (k ) − xi0
max xi0 (k ) − min xi0
.
(3)
Alternatively, the original sequence can be simply normalized by the most basic methodology, i.e., let
the value of the original sequence be divided by the first value of the sequence:
(4)
xi0 (k )
,
0
xi (1)
where i=1,….,m; k =1,…, n. m is the number of experimental data items, and n is the number of parameters.
xio(k)denotes the original sequence, xi*(k) the sequence after the data preprocessing, max. xio(k) the largest
value of xio(k), min. xio(k) the smallest value of xio(k), and xio is the desired value of xio(k).
xi* (k ) =
3.2.2 Gray relational coefficient and gray relational grade
In gray relational analysis, the measure of the relevancy between two systems or two sequences is
defined as the gray relational grade. When only one sequence, xo(k), is available as the reference
sequence, and all other sequences serve as comparison sequences called a local gray relation
A. Saha and N. K. Mandal / International Journal of Industrial Engineering Computations 4 (2013)
55
measurement. After data preprocessing is carried out, the gray relation coefficient ξi(k) for the kth
performance characteristics in the ith experiment can be expressed as follows,
ξi(k)=
∆
.∆
∆ ( ) .∆
(5)
,
where, ∆ ( ) = | ∗ ( ) −
∗
( )| and∆
= 1.00, ∆
= 0.00
and Δoi(k) is the deviation sequence of the reference sequence xo*(k)and the comparability sequence
xi*(k). is the distinguishing or identification coefficient defined in the range 0≤ ξ ≤1 (the value may be
adjusted based on the practical needs of the system). A value of is the smaller, and the distinguished
ability is the larger. The purpose of defining this coefficient is to show the relational degree between
the reference sequence xo*(k) and the comparability sequence xi*(k). =0.5 is generally used.After the
grey relational coefficient is derived, it is usual to take the average value of the grey relational
coefficients as the grey relational grade. The grey relational grade is defined as follows:
=
1
( ).
(6)
However, in a real engineering system, the relative importance of various factors varies. In the real
condition of unequal weight being carried by the various factors, the grey relational grade in Eq. (1)
was extended and defined as recommended by Deng (1982).
=
1
where ∑
( ),
(7)
= 1 and wk denotes the normalized weight of factor k.
Here, the grey relational grade γi represents the level of correlation between the reference sequence and
the comparability sequence. If the two sequences are identical by coincidence, then the value of grey
relational grade is equal to 1.
The grey relational grade also indicates the degree of influence that the comparability sequence could
exert over the reference sequence. Therefore, if a particular comparability sequence is more important
than the other comparability sequences to the reference sequence, then the grey relational grade for that
comparability sequence and reference sequence will be higher than other grey relational grade. Grey
relational analysis is actually a measurement of absolute value of data difference between sequences,
and it could be used to measure approximation correlation between sequences.
4. Results and discussion
4.1 Optimal parameter combination
We know from the analysis of machining process that the lower power consumption and surface
roughness as well as lower value of frequency of tool vibration provides better quality of the machined
surface. Thus, the data sequences power consumption, surface roughness and frequency of tool
vibration both have “smaller-the-better” characteristics. Table 5 lists all of the sequences following data
pre-processing of power consumption, surface roughness and frequency of tool vibration by using Eq.
(2). Then, the deviation sequences, ∆ ( ) = | ∗ ( ) − ∗ ( )| has been determined and are shown in
Table 6. Grey relational coefficient and Grey relational grade values of each experiment of the full
factorial design were calculated by applying equation 5 and 6 and Table 7 and table 8 shows the Grey
relational coefficient and grey relational grade for each experiment using full factorial design.
56
Table 5
Grey relational generation of each performance characteristics
Exp. No.
Ideal sequence
1
2
3
4
5
6
7
8
9
10
11
12
13
14
15
16
17
18
19
20
21
22
23
24
25
26
27
Power consumption P(W)
1.000
0.693
0.923
0.605
0.866
0.973
0.270
0.893
0.643
0.815
0.742
0.782
0.684
0.709
0.989
0.903
1.000
0.843
0.650
0.846
0.882
0.290
0.366
0.389
0.359
0.000
0.607
0.912
Surface roughness Ra (µm)
1.000
0.892
0.885
0.000
0.124
0.780
0.253
0.817
0.945
0.699
0.833
0.850
0.949
0.152
0.961
0.923
0.908
0.919
0.022
0.970
0.626
0.776
0.183
0.187
0.102
0.174
0.733
1.000
Frequency of tool vibration f (Hz)
1.000
0.933
0.869
0.531
0.607
0.781
0.156
0.584
0.362
0.688
0.456
0.514
0.406
0.438
0.769
0.619
1.000
0.581
0.456
0.500
0.733
0.225
0.3125
0.275
0.277
0.000
0.394
0.612
The multi- response optimization problem has been transformed into a single equivalent objective
function optimization problem using this approach. The higher grey relational grade is said to be close
to the optimal. According to performed experiment design, it is clearly observed that experiment no. 16
has the highest Grey relation grade. Thus, the sixteenth experiment gives the best multi-performance
characteristics of the turning process among the 27 experiments.
Table 6
Evaluation of deviation sequence △oi (k) for each of the responses
Exp. No.
Ideal sequence
1
2
3
4
5
6
7
8
9
10
11
12
13
14
15
16
17
18
19
20
21
22
23
24
25
26
27
Power consumption P(W)
1.000
0.037
0.077
0.395
0.134
0.027
0.73
0.107
0.357
0.185
0.258
0.218
0.316
0.291
0.011
0.097
0.000
0.157
0.350
0.154
0.118
0.710
0.634
0.611
0.641
1.000
0.393
0.088
Surface roughness
Ra (µm)
1.000
0.108
0.115
1.000
0.876
0.220
0.747
0.183
0.055
0.301
0.167
0.150
0.051
0.848
0.039
0.077
0.092
0.081
0.978
0.030
0.374
0.224
0.817
0.813
0.898
0.826
0.267
0.000
Frequency of tool vibration
f (Hz)
1.000
0.067
0.131
0.469
0.393
0.219
0.844
0.416
0.638
0.312
0.544
0.486
0.594
0.562
0.231
0.381
0.000
0.419
0.544
0.500
0.267
0.775
0.688
0.725
0.723
1.000
0.606
0.388
57
A. Saha and N. K. Mandal / International Journal of Industrial Engineering Computations 4 (2013)
Table 7
Grey relational coefficients of each performance characteristics for 27 comparability sequences
Expt. No.
1
2
3
4
5
6
7
8
9
10
11
12
13
14
15
16
17
18
19
20
21
22
23
24
25
26
27
Power consumption P(W)
0.931
0.867
0.559
0.789
0.949
0.406
0.824
0.583
0.730
0.659
0.696
0.613
0.632
0.978
0.837
1.000
0.761
0.588
0.764
0.809
0.413
0.440
0.450
0.438
0.333
0.559
0.850
Surface roughness Ra (µm)
0.822
0.813
0.333
0.363
0.694
0.400
0.732
0.900
0.624
0.749
0.769
0.907
0.370
0.928
0.866
0.844
0.860
0.338
0.943
0.572
0.690
0.379
0.380
0.358
0.377
0.652
1.000
Frequency of tool vibration f (Hz)
0.882
0.792
0.516
0.560
0.695
0.372
0.546
0.439
0.616
0.479
0.507
0.457
0.470
0.684
0.567
1.000
0.544
0.479
0.500
0.652
0.392
0.420
0.408
0.409
0.333
0.452
0.563
Table 8
Evaluated grey relational grades for 27 groups
Expt. No.
1
2
3
4
5
6
7
8
9
10
11
12
13
14
15
16
17
18
19
20
21
22
23
24
25
26
27
Grey relational grade
0.898
0.824
0.469
0.570
0.779
0.393
0.700
0.640
0.656
0.629
0.657
0.659
0.490
0.863
0.757
0.948
0.722
0.463
0.736
0.678
0.498
0.413
0.412
0.402
0.348
0.554
0.804
Rank
2
4
21
17
6
26
10
15
14
16
13
12
20
3
7
1
9
22
8
11
19
23
24
25
27
18
5
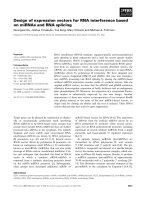
Table 9 shows the response table and graph of grey relational grade for each turning parameter at
different levels, respectively. As shown in Table 9, the important rank in sequence for various turning
parameters in machining of mild steel. The order of importance of the controllable factors to the multiperformance characteristics in the turning process, in sequence can be listed as: factor B (Feed rate), A
58
(Spindle speed), C (Depth of cut). Factor B (Feed rate) was the most effective factor to the
performance. This indicates that the turning performance was strongly affected by the feed rate
Table 9
Response of grey relational grade
Symbol
A
B
C
Grey relational grade
Level I
Level II
0.698*
0.617
0.801*
0.643
0.688*
0.627
Turning parameters
Spindle speed
Feed rate
Depth of cut
Level III
0.569
0.440
0.569
Max - Min Rank
0.129
2
0.361
1
0.119
3
* optimal turning parameters
Total mean Grey relational grade = 0.628
Optimum set of parameters are A in first level, B in first level and C in first level respectively
(A1B1C1).
S c a tte r p lo t o f G r e y r e la tio n a l g r a d e v s E x p t. N o .
1 .0
Grey relational grade
0 .9
0 .8
0 .7
0 .6
0 .5
0 .4
0 .3
1
2
3
4
5
6
7
8
9
10
11 12
13 14
15
16 17
18 19
20 21
22 23
24
25 26
27
E x p t . No .
Fig. 1. Grey relation grades for the power consumption, surface roughness and frequency of tool
vibration
4.2 Confirmation Test
After obtaining the optimal level of the machining parameters, the next step is to verify the
improvement of the performance characteristics using this optimal combination. The estimated grey
relational grade using the optimum level of the `parameter is the total mean of the grey relational grade
is the mean of the grey relational grade at the optimum level and o is the number of machining
parameters that significantly affects the multiple performance characteristics.
=
+
−
,
(8)
where is the total mean of the grey relational grade, is the mean of the grey relational grade at the
optimum level and o is the number of machining parameters that significantly affects the multiple
performance characteristics. Based on equation8the estimated grey relational grade using the optimal
machining parameters can then be obtained. Table 10 shows the results of the confirmation experiment
using the optimal machining parameters The Power consumption P is greatly reduced from 9.65 to 6.63
W, Surface roughness Ra is improved from 1.97to 1.88 μm and the frequency of tool vibration f is
greatly reduced from 270.7 to 260 Hz. It is clearly shown that multiple performance characteristics in
turning process are greatly improved through this study.
59
A. Saha and N. K. Mandal / International Journal of Industrial Engineering Computations 4 (2013)
Table 10
Results of machining performance using initial and optimal machining parameters
Initial machining
parameters
Optimal machining parameters
Prediction
Experiment
Setting Level
Power consumption P(W)
A1B1C2
A1B1C1
9.65
Surface roughness
Ra(µm)
1.97
Frequency of tool vibration f(Hz)
270.7
Grey relational grade
0.898
6.63
A1B1C1
1.88
260
0.931
0.948
Improvement in grey relational grade = 0.05
Therefore, a comparison of the predicted values of the power consumption, surface roughness and
frequency of tool vibration with that of the actual parameters by using the optimal machining
conditions is shown in the above table. An improvement of 5.00% is observed in the grey relational
grade. A good agreement between the two has been observed. This ensures the usefulness of grey
relational approach in relation to product/process optimization, where multiple quality criteria have to
be fulfilled simultaneously.
5. Conclusion
Experiments are designed and conducted on lathe machine with High speed steel MIRANDA S-400
(AISI T – 42) and IS: 2062, Gr. B Mild Steel bar as work material to optimize the turning parameters.
Power consumption, surface roughness and frequency of tool vibration are the responses. Full factorial
design of experiments and Grey relational analysis is constructive in optimizing the multi responses.
Based on the results of the present study, the following conclusions are drawn:
•
•
The optimum combination of turning parameters and their levels for the optimum multiperformance characteristics of turning process are A1B1C1 (i.e. Speed—180 RPM, Feed rate—0.08
mm/rev and Depth-of-cut—0.1 mm).
Confirmation test results prove that the determined optimum condition of turning parameters satisfy
the real requirements.
References
Al-Refaie, A., Al-Durgham, L., & Bata, N. (2010).Optimal Parameter Design by Regression Technique
and Grey Relational Analysis. The World Congress on Engineering, WCE 2010 3.
Arumugam, P. U., & Malshe, A. P., & Batzer, S. A. (2006). Dry machining of aluminum silicon alloy
using polished CVD diamond-coated cutting tools inserts. Surface Coating Technology, 200, 3399–
3403.
Chang, C.K., & Lu, H.S. (2007). Design optimization of cutting parameters for side milling operations
with multiple performance characteristics. International Journal of Advanced Manufacturing
Technology, 32, 18–26.
Deng, J. (1982). Control problems of grey systems. System Control, 5, 288–294.
Kopac, J., & Krajnik, P. (2007). Robust design of flank milling parameters based on grey-Taguchi
method. International Journal of Advanced Manufacturing Technology, 191, 400–403.
Lin, C, L., & Lin, J.L., & Ko, T.C. (2002). Optimization of the EDM process based on the orthogonal
array with fuzzy logic and grey relational analysis method. International Journal of Advanced
Manufacturing Technology, 19, 271–277.
60
Lin, Z.C., & Ho, C.Y. (2003). Analysis and application of grey relation and ANOVA in chemicalmechanical polishing process parameters. International Journal of Advanced Manufacturing
Technology, 21,10–14.
Lin, C.L. (2004). Use of the Taguchi method and grey relational analysis to optimize turning operations
with multiple performance characteristics. Material Manufacturing Process, 19,209–220.
Lo, S.P. (2002). The application of ANFIS and grey system method in turning tool-failure detection.
International Journal of Advanced Manufacturing Technology, 19, 564–572.
Tosun, N. (2006). Determination of optimum parameters for multiperformance characteristics in
drilling by using grey relational analysis. International Journal of Advanced Manufacturing
Technology, 28, 450–455.
Tosun, N. (2006). Determination of optimum parameters for multi-performance characteristics in
drilling using grey relational analysis. International Journal of Advanced Manufacturing
Technology, 28, 450- 455.
Tzeng, Y.F., & Chen, F.C. (2006). Multi-objective process optimization for turning of tool steels.
International Journal of Machining and Machinability of Materials, 1(1), 76–93.
Wang, Z.L., & Zhu, J, H., & WU. (1996). Grey relational analysis of correlation of errors in
measurement. Journal Grey System, 8(1), 73–78.