An experimental investigation and statistical modelling for trim cutting operation in WEDM of Nimonic-90
Bạn đang xem bản rút gọn của tài liệu. Xem và tải ngay bản đầy đủ của tài liệu tại đây (750.63 KB, 14 trang )
International Journal of Industrial Engineering Computations 6 (2015) 351–364
Contents lists available at GrowingScience
International Journal of Industrial Engineering Computations
homepage: www.GrowingScience.com/ijiec
An experimental investigation and statistical modelling for trim cutting operation in WEDM of
Nimonic-90
Vinod Kumara, Vikas Kumarb and Kamal Kumar Jangrac*
a
Research Scholar, Department of Mechanical Engineering, YMCA University of Science and Technology, Faridabad, India
Department of Mechanical Engineering, YMCA University of Science and Technology, Faridabad, India
c
Department of Mechanical Engineering, PEC University of Technology, Chandigarh, India
b
CHRONICLE
Article history:
Received October 14 2014
Received in Revised Format
February 10 2015
Accepted February 24 2015
Available online
February 25 2015
Keywords:
Nimonic-90
Wire electrical discharge
machining
Trim cutting
Response surface methodology
(RSM)
Desirability function
ABSTRACT
Trim cutting operation in wire electrical discharge machining (WEDM) is considered as a
probable solution to improve surface characteristics and geometrical accuracy by removing very
small amount of work materials from the surface obtained after a rough cutting operation. In this
study, an attempt has been made to model the surface roughness and dimensional shift in trim
cutting operations in WEDM process through response surface methodology (RSM). Four
process parameters; namely pulse-on time (Ton), servo voltage (SV), wire depth (Wd) and
Dielectric flow rate (FR) have been considered as input parameters in trim cutting operations for
modelling. Desirability function has been employed to optimize multi performance
characteristics. Increasing the value of Ton, Wd and FR increases the surface roughness and
dimensional shift but increasing SV decreases both surface roughness and dimensional shift.
Quadratic models have been proposed for both the performance characteristics. In present
experimentation, thickness of recast layer was observed in the range of 6μm to 12μm for low to
high value of discharge parameters.
© 2015 Growing Science Ltd. All rights reserved
1. Introduction
Machining of high strength-heat resisting alloys and metal matrix composites with high precision is the
main challenge for manufacturing industries. While machining of different materials with various
machine tools, it is essential to satisfy the surface integrity of the machined surface. Nickel alloys are
specially used for combustion chamber in aero-engines and other components for commercial and
military aircrafts (Choudhury & Baradie, 1998; Ezugwu, 2005). These alloys possess excellent
mechanical and chemical properties at elevated temperature and high corrosion resistance (Guo et al.,
2009). Machinability of these materials with conventional machining processes is a great challenging
task due to complex nature of material properties. Due to low thermal conductivity, Ni alloys leads to
work hardening during machining and increasing temperature of tool tip results in quick wear of tool tip/
rack face and adhesion of work piece material to the cutting edge due to high thermal affinity (Choudhury
& Baradie, 1998; Ulutan & Ozel, 2011). Surface drag, material pull out, cracking and tearing of work
surface occur during machining of Ni based alloys with conventional machining processes (Wei, 2002;
* Corresponding author. Tel: +91-9416358678
E-mail: (K. K. Jangra)
© 2015 Growing Science Ltd. All rights reserved.
doi: 10.5267/j.ijiec.2015.2.006
352
Arunachalam et al., 2004; Sharman et al., 2004; Krain et al., 2007; Hood et al., 2011; Kortabarria et al.,
2011; Soo et al., 2011).
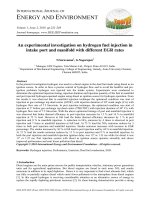
Wire electrical discharge machining (shown in Fig. 1) is an electro thermal process, which removes
electrical conductive materials by mean of repetitive electric sparks across a spark gap between a
continuous moving conductive wire and work piece. Each discharge melts or vaporizes a small amount
of materials from the machined surface, which is flushed away by the dielectric fluid flowing between
wire electrode and work surfaced. WEDM provides the best alternatives for machining the exotic,
conductive and hard materials with the scope of generating intricate shape and profile (Cheng et al.,
2014).
Fig. 1. Schematic representation of WEDM process
Jangra et al. (2011) utilized the grey based Taguchi method to optimize the MRR and SR for WEDM of
WC-Co composite. Results revealed that taper angle, pulse on time (Ton) and pulse off time (Toff) are
the most significant process parameters. Yang et al. (2012) proposed a hybrid method including RSM
and back – propagation neural network (BPNN) integrated simulated annealing algorithm (SAA) to
determine an optimal setting for machining of pure Tungsten in WEDM. RSM and BPNN/SAA methods
were effective tools for the optimization of parameters in WEDM process. Jangra et al. (2011) developed
a mathematical model using digraph and matrix method to evaluate the machinability of tungsten carbide
composite on WEDM. Factors affecting the machinability of tungsten carbide composite were grouped
in five broad categories namely work material, machine tool, tool electrode, cutting conditions, and
geometry to be machined. Kumar et al. (2012) presented the influence of WEDM parameters on
machinability of Nimonic-90. Influence of WEDM parameters namely discharge current (Ip), pulse-on
time (Ton), pulse-off time (Toff), servo voltage (SV) and wire feed rate (WF) were investigated on cutting
speed. The experiments were conducted by varying a single variable at a time while keeping other
parameters at constant level on 5 axis sprint cut (ELPUSE-40) wire EDM manufactured by Electronic
M/C Tool LTD India. Experimental results showed that the Ip, Ton and Toff produces noticeable
influence on Cutting speed.
Khanna and Singh (2013) developed a mathematical model for cryogenic treated D-3 material by means
of RSM and then solved the optimization problem by desirability function. Bobbili et al. (2014) carried
out a study for optimising the WEDM process parameters like pulse on time (Ton), pulse off time (Toff),
wire feed rate (WF), flushing pressure and servo voltage (SV) during the machining of high strength
Armor steel. Results show that Ton, Toff and SV are significant variables to both material removal rate
(MRR) and SR. Bhuyan and Yadava (2014) investigated the effect of input process variable on MRR
and Kerf width during machining of Borosilicate Glass using a hybrid machining process “Travelling
wire electrochemical spark machining” (TWECSM). MRR and Kerf width increase with increase in
353
V. Kumar et al. / International Journal of Industrial Engineering Computations 6 (2015)
applied voltage, pulse on time and electrolyte concentration. Gupta and Jain (2014) investigated the
behaviour of the micro geometry parameters of miniature spur gears produced by WEDM process and
optimized the process parameters for minimizing the total profile and accumulated pitch deviation using
response surface methodology. The various experimental and theoretical studies show that process
capability of WEDM could be improved significantly by correct selection of machining parameters for
a given material. Sharma et al. (2013) optimized the process parameters of WEDM using response
surface methodology. Desirability approach has been adopted for multi response (i.e. CS and dimensional
deviation) optimization. Ton is the most significant factor for multi response optimization, while two
way interactions also played significant role in the process.
1.1 Trim Cutting Operation
The majority of past research works focus on rough cutting operation in WEDM. Damaged surface layer
with poor surface integrity, micro cracks, heat affected zone are the major shortcoming in rough cutting
operation (Lee & Li, 2003; Wang et al., 2009; Jangra, 2012). The defects are due to high heat energy
generated across the electrodes and re-solidification of melted debris’s that do not flushed out quickly
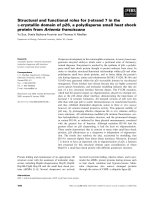
out of a narrow spark gap (Puri & Bhattacharyya, 2003; Rebelo et al., 1998; Sarkar et al., 2011). Trim
cutting is considered as a probable solution to improve the surface integrity, geometrical accuracy and
fatigue life by removing the degraded materials on the machined surface. In trim cutting operation, wire
electrode trace back the same wire path of first cut with low discharge energy and certain values of wire
offset (Huang et al., 1999) as shown in Fig. 2. Wire offset (WO) is the distance between the center of
electrode and work surface after rough cut. Wire depth (Wd) is the distance travelled perpendicular and
inside the work piece during trim cutting operation. The wire depth (Wd) is related to wire offset value.
Increasing wire offset value decreases the Wd.
Wire electrode
Machined surface
after rough cut
D
Machined surface
after trim cut
WO
Wd
Wire path in trim cut
Work
Material
DS
Wire path in rough cut
D: wire diameter; WO: wire offset; Wd: wire depth; DS: dimensional shift
Fig. 2. Terminology used in trim cutting operation
Han et al. (2007) explained the influence of machining parameters namely Ton, Ip, sustained pulse time,
pulse-interval time, polarity effect, work material and dielectric, on surface roughness after a single trim
cut of WEDM. Sarkar et al. (2008) developed a second order mathematical model in term of machining
parameters for surface finish, dimensional shift and cutting speed in trim cutting of γ-titanium aluminide
using response surface methodology (RSM) on WEDM. Machining parameters namely pulse-on time,
peak current, dielectric flow rate and effective wire offset were considered for a single trim cutting
operation in WEDM. The minimum value of surface roughness obtained was 1.28μm. Klink et al. (2011)
presented the comparison of the surface finish, microstructure, micro hardness and residual stresses after
rough and trim cuts in WEDM.
354
Jangra et al. (2014) conducted an experimental study on rough and trim cutting operation in WEDM of
four hard to machine materials namely WC-Co composite, HCHCr steel alloy, Nimonic-90 and Monel400. Result shows that using single trim cutting operation with correct machining parameters and
appropriate wire offset, surface characteristics could be improved irrespective of the rough cutting
operation. Jangra KK (2015) investigated the multi-pass cutting operation in WEDM of WC-Co
composite. Trim cuts were performed using Taguchi method to investigate the influence of rough cut
history, discharge current, pulse-on time, wire offset and number of trim cuts for two performance
characteristics namely surface roughness and depth of material removed. A technological data has
provided for rough and trim cut on WEDM for efficient machining of WC-5.3%Co composite.
Despite many research works on WEDM, investigation on WEDM of Nimonic 90 is still missing.
Nimonic-90 is a nickel-chromium-cobalt based alloy, most widely used in the aerospace and air craft
industries in the manufacturing of turbine blades and combustion chamber, valve in turbo motors and
disc in gas turbine. This material possesses excellent strength at extreme pressure and temperature. In
present work, investigation on trim cutting operation in WEDM of Nimonic-90 has been presented.
Machining parameters namely pulse on time, servo voltage, dielectric flow rate and wire depth have been
investigated on surface characteristics and dimensional shift in trim cutting operation. A standard second
order experimental design called face centered Central Composite Design (CCD) in term of machining
parameter has been adopted using response surface methodology (RSM). Desirability function has been
employed to optimize two performance characteristics simultaneously.
4
Normal Plot of Residuals
5
11
10
99
Work Material
3
8
2
9
6
7
1-2-3-4-5-6-7: Rough Cut Path
7-8-9-10-11-12-8: Trim Cut Path
Normal % Probability
12
95
90
80
70
50
30
20
10
5
1
-2.72
-1.60
-0.49
0.62
1.74
1
Internally Studentized Residuals
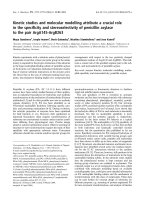
Fig. 3. Cutting operations in WEDM process
Fig. 4. Residuals plot for SR
2. Experimentation procedure
In present work, Nimonic-90 has been selected for conducting experiments on 5 axis sprint cut (ELPUSE40) Wire EDM manufactured by Electronic M/C Tool LTD India. Nimonic-90, a nickel based super alloy
containing 60% Ni, 19.3% Cr, 15% Co, 3.1% Ti, and 1.4% Al, hot forged in rectangular plate of 12.5
mm thickness; has been selected as work piece material. It has density; 8.18 g/cm3, melting point; 1370
0
C, hardness; 365 HV, thermal conductivity; 11.47 W/mĊ and modulus of elasticity; 220MPa. The major
characteristic of Nimonic-90 is its high rupture strength and creep resistance at high temperature (upto
9000C).
In present experimentation, trim cutting operations were performed at different combination of process
parameters after a rough cut performed at constant parameters. Using WEDM, work material was
machined and samples were obtained in the form of rectangular punches of dimension 6 mm × 10 mm ×
12.5 mm. Fig. 3 shows the schematic diagram of the cutting operation performed in present work.
According to path programme (Fig. 3), firstly, a rough cut (1-2-3-4-5-6-7) was performed at constant
355
V. Kumar et al. / International Journal of Industrial Engineering Computations 6 (2015)
value of discharge parameters and zero wire offset value. The machine was halted at point 7 to change
the input machining parameters and then subsequently trim cut (7-8-9-10-11-12-8) was performed
according to the experimental plan mentioned in Table 3. Dimensional shift (Ds) was calculated after
measuring the dimensions of punch with the help of an optical microscope. To measure the punch width
(PW) after rough cut, a rough cut path; 1-2-3-4-5-6-7-2 was followed to remove the punch out of work
material. Rough cut were repeated at same parameter setting to obtain an average value of PW after rough
cut. Ds can be obtained as
Ds : (Punch width after rough cut – Punch width after trim cut)/2.
In case of trim cutting, the prime objective is to improve surface roughness and to reduce dimensional
inaccuracy. Therefore, high discharge energy parameters combination providing maximum cutting rate
has been selected in rough cutting operation, while in trim cutting operation low discharge energy
parameters resulting, low surface roughness, has been selected. Fixed Machining parameters setting for
rough cutting and trim cutting operation are shown in Table 1. A zinc coated brass wire having a fixed
diameter of 0.25mm has been selected as wire electrode. Distilled water having conductivity 20 mho has
been used as a dielectric fluid.
Table 1
Fixed machining parameters in rough & trim cutting operation
Rough cut parameters
Pulse on Time, Ton = 118 µs
Pulse off Time, Toff = 35 µs
Dielectric Flow Rate, FR=12L/min
Wire Feed rate, WF = 5 mm/min
Trim cut parameters
Pulse off time, Toff = 30 µs
Discharge current, Ip =110 machine unit
Wire tension, WT = 8N
Wire Tension WT = 10 N
Discharge Current, Ip = 150 machine unit
Servo Voltage, SV = 30 V
Servo Feed, SF=150mm/min
Work material thickness =12.5 mm
Wire feed rate, WF = 2mm/min
Servo feed, SF = 150
The pulse on time (Ton), servo voltage (SV), wire depth (Wd) and dielectric flow rate (FR) have been
considered as main process parameters in trim cutting operation for investigation. Dimensional shift (Ds)
and surface roughness (SR) are two response parameters. Table 2 shows the process parameters and their
levels for trim cutting operation. Value of wire depth (Wd) was varied by varying the wire offset in trim
cut. Experiments were performed according to the layout of experimental design for Face CCD of second
order shown in Table 3.
Table 2
Variable process parameters and their levels for Trim cutting conditions
Parameter
Pulse on Time (Ton)
Servo Voltage (SV)
Wire depth (Wd)
Dielectric Flow Rate (FR)
Units
µs
V
µm
L/min
Levels
104
20
10
2
112
40
30
6
3. Response Surface Methodology and Experimental Design
Response surface methodology (RSM) is a collection of mathematical and experimental techniques that
requires sufficient number of experimental data to analyse the engineering problem and to develop
mathematical models for several input variables and output performance characteristics (Myers &
Montgomery, 1995; Jangra & Grover, 2012). By using the design of experiments and applying regression
analysis, the modelling of the desired response (𝑌𝑌) to several independent input variables (xi) can be
gained. In RSM, the quantitative form of relationship between desired response and independent input
variables could be represented as:
356
(1)
𝑌𝑌 = 𝛷𝛷(𝑥𝑥1 , 𝑥𝑥2 , … … … . . , 𝑥𝑥𝑘𝑘 ) ± 𝑒𝑒𝑟𝑟
The function Φ is called response surface or response function. The residual 𝑒𝑒𝑟𝑟 measures the experimental
errors (Cochran & Cox, 1962). In applying the RSM, the dependent variable is viewed as a surface to
which a mathematical model is fitted. For the development of regression equations related to various
performance characteristics of WEDM process, the second order response surface has been assumed as:
𝑘𝑘
𝑘𝑘
2
(2)
2
𝑌𝑌 = 𝑏𝑏0 + � 𝑏𝑏𝑖𝑖 𝑋𝑋𝑖𝑖 + � 𝑏𝑏𝑖𝑖𝑖𝑖 𝑋𝑋𝑖𝑖 + � 𝑏𝑏𝑖𝑖𝑖𝑖 𝑋𝑋𝑖𝑖 𝑋𝑋𝑗𝑗 ± 𝑒𝑒𝑟𝑟
𝑖𝑖=1
𝑖𝑖=1
𝑖𝑖<𝑗𝑗=2
where Y is the corresponding response variables i.e. surface roughness and dimensional shift produced
by various process variables of WEDM. 𝑏𝑏0 is constant and 𝑏𝑏𝑖𝑖 , 𝑏𝑏𝑖𝑖𝑖𝑖, 𝑏𝑏𝑖𝑖𝑖𝑖 are the coefficient of linear, quadratic
and cross product terms. The model parameters can be estimated most effectively if proper experimental
designs are used to collect the data. The objective of this study was to identify an optimal setting for
process parameters that can be minimizing the surface roughness and dimensional shift of a WEDM
process in trim cutting operation.
Table 3
The layout of experimental design for Face CCD of second order and experimental results
Exp. No.
Ton
SV
Wd
FR
SR (µm)
DS (µm)
1
2
3
4
5
6
7
8
9
10
11
12
13
14
15
16
17
18
19
20
21
22
23
24
25
26
27
28
29
30
104
112
104
112
104
112
104
112
104
112
104
112
104
112
104
112
104
112
108
108
108
108
108
108
108
108
108
108
108
108
20
20
40
40
20
20
40
40
20
20
40
40
20
20
40
40
30
30
20
40
30
30
30
30
30
30
30
30
30
30
10
10
10
10
30
30
30
30
10
10
10
10
30
30
30
30
20
20
20
20
10
30
20
20
20
20
20
20
20
20
2
2
2
2
2
2
2
2
6
6
6
6
6
6
6
6
4
4
4
4
4
4
2
6
4
4
4
4
4
4
1.31
2.03
1.1
1.51
1.25
2.45
1.22
2.22
1.18
2.41
1.11
1.97
1.25
2.9
1.3
2.69
1.32
2.53
2.03
1.81
1.86
2.2
1.72
2
2.03
2.08
2.09
2.06
2.08
2.12
14
17
16
14
38
38
43
45
22
29
17
28
40
48
46
54
23
27
23
27
20
47
27
36
28
27
27
29
30
27
4. Results and Discussions
In present study, on the basis of inputs process parameters and their level as listed in Table 2, a standard
second order experimental design called face centred Central Composite Design (CCD) has been adopted
for analysing and modelling the WEDM parameters for average value of surface roughness and
dimensional shift is illustrated in Table 3. Surface roughness value (SR) was measured in terms of mean
absolute deviation (Ra) using the digital surface tester Mitutoyo 201P. Regression equations have been
developed for correlating the input process parameters with response parameters using RSM. To analyze
the experimental data, Design expert (DX7), a statistical tool, has been utilized. Analysis of Variance
(ANOVA) has been performed on the experimental data to test the goodness of fit of the model. This
357
V. Kumar et al. / International Journal of Industrial Engineering Computations 6 (2015)
includes the test for significance of the regression model, test for significance on model coefficients and
test for lack of fit model adequacy.
4.1 Analysis of Surface roughness (SR)
Table 4 shows the fit summary for SR, after backward elimination process. The Model F-value of 232.85
implies the model is significant. There is only a 0.01% chance that a large “Model F-Value” could occur
due to noise. In this case A, B, C, D, AB, AC, AD, BC, A2, B2, D2 are significant model terms.Values
greater than 0.05 indicate the model terms are not significant. Selected model would be statistically
significant, if p-value for the model terms are less than 0.05 (i.e. α = 0.05, or 95% confidence level)
(Myers & Montgomery, 1995). Using backward elimination process, insignificant terms (p-value ˃ 0.05)
have been eliminated from the reduced quadratic model. Table 4 shows that the p-value for quadratic
model is significant, which shows that the terms in the model have significant effect on output response.
In present case, the value of R2 and R2 (adj.), called coefficient of determination, is over 99%. When R2
approaches unity, the better the response model fits the actual data. Also, test of ‘lack of fit’ shows
insignificant effect, which is desirable for selecting the models. Fig. 4 shows that the residuals are
normally distributed about a straight line, which means that the errors are normally distributed.
Consequently, the proposed model for SR can be considered as significant for fitting and predicting the
experimental results. The final response equation after eliminating the non-significant terms for surface
roughness is given below:
Final Equation in Terms of actual factors:
Surface roughness = – 63.92711+ 1.12996 × Ton + 0.22186 × SV- 0.33958 × Wd – 1.17592 ×
FR – 1.78125E–003 × Ton × SV + 3.15625E-003 ×Ton × Wd + 0.014063 ×Ton × FR+
5.12500E-004 × SV × Wd – 4.91477E-003 × Ton2 – 8.36364E-004 × SV2 – 0.035909 × FR2
(3)
In order to analyse the influence of WEDM parameters on SR, response surface graphs have been plotted
as shown in Fig. 5a-5d. Fig. 5a-5d shows the noticeable influence of process parameters on surface
roughness. Surface roughness increases with increasing the value of Ton, Wd and FR while it decreases
with increasing value of SV. The influence of FR is non-symmetric. The curved plots show the interaction
among the input parameters. The parameter namely Ton, SV, Wd, FR and their interactions are highly
significant for SR as shown by ANOVA Table 4.
Table 4
ANOVA table for fitted model for SR
Source
Model
A-Ton
B-SV
C-Wd
D-FR
AB
AC
AD
BC
A2
B2
D2
Residual
Lack of Fit
Pure Error
Cor Total
Sum of Square Degree of Freedom Mean Square
7.25
11
0.66
5.19
1
5.19
0.2
1
0.2
0.5
1
0.5
0.22
1
0.22
0.081
1
0.081
0.26
1
0.26
0.2
1
0.2
0.042
1
0.042
0.018
1
0.018
0.02
1
0.02
0.059
1
0.059
0.051
18
2.83E-03
0.046
13
3.57E-03
4.53E-03
5
9.07E-04
7.3
29
0.9930
R-Squared
0.9887
Adj R-Squared
F-Value
232.85
1835.66
69.38
176.68
78.52
28.7
90.11
71.55
14.85
6.2
7.02
20.69
Prob > F
< 0.0001
< 0.0001
< 0.0001
< 0.0001
< 0.0001
< 0.0001
< 0.0001
< 0.0001
0.0012
0.0228
0.0163
0.0002
3.94
0.0697
Pred R-Squared
Adeq Precision
significant
not significant
0.9773
54.7377
358
2.6
2.8
2.425
1.95
2.05
SR
SR
2.275
1.625
1.675
1.3
1.3
40.00
112.00
35.00
30.00
B: SV
112.00
30.00
110.00
25.00
A: Ton
C: Wd
108.00
25.00
106.00
20.00
104.00
110.00
108.00
20.00
Fig. 5a. Combined effect of SV and Ton on SR
106.00
15.00
10.00 104.00
A: Ton
Fig. 5b. Combined effect of Wd and Ton on SR
2.6
2.08
2.25
1.93
1.9
SR
SR
2.23
1.78
1.55
1.63
1.2
40.00
30.00
35.00
25.00
25.00
15.00
10.00 20.00
110.00
5.00
108.00
4.00
30.00
20.00
C: Wd
112.00
6.00
B: SV
Fig. 5c. Combined effect of Wd and SV on SR
D: FR
3.00
106.00
2.00 104.00
A: Ton
Fig. 5d. Combined effect of FR and Ton on SR
High discharge energy due to high value of Ton results into overheating and evaporation of molten metal
resulting into high pressure energy that creates large size craters on work surface. The diameter and depth
of crater increases with increasing of pulse-on time and hence increases the surface roughness. Increasing
the value of wire depth (Wd) decreases the gap between wire electrode and work surface which increases
the effective sparking on work surface and hence melting and erosion of the surface material increases.
This causes increases in SR.
Surface roughness decreases with increasing the value of servo voltage as shown in Fig. 5c. Increasing
SV increases the gap between work material and wire electrode that result into low ionization of dielectric
medium and hence low discharge energy get generated. At low dielectric flow rate (FR), laminar
dielectric flow is maintained that results into effective spark generation in trim cutting operation which
removes the surface irregularities completely after the rough cutting operation. Therefore, low FR results
into lower surface roughness. In order to examine the extent of surface damage (Recast layer) on
machined surface, specimen were polished to have mirror finish on the transverse section and observation
through scanning electron microscope (SEM) was made. Recast layer (RCL) is a hard skin on the work
surface formed due to the re-solidification of melted residual material which was not completely expelled
during the process (Puri & Bhattacharyya, 2005). The morphology of recast layer is much different from
bulk material and it adversely affects the working life of machined component (Liao et al., 2004; Soo et
al., 2013) Fig. 6a-6d shows the SEM micrographs of transverse section of sample correspond to sample
no 3, 4, 15 and 26 respectively.
359
V. Kumar et al. / International Journal of Industrial Engineering Computations 6 (2015)
(a)
(b)
(c)
(d)
Fig. 6. SEM images showing recast layer on machined surface correspond to (a) exp. trial 3; (b) exp.
trial 4; (c) exp. trial 15; (d) exp. trial 26
Recast layer (RCL) was observed which was discontinuous and non-uniform and the average thickness
of damaged surface varies from 6μm to 12μm. This thickness of RCL is low as compared to rough cutting
operation. In trim cutting operation, RCL is mostly influenced by pulse on time and wire depth. At high
discharge energy, melting and evaporation of material causes high pressure energy in plasma channel (Li
et al., 2013) which plough out the material from the work surface and create large size irregularities on
work surface. Therefore, low value of Ip and Ton is suggested for trim cutting operation.
4.2 Analysis of Dimensional Shift (DS)
Table 5 shows the fit summary for DS, after backward elimination process. The Model F-value of 193.29
implies the model is significant. There is only a 0.01% chance that a large “Model F-Value” could occur
due to noise. Values of “Prob > F” less than 0.050 indicate model terms are significant. In this case A,
B, C, D, AD, BC, CD, A2, B2, C2, D2 are significant model terms. The “Lack of Fit F-value” of 1.02
implies there is a 953.58 % chance that a large “Lack of Fit F-value” could occur due to noise. The “Pred
R-Squared” of 0.9916 is in reasonable agreement with the “Adj R-Squared” of 0.9865. “Adeq Precision”
measures the signal to noise ratio. A ratio greater than 4 is desirable. Fig. 7 shows that the residuals are
normally distributed about a straight line which means that the errors are normally distributed. The final
response equation after eliminating the non – significant terms for surface roughness is given below:
Final Equation in Terms of actual factors:
360
Dimensional Shift = - 1963.695 + 37.021 × Ton + 1.392 × SV – 1.501 × Wd – 31.036 × FR –
0.173×Ton2 − 8.0454 E – 0.0277×SV 2 + 0.0572 × Wd2+ 0.932 × FR2 + 0.242 × Ton × Wd +
0.0193 × SV × Wd - 0.0343× Wd × FR
(4)
Table 5
ANOVA table for Ds (after backward elimination)
Sum of
Squares
Degree of Freedom
3444.21
11
93.38
1
24.5
1
2738
1
256.88
1
60.06
1
60.06
1
7.56
1
19.90
1
19.90
1
85.01
1
36.01
1
29.16
18
21.16
13
8.00
5
3473.37
29
R-Squared
Adj R-Squared
Source
Model
A-Ton
B-SV
C-Wd
D-FR
AD
BC
CD
A2
B2
C2
D2
Residual
Lack of Fit
Pure Error
Cor Total
Mean
Square
313.11
93.39
24.5
2738
256.88
60.06
60.06
7.56
19.91
19.91
85.01
36.01
1.62
1.63
1.60
F
Value
193.29
57.65
15.12
1690.27
158.58
37.07
37.07
4.66
12.28
12.28
52.47
22.23
Prob > F
1.017189
0.9916
0.9865
< 0.0001
< 0.0001
< 0.0011
< 0.0001
< 0.0001
< 0.0001
< 0.0001
0.0444
0.0025
0.0025
< 0.0001
0.0002
significant
0.5358
not significant
0.9751
50.503
Pred R-Squared
Adeq Precision
Normal Plot of Residuals
37
Dimensional Shift
99
95
Normal % Probability
90
80
70
50
30
20
10
33.25
29.5
25.75
22
5
112.00
6.00
1
110.00
5.00
108.00
4.00
-2.10
-1.00
0.09
1.19
106.00
3.00
D: FR
2.28
2.00 104.00
A: Ton
Internally Studentized Residuals
Fig. 8a. Combined effect of FR and Ton on DS
47
53
39.5
44.5
Dimensional Shift
Dimensional Shift
Fig. 7. Residuals plot for SR
32
24.5
17
40.00
30.00
35.00
25.00
27.5
19
6.00
30.00
5.00
25.00
15.00
10.00
20.00
25.00
4.00
30.00
20.00
C: Wd
36
B: SV
Fig. 8b.Combined effect of Wd and SV on DS
D: FR
20.00
3.00
15.00
2.00
10.00
C: Wd
Fig. 8c. Combined effect of FR and Wd on DS
Dimensional shift (Ds) is the thickness of material removed perpendicular to the cutting direction of wire
electrode in trim cutting operation only. It depends on the melting, evaporation and flushing out of the
V. Kumar et al. / International Journal of Industrial Engineering Computations 6 (2015)
361
surface material. Increase in the value of Ton results into high heat generation that increases the melting
and evaporation of work material and hence the value of Ds increases as shown by response surface plot
in Fig. 8a. Ds increases with decrease in the value of servo voltage as shown in Fig. 8b. Increasing the
value of wire depth (Wd) increases the effective sparking on work surface and hence melting and erosion
of the surface material increases as a result, Ds increases as shown in Fig. 8c. Increase in FR increases
the flushing rate of eroded particles and hence Ds increases with increasing FR and Ton as shown in Fig.
8a. The interaction among the parameters can be noticed by the contour plot on 3D surface plot.
5. Multi performance optimization through Desirability function approach
In order to obtain an optimum parametric setting for two performance characteristics, desirability
function has been utilised. Derringer and Suich (1980) proposed a multiple response optimization
techniques approach called Desirability function. The general approach is to first convert each response
yi(x) into an individual desirability function (di) and varied over the range 0 ≤ di ≤ 1. The simultaneous
objective function is a geometric mean of all converted responses. In the present study, Design Expert 7
has been used to optimize the response variables. Derringer and Suich (1980) defined the three types of
desirability function depending on the type of response characteristics as:
(I) For the “larger- the-better” type:
di
yi
'
yi
yi ≤ yi*
0
− yi*
− yi*
(5)
yi* ≤ yi ≤ yi'
yi ≥ yi'
1
where 𝑦𝑦𝑖𝑖 ∗ is the minimum acceptable value of 𝑦𝑦𝑖𝑖 , 𝑦𝑦𝑖𝑖′ is the highest value of 𝑦𝑦𝑖𝑖 ; t is the shape function for
desirability.
(II) For the smaller-the-better type:
di
0
r
yi* − yi
*
''
yi − yi
1
yi ≤ yi''
(6)
y ≤ yi ≤ y
''
i
'
i
yi ≥ yi*
where 𝑦𝑦𝑖𝑖" is the lowest value of 𝑦𝑦𝑖𝑖 , 𝑦𝑦𝑖𝑖∗ is the maximum acceptable value of 𝑦𝑦𝑖𝑖 ; r is the shape function for
desirability.
(III) For the nominal-the-best type:
di
y
i
Ci
yi
ci
− yi*
− yi''
s
− yi*
− yi'*
t
1
yi* ≤ yi ≤ ci
(7)
ci' ≤ yi ≤ yi*
yi > yi* or yi* > yi
where Ci is the most acceptable or target value and s and t are the exponential parameters that determine
the shape of desirability function. Overall desirability function of the multi-response system can be
measured by combining the individual desirability functions. It can be represented as 𝐷𝐷 =
(𝑑𝑑1𝑤𝑤1 . 𝑑𝑑2𝑤𝑤2 … . . 𝑑𝑑𝑛𝑛𝑤𝑤𝑤𝑤 ) ; where wj (0 ˂ wj ˂ 1) is the weight value given for the importance of jth response
variable and ∑𝑛𝑛𝑗𝑗=1 𝑤𝑤𝑗𝑗 = 1. The parameters settings with maximum overall desirability value are
considered to be the optimal parameter combination. In this study, the objective is to find optimal
362
parameters setting that maximize the overall desirability function for minimum surface roughness value
and dimensional shift. The ranges and targets of inputs parameters namely Ton, SV, Wd and FR and the
response characteristics surface roughness and dimensional shift are given in Table 6.
Table 6
Range of Input Parameters; SR and DS for Desirability
Constraint
Pulse-on Time (Ton)
Servo voltage (SV)
Wire depth (Wd)
Dielectric flow rate (FR)
SR (μm)
DS (μm)
Goal
in range
in range
In range
In range
Minimize
Minimize
Lower Limit
104
20
10
2
1.12
14
Upper Limit
112
40
30
6
3.52
54
Important
3
3
3
3
3
3
Table 7 shows the possible combination of WEDM process parameters that give the high value of
desirability. Corresponding to highest desirability, optimal combination of WEDM parameters for multi
performance characteristics are Ton 104µs; SV 40V; Wd 10µm and FR 2 L/min. Experimental value
obtained corresponding to optimal setting for SR and DS were 1.1 µm and 16 µm that are closer to the
predicted values in Table 7.
Table 7
Process parameters combination for high value of desirability
Process Parameters
Number
1
2
3
4
5
6
7
8
Ton
104.05
104.01
104
104
104
104
104
104
SV
39.96
39.97
40
39.97
40
39.99
40
40
Wd
10.02
10.27
11.08
11.4
11.97
10
10
10
Predicted Response
FR
2.03
2.09
2.09
2.06
2.37
2.72
2.88
4.64
SR
1.08917
1.09519
1.09999
1.09999
1.14347
1.16272
1.17614
1.2051
DS
13.9156
13.8076
14.1202
14.3722
14
12.6019
12.4514
13.8867
Desirability
1.000
1.000
0.998
0.995
0.988
0.982
0.979
0.970
6. Conclusions
In this study, trim cutting operation in WEDM has been performed on Nimonic 90: a nickel based super
alloy. Two performance characteristics namely surface roughness (SR) and dimensional shift (DS) for
WEDM of Nimonic-90 have been modelled and analyzed using Response Surface Methodology (RSM)
for trim cutting operation. Trim cutting operation has been performed to improve the machined surface
characteristics and dimensional accuracy after a rough cutting operation. Four process parameters namely
Ton, SV, Wd and FR have been selected as variable parameters; while other parameters were kept fixed
for trim cutting operation. Face centered central composite design has been adopted to carry out
experimental study.
Quadratic model has been proposed to determine the optimal combination of surface roughness and
dimensional shift. Using response surface graphs, the developed mathematical models are able to explain
the effect of process variables on performance characteristics efficiently. Increasing the value of Ton, Wd
and FR increases the surface roughness and dimensional shift but increases of SV decreases the both
surface roughness and dimensional shift. Using desirability function, a scale free quantity called
desirability has been obtained for two performance characteristics to optimize multi-performance
characteristics. Correspond to highest desirability, the optimal combination of discharge parameters was
Ton: 110 μs; SV 40V; Wd10 μm and FR 2 L/min. Confirmation experiments have proven the goodness
of the proposed models and desirability function approach.
Using SEM micrographs, effect of discharge energy on surface morphology has been examined. Average
thickness of recast layer varies from 6 μm to 12 μm was found on the machines surfaced after trim cutting
operation Present research approach is useful for achieving high productivity while maintain surface
V. Kumar et al. / International Journal of Industrial Engineering Computations 6 (2015)
363
roughness and geometrical accuracy within desire limits for machining complex and intricate shapes in
hard and exotic materials. Machining of Nimonic-90 with WEDM at optimized setting yields better
performance and more economic as compared to conventional processes that proves the potential of
WEDM in aerospace industries.
References
Arunachalam, R.M., Mannan, M.A., & Spowage, A.C. (2004). Surface integrity when machining age
hardened Inconel 718 with coated carbide cutting tools. International Journal of Machine Tools &
Manufacture, 44(14), 1481-1491.
Bhuyan, B.K., &Yadava, V. (2014). Experimental Study of Travelling Wire Electrochemical Spark
Machining of Borosilicate Glass. Materials and Manufacturing Processes, 29(3), 298-304.
Bobbili, R., Madhu, V., & Gogia, A.K. (2013).Effect of Wire-EDM Machining Parameters on Surface
Roughness and Material Removal Rate of High Strength Armor Steel. Materials and Manufacturing
Processes, 28(4), 364–368.
Cheng, X., Yang, X.H., Huang, Y.M., Zheng, G.M., & Li, L. (2014).Helical surface creation by wire electrical
discharge machining for micro tools. Robotics and Computer-Integrated Manufacturing, 30(3), 287–294.
Choudhury, I.A., & El-Baradie, M.A. (1998). Machinability of nickel-base super alloys- a general review.
Journal of Materials Processing Technology, 77(1-3), 278-284.
Cochran, G., & Cox, G.M. (1962). Experimental Design. Asia Publishing House, New Delhi.
Deringer, G.,& Suich, R. (1980). Simultaneous optimization of several response variables. Journal of Quality
Technology, 12(4), 214-219.
Ezugwu, E.O. (2005). Key improvements in the machining of difficult-to-cut aerospace alloys. International
Journal of Machine Tools & Manufacture, 45(12-13), 1353-1367.
Guo, Y.B., Li, W., & Jawahir, I.S. (2009). Surface integrity characterization and prediction in machining of
hardened and difficult-to-machine alloys-a state-of-art research review and analysis. Journal of Machine
Science & Technology, 13(4), 437- 470.
Gupta, K., & Jain, N.K. (2014). Analysis and optimization of micro-geometry of miniature spur gears
manufactured by wire electric discharge machining. Precision Engineering, 38(4), 728-737.
Han, F., Jiang, J., & Yu, D. (2007). Influence of machining parameters on surface roughness in finish cut of
WEDM. International Journal of Advance Manufacturing Technology, 34(5-6), 538-546.
Hewidy, M.S., El-Taweel, T.A., & El-Safty, M.F. (2005). Modeling the machining parameters of wire
electrical discharge machining of Inconel 601 using RSM. Journal of Materials Processing Technology,
169(2), 328–336.
Hood, R., Soo, S.L., Aspinwall, D.K., Andrews, P., & Sage, C. (2011). Twist drilling of Haynes 282
Superalloy, Procedia Engineering, 19, 150-155.
Huang, J.T., Liao, Y.S., & Hsue, W.J. (1999). Determination of finish- cutting operation and machining –
parameters setting in wire electrical discharge machining. Journal of Materials Processing Technology,
87(1-3), 69-81.
Jangra, K., Grover, Chan FTS, &Aggarwal, A. (2011). A Digraph and matrix method to evaluate the
machinability of tungsten carbide composite with wire EDM. International Journal of Advance
Manufacturing Technology, 2(3), 959-974.
Jangra, K., Grover, S., & Aggarwal, A. (2011). Simultaneous optimization of material removal rate and
surface roughness for WEDM of WC-Co composite using grey relational analysis along with Taguchi
method. International Journal of Industrial Engineering Computations, 2(3), 479–490.
Jangra, K. (2012). Study of unmachined area in intricate machining after rough cut in WEDM. International
Journal of Industrial Engineering Computations, 3(5), 887-892.
Jangra, K., & Grover, S. (2012). Modeling and experimental investigation of process parameters in WEDM
of WC- 5.3% Co using response surface methodology. Mechanical Science, 3, 63-72.
Jangra, K.K., Kumar, V., Kumar, V. (2014). An experimental and comparative study on rough and trim
cutting operation in WEDM of hard to machine materials. Procedia Materials Science, 5, 1603 – 1612.
Jangra, K.K. (2015). An experimental study for multi-pass cutting operation in wire electrical discharge
machining of WC- 5.3% Co composite. International Journal of Advance Manufacturing Technology, 76,
971-982.
364
Khanna, R., & Singh, H. (2013) Performance analysis for D-3 material using response surface methodology
on WEDM. International Journal of Machining and Machinability of Materials, 14, 45 – 65.
Klink, A., Guoa, Y.B., & Klocke, F. (2011).Surface integrity evolution of powder metallurgical tool steel by
main cut and finishing trim cuts in wire-EDM. Procedia Engineering, 19, 178-183.
Kortabarria, A., Madariaga, A., Fernandez, E., Esnaola, J.A., & Arrazola, P.J. (2011).A comparative study of
residual stress profiles on Inconel 718 induced by dry face turning, Procedia Engineering, 19, 228 – 234.
Krain, H.R., Sharman, A.R.C., & Ridgway, K. (2007). Optimisation of tool life and productivity when end
milling Inconel 718 TM. Journal of Material Processing Technology, 189(1-3), 153-161.
Kumar, V., Jangra, K., & Kumar, V. (2012). Effect of WEDM parameters on machinability of Nimonic90.Proceedings of the National Conference on Trends and Advances in Mechanical Engineering (TAME),
YMCA University of Science and Technology, 511-516.
Lee, S.H., & Li, X.P. (2003).Study of the surface integrity of the machined workpiece in the EDM of tungsten
carbide. Journal of Materials Processing Technology, 139(1-3), 315-321.
Li, L., Guo, Y.B., Wei, X. T., & Li, W. (2013). Surface integrity characteristics in wire-EDM of Inconel 718
at different discharge energy. Procedia CIRP, 6, 221 – 226.
Liao, Y.S., & Yu, Y.P. (2004). The energy aspect of material property in WEDM and its application. Journal
of Materials Processing Technology, 149(1-3), 77–82.
Myers, R.H., & Montgomery, D.H. (1995). Response surface methodology. Wiley, New York.
Puri, A.B., & Bhattacharyya, B. (2003). An analysis and optimisation of the geometrical inaccuracy due to
wire lag phenomenon in WEDM. International Journal Machine Tools & Manufacturing, 43(2), 151-159.
Puri, A.B., & Bhattacharyya, B. (2005). Modelling and analysis of white layer depth in a wire cut EDM
process through response surface methodology. International Journal of Advance Manufacturing
Technology, 25(3-4), 301-307.
Rebelo, J.C., Morao Dias, A., Kremer, D., & Lebrun, J.L. (1998). Influence of EDM pulse energy of on the
surface integrity of martensitic steel. Journal of Materials Processing Technology, 84(1-3) , 90-96.
Sarkar, S., Sekh, M., Mitra, S., & Bhattacharyya, B. (2008). Modeling and optimization of wire electrical
discharge machining of γ- TiAl in trim cutting operation. Journal of Materials Processing Technology,
205(1-3), 376-387.
Sarkar, S., Mitra, M., & Bhattacharyya, B. (2011). A novel method of determination of wire lag for enhanced
profile accuracy in WEDM. Precision Engineering, 35(2), 339-347.
Sharman, A.R.C., Hughes, J.I., & Ridgway, K. (2004). Workpiece Surface Integrity and Tool Life Issues
When Turning Inconel 718 TM Nickel Based Superalloy. Journal of Machine Science & Technology, 8(3),
399-414.
Sharma, N., Khanna, R., Gupta, R. D., & Sharma, R. (2013). Modeling and Multiresponse optimization on
WEDM for HSLA by RSM. International Journal of Advance Manufacturing Technology, 67(9-12),
2269-2281.
Soo, S.L., Hood, R., Aspinwall, D.K., Voice, W.E., & Sage, C. (2011). Machinability and surface integrity
of RR1000 nickel based super alloy. CIRP Annals- Manufacturing Technology, 60(1), 89–92.
Soo, S.L., Antar, M.T., Aspinwall, D.K., Sage, C., Cuttell, M., Perez, R., & Winn, A.J. (2013).The effect of
wire electrical discharge machining on the fatigue life of Ti-6Al-2Sn-4Zr-6Mo aerospace alloy. Procedia
CIRP, 6, 216-220.
Ulutan, D., &Ozel, T. (2011). Machining induced surface integrity in Titanium and Nickel Alloys-A review.
International Journal of Machine Tools & Manufacture, 51(3), 250-280.
Wang, C.C., Chow, H.M., Yang, L.D., & Lu, C.T. (2009). Recast layer removal after electrical discharge
machining via Taguchi analysis: a feasibility study. Journal of Materials Processing Technology, 209(8),
4134-4140.
Wei, X. (2002). Experimental study on the machining of a shaped hole Ni based super heat resistant alloy.
Journal of Material Processing Technology, 129(1), 143-147.
Yang, R.T., Tzeng, C.J., Yang, Y.K., & Hsieh, M.H. (2012).Optimization of wire electrical discharge
machining process parameters for cutting tungsten. International Journal of Advance Manufacturing
Technology, 60(1-4), 135-147.