Study of correlation and path analysis for green pod yield and its contributing traits in vegetable pea (Pisum sativum L.)
Bạn đang xem bản rút gọn của tài liệu. Xem và tải ngay bản đầy đủ của tài liệu tại đây (244.36 KB, 6 trang )
Int.J.Curr.Microbiol.App.Sci (2018) 7(6): 3497-3502
International Journal of Current Microbiology and Applied Sciences
ISSN: 2319-7706 Volume 7 Number 06 (2018)
Journal homepage:
Original Research Article
/>
Study of Correlation and Path Analysis for Green Pod Yield and Its
Contributing Traits in Vegetable Pea (Pisum sativum L.)
P.K. Kumawat1*, P. Singh2, D. Singh3, S. Mukherjee4 and Mamta Kumawat5
1
2
Agriculture Officer- Jobner, A.D. Jhotwara, Jobner, DOA, Govt. of Rajasthan, India
Horticulture, 3PBG, S.K.N. College of Agriculture, (SKNAU) Jobner, Rajasthan, India
4
Horticulture, RARI, Durgapura (SKNAU, Jobner), Jaipur, Rajasthan, India
5
Bhhichawa, A.D. Kuchamancity, Nagaur, DOA, Govt. of Rajasthan, India
*Corresponding author
ABSTRACT
Keywords
Pea, Green pod
yield, Correlation,
Path analysis
Article Info
Accepted:
25 May 2018
Available Online:
10 June 2018
Correlation at genotypic and phenotypic levels along with path coefficient analysis were
studied for various yield and its component characters in twenty genotypes of pea (Pisum
sativum L.) during rabi, 2009-10. Analysis of variance revealed significant difference for
all the characters indicating the presence of good amount of variability in the genotypes
studied. Correlation studies revealed that green pod yield per plant was positively and
significantly associated with pod length, pod weight and number of grains per pod. Path
coefficient analysis revealed that traits like number of pods per plant, pod weight, number
of grains per pod, number of pickings and protein content were the important characters
for selection of high yielding genotypes as they exerted high positive direct effect as well
as positive correlation with green pod yield per plant. The result suggested that these traits
could be considered as major yield contributing traits in pea.
Introduction
Pea (Pisum sativum L.) is an important crop
grown throughout the world. In India, it is
grown mainly as winter vegetable in the plains
of North India and as summer vegetable in the
hills. Pea is used as fresh vegetable, canned,
processed or dehydrated and seeds are
consumed as pulse. Green pods are highly
nutritive, containing high percentage of
digestible protein (7.2%), carbohydrates
(19.8%) and minerals (0.8%) (Aykroyd,
1963). Correlation coefficient is a statistical
measure, which is used to find out the degree
and direction of relationship between two or
more variables. It measures the mutual
relationship between various plant characters
and determines the component characters on
which selection can be exercised for genetic
improvement in yield. Path coefficient
analysis (Wright, 1921) is an important tool
for partitioning the correlation coefficients
into direct and indirect effects of independent
variables on dependent variable. It has been
widely used to identify traits that have
significant effect on yield for potential use in
3497
Int.J.Curr.Microbiol.App.Sci (2018) 7(6): 3497-3502
selection. Keeping in view the study was
conducted to find out correlation at genotypic
and phenotypic levels and path coefficient
analysis for yield and its contributing traits in
pea.
Wright (1921) and elaborated by Dewey and
Lu (1959) at both phenotypic and genotypic
levels.
Materials and Methods
The analysis of variance indicated significant
differences among the genotypes for all the
observed characters which indicated that high
amount of genetic variability was present in
the genetic material.
The present investigation was carried out at
Experimental
farm,
Department
of
Horticulture, S.K.N. College of Agriculture,
Jobner, Rajasthan during rabi 2009–10. the
experimental material consisted of twenty
diverse pea genotypes namely, AP-1, AP-3,
Arkel, VRP-5, VRP-6, VRP-7, VRP-16, VRP22, VRP-90, VRP-135, VRP-138, VRP-147,
VRP-158, VRP-179, VRP-216, VRP-219,
VRP-238, VRP-330, VRP-343 and EC-9126.
Experiment was laid out in randomized block
design with three replications. The seeds were
sown at a spacing of 30 cm x 10 cm.
Recommended agronomic practices and plant
protection measures were followed to
maintain optimum plant stand. The
observations were recorded on five randomly
selected competitive plants from each plot in
every replication for the traits viz. plant height
(cm), days to first flowering, days to 50 %
flowering, days to first fruit setting, days to
first pod picking, number of pods per plant,
pod length (cm), pod weight (g), number of
grains per pod, number of pickings, pod yield
per plant (g), pod yield per hectare (q), TSS of
green seeds (%) and protein content in pods
(%). The data were averaged and statistically
analyzed for analysis of variance as per the
method suggested by Panse and sukhatme
(1995). The genotypic and phenotypic
correlation coefficients were calculated from
the genotypic and phenotypic covariances and
variances as described by Singh and
Choudhary (1977) and as per formula given
by Johnson et al., (1955). The estimates of
direct and indirect effect were calculated by
the path coefficient analysis as suggested by
Results and Discussion
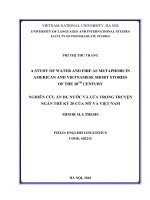
The correlation studies revealed that in general
estimates of genotypic correlation coefficients
were higher than the corresponding
phenotypic correlation coefficients, which
indicated a strong inherent association among
different traits under study (Table 2). The
lower phenotypic values might be due to
environmental interactions. A significant
positive correlation of pod yield per plant was
observed with pod weight (0.469), pod length
(0.395) and number of grains per pod (0.393)
at phenotypic level and with number of grains
per pod (0.764), pod length (0.664), pod
weight (0.542) and number of pickings (0.377)
at genotypic level, which, suggested that these
characters could be considered as major green
pod yield contributing characters in pea.
Similar results were earlier obtained by
Chaudhary and Sharma (2003), Sureja and
Sharma (2004), Choudhary et al., (2004),
Singh and Singh (2005), Nawab et al., (2008)
and Guleria, Chongtham and Dua (2009).
Pod yield per plant registered significant and
negative correlation with days to first
flowering (-0.326) and days to first pod
picking (-0.369), which, indicated that
selection should be practiced for less days to
flowering and first fruit setting (earliness).
The results were in accordance with the
findings of Chaudhary and Sharma (2003),
Choudhary et al., (2004) and Sureja and
Sharma (2004).
3498
Int.J.Curr.Microbiol.App.Sci (2018) 7(6): 3497-3502
Table.1 Phenotypic correlation coefficients (upper diagonal) and genotypic correlation coefficients (lower diagonal) between different
traits in pea
S. No.
Traits
PH
DFF
50% F
DFFS
DFPP
P/P
PL
PW
G/P
Picking
TSS
Protein
Y/P
Y/ha
1
PH
1.000
0.559**
0.657**
0.631**
0.712**
0.739**
-0.477**
-0.649**
-0.265
-0.602**
0.435**
-0.136
-0.096
-0.039
2
DFF
0.597
1.000
0.933**
0.896**
0.944**
0.274
-0.200
-0.483**
-0.0811
-0.699**
0.3643*
0.221
-0.326*
-0.251
3
50% F
0.694
0.935
1.000
0.961**
0.953**
0.437**
-0.299
-0.594**
-0.142
-0.614**
0.324*
0.166
-0.318
-0.243
4
DFFS
0.686
0.912
0.977
1.000
0.936**
0.471**
-0.349*
-0.649**
-0.220
-0.665**
0.437**
0.136
-0.369*
-0.292
5
DFPP
0.751
0.949
0.955
0.951
1.000
0.459**
-0.304
-0.595**
-0.116
-0.759**
0.438**
0.130
-0.271
-0.182
6
P/P
0.933
0.364
0.561
0.573
0.578
1.000
0.517**
-0.785**
-0.345*
-0.380*
0.342*
-0.182
0.070
0.106
7
PL
-0.666
-0.293
-0.415
-0.499
-0.421
-0.779
1.000
0.602**
0.664**
0.318
-0.259
0.342*
0.395*
0.366*
8
PW
-0.828
-0.601
-0.739
-0.791
-0.734
-0.835
0.966
1.000
0.488**
0.475**
-0.368*
0.177
0.469**
0.438**
9
G/P
-0.475
-0.140
-0.236
-0.351
-0.195
-0.527
0.815
0.776
1.000
0.225
-0.306
0.182
0.393*
0.400*
10
Picking
-0.664
-0.735
-0.643
-0.693
-0.792
-0.421
0.363
0.587
0.285
1.000
-0.632**
0.102
0.246
0.164
11
TSS
0.583
0.454
0.397
0.528
0.543
0.506
-0.325
-0.576
-0.419
0.745
1.000
-0.013
-0.151
-0.100
12
Protein
-0.255
0.308
0.216
0.194
0.172
-0.163
0.517
0.168
0.231
0.092
-0.065
1.000
0.234
0.246
13
Y/P
-0.211
-0.488
-0.440
-0.511
-0.378
-0.017
0.664
0.542
0.764
0.377
-0.271
0.296
1.000
0.986**
14
Y/ha
-0.125
-0.329
-0.331
-0.398
-0.252
0.043
0.599
0.485
0.760
0.257
-0.188
0.310
0.977
1.000
PH = Plant height (cm), DFF = Days taken to first flowering, 50% F = Days to 50% flowering, DFFS = Days to first fruit setting, DFPP = Days to first pod
picking, P/P = Number of pods/plant, PL = Pod length (cm), PW = Pod weight (g), G/P = Number of grains/pod, Pickings = Number of pickings, Y/P =
Yield/plant (g), Y/ha = Yield/hectare (q), TSS = T.S.S. of green seeds (%), Protein = Protein content in pods (%).
** Significant at P = 0.01 level of significance
* Significant at P = 0.05 level of significance
3499
Int.J.Curr.Microbiol.App.Sci (2018) 7(6): 3497-3502
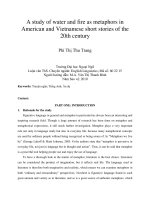
Table.2 Direct (diagonal) and indirect effects of different characters on pod yield per plant in pea at genotypic and phenotypic level
Characters
PH
DFF
50% F
I-FS
I-PP
P/P
PL
PW
G/P
Pickings
TSS
Protein
PH
DFF
50% F
I-FS
I-PP
P/P
PL
PW
G/P
Pickings
TSS
Protein
correlation with Y/P
P
0.4528
-0.5318
0.0209
-0.1673
0.5764
-0.0355
-0.1261
-0.2356
-0.0149
0.0086
-0.0087
-0.0351
-0.0964
G
-0.4653
-0.7433
0.0790
-0.5402
1.5880
1.1873
0.1924
-1.2532
-0.0543
-0.0601
-0.0417
-0.0993
-0.2108
P
0.2535
-0.9500
0.0297
-0.2377
0.7644
-0.0132
-0.0528
-0.1752
-0.0046
0.0099
-0.0073
0.0571
-0.3261*
G
-0.2779
-1.2447
0.1063
-0.7184
2.0045
0.4630
0.0847
-0.9102
-0.0160
-0.0666
-0.0325
0.1196
-0.4882**
P
0.2975
-0.8859
0.0318
-0.2548
0.7721
-0.0210
-0.0789
-0.2157
-0.0080
0.0087
-0.0065
0.0429
-0.3179
G
-0.3232
-1.1636
0.1137
-0.7698
2.0182
0.7137
0.1200
-1.1196
-0.0270
-0.0582
-0.0284
0.0840
-0.4402**
P
0.2857
-0.8513
0.0306
-0.2652
0.7578
-0.0226
-0.0921
-0.2357
-0.0124
0.0095
-0.0088
0.0352
-0.3694*
G
-0.3192
-1.1353
0.1111
-0.7876
2.0094
0.7285
0.1444
-1.1976
-0.0400
-0.0627
-0.0378
0.0755
-0.5113**
P
0.3223
-0.8966
0.0303
-0.2482
0.8099
-0.0221
-0.0802
-0.2161
-0.0065
0.0108
-0.0088
0.0336
-0.2715
G
-0.3497
-1.1807
0.1086
-0.7489
2.1131
0.7355
0.1218
-1.1119
-0.0222
-0.0717
-0.0389
0.0668
-0.3783*
P
0.3347
-0.2608
0.0139
-0.1249
0.3721
-0.0481
0.1365
-0.2851
-0.0194
0.0054
-0.0069
-0.0469
0.0705
G
-0.4343
-0.4531
0.0638
-0.4510
1.2218
1.2720
0.2251
-1.2638
-0.0601
-0.0381
-0.0362
-0.0635
-0.0175
P
-0.2162
0.1900
-0.0095
0.0925
-0.2460
-0.0248
0.2641
0.2187
0.0375
-0.0045
0.0052
0.0884
0.3952*
G
0.3099
0.3649
-0.0472
0.3936
-0.8907
-0.9910
-0.2889
1.4627
0.0931
0.0329
0.0233
0.2010
0.6636**
P
-0.2939
0.4584
-0.0189
0.1722
-0.4821
0.0377
0.1591
0.3630
0.0275
-0.0068
0.0074
0.0461
0.4699**
G
0.3852
0.7483
-0.0841
0.6230
-1.5519
-1.0617
-0.2791
1.5140
0.0886
0.0532
0.0412
0.0653
0.5420**
P
-0.1199
0.0770
-0.0045
0.0584
-0.0939
0.0166
0.1755
0.1772
0.0564
-0.0032
0.0061
0.0469
0.3926*
G
0.2215
0.1746
-0.0269
0.2764
-0.4112
-0.6699
-0.2356
1.1750
0.1141
0.0258
0.0300
0.0899
0.7637**
P
-0.2726
0.6643
-0.0195
0.1763
-0.6146
0.0183
0.0839
0.1727
0.0127
-0.0142
0.0127
0.0264
0.2464
G
0.3091
0.9152
-0.0731
0.5455
-1.6740
-0.5359
-0.1049
0.8895
0.0325
0.0905
-0.0534
0.0358
0.3769*
P
0.1968
-0.3461
0.0103
-0.1158
0.3544
-0.0166
-0.0685
-0.1338
-0.0172
0.0090
-0.0201
-0.0035
-0.1510
G
-0.2712
-0.5656
0.0452
-0.4159
1.1476
0.6437
0.0940
-0.8721
-0.0478
0.0675
-0.0716
-0.0254
-0.2715
P
-0.0615
-0.2100
0.0053
-0.0362
0.1054
0.0087
0.0903
0.0648
0.0102
-0.0015
0.0003
0.2583
0.2342
G
0.1188
-0.3829
0.0246
-0.1530
0.3630
-0.2077
-0.1494
0.2545
0.0264
0.0083
0.0047
0.3887
0.2961
PH = Average plant height (cm), DFF = Days taken to first flowering, 50% F = Days to 50% flowering, I-FS = Days to first fruit setting, I-PP = Days to first pod picking, P/P =
Average number of pods per plant, PL = Average pods length (cm), PW = Average pod weight (g), G/P = Average number of grains per pod, Pickings = Average number of
pickings, Y/P = Average yield per plant (g), Y/ha = Average yield per hectare (q), TSS = T.S.S. of green seeds ( 0B), Protein = Protein content in pods (%)
** significant at P = 0.01 level of significance
* significant at P = 0.05 level of significance
Residual effects: phenotypic = 0.511, genotypic = -0.358
(Note: Diagonal values are direct effect.)
3500
Int.J.Curr.Microbiol.App.Sci (2018) 7(6): 3497-3502
Therefore, it can be concluded that, during
selection of high yielding genotypes in pea
major emphasis should be given on pod
weight, pod length, number of grains per pod,
days to first fruit setting and days to first
flowering as these are significantly associated
with pod yield hense, these characters could
be considered reliable indices for selection, to
enhance the pod yield.
Path coefficient analysis revealed that, days
taken to first pod picking exhibited maximum
positive direct effect on green pod yield per
plant (2.1131) at genotypic level followed by
average pod weight (1.5140), number of pods
per plant (1.2720), protein content (0.3887),
average number of grains per pod (0.1141),
days taken to 50 per cent flowering (0.1137)
and average number of pickings (0.0905). The
present findings was in close proximately to
the earlier work done by Natarajan and
Arumugam (1980); Singh et al., (1992); and
Usmani and Dubey (2007). The highest
negative direct effect was exerted by days
taken to first flowering, followed by days to
first fruit setting, plant height, average pod
length and TSS of green seeds. These results
were in partial agreement with those of Sureja
and Sharma (2004) for appearance of first
flower, by Sharma et al., (2007) for TSS and
by Sardana et al., (2007) for plant height.
Days to 50 per cent flowering exhibited
maximum positive indirect effect on pod yield
per plant via days to first pod picking, number
of pods per plant, pod length and protein
content at genotypic level. Days to first pod
picking had positive indirect effect through
number of pods per plant, pod length, days to
50 per cent flowering and protein content.
Average number of pods per plant had
positive indirect effect on pod yield through
days to first pod picking, pod length and days
to 50 per cent flowering. Average pod weight
exhibited positive indirect effect via days to
first flowering, days to first fruit setting, plant
height, number of grains per pod, protein
content, number of pickings and TSS of green
seeds.
Average number of pickings had positive
indirect effect on pod yield through days to
first flowering, average pod weight, days to
first fruit setting, plant height, protein content
and number of grains per pod. Whereas,
protein content exerted positive indirect effect
via day to first pod picking average pod
weight, plant height, number of grains per
pod, days to 50 per cent flowering, number of
pickings and TSS of green seeds. The residual
effect at phenotypic (0.511) and genotypic (0.358) levels was very low which indicated
that the green pod yield per plant was
ultimately the result of the traits under study
having adequate variability.
Keeping in view the estimates of correlation
coefficient
and
direct
and
indirect
contribution of component traits toward pod
yield per plant, indirect selection practices on
the basis of days taken to first pod picking,
average pod weight, number of pods per
plant, protein content, number of grains per
pod, days to 50 per cent flowering and
number of pickings would be rewarding in the
genotypes under study enhancing the pod
yield per plant as well as per hectare.
References
Aykroyd, WR. 1963. ICMR Special Republic
Series. No. 42.
Burton, GW. 1952. Quantitative inheritance
in grasses. Proc. 6th International
Grassland congress. pp. 277-283.
Burton, GW and De Vane, EM. 1953.
Estimating heritability in tall fescue
(Festuca arundinacea) from replicated
clonal material. Agronomy Journal 45:
478-487.
Chaudhary, DK and Sharma, RR. 2003.
Genetic variability, correlation and
3501
Int.J.Curr.Microbiol.App.Sci (2018) 7(6): 3497-3502
path analysis for green pod yield and
its component in garden pea. Indian
Journal of Horticulture 60 (3): 251256.
Choudhary, DK, Sharma, RR and Sureja, AK.
2004. Correlation and path analysis
studies across the generations in
garden pea. Indian Journal of
Horticulture 61(2): 163-167.
Guleria, Sonali, Chongtham, Nirmala and
Dua, Saroj (2009). Correlation and
path in pea. Crop Research (Hisar) 38
(1): 179-183.
Gupta, AJ, Singh, YU and Verma, TS. 2006.
Genetic variability and heritability in
garden pea (Pisum sativum L.). Indian
Journal of Horticulture 63 (3): 332334.
Hanson, C.H, Robinson, HF and Comstock,
RE. 1956. Biometrical studies on yield
in segregating population of Korean
Lespedeza. Agronomy Journal, 48:
262-272.
Johnson, HW, Robinson, HF and Comstock,
RE. 1955. Estimates of genetic and
environmental variability in soybeans.
Agronomy Journal 47: 314-318.
Kaur, H, Singh, M and Brar, PS. 2007.
Genetic variability in pea (Pisum
sativum L.). Journal of Research,
Punjab Agriculture University 44 (4):
301-303.
Nawab, NN, Subhani, GM, Mahmood, K,
Shakil, Q and Saeed, A. 2008. Genetic
variability correlation and path
analysis studies in garden pea (Pisum
sativum L.). Journal of Agricultural
Research (Pakistan) 46 (4): 333-340.
Panse, VG and Sukhatme, PV. 1995.
Statistical Methods for Agricultural
Workers. ICAR, New Delhi.
Sardana, S, Mahajan, RK, Gautam, NK and
Ram, B. 2007. Genetic variability in
pea (Pisum sativum L.) germplasm for
utilization. SABRAO Journal of
Breeding and Genetics 39 (1): 31-41.
Sharma, A, Sood, M, Rana, A and Singh, Y.
2007.
Genetic
variability
and
association studies for green pod yield
and component horticultural traits in
garden pea under high hill dry
temperate conditions. Indian Journal
of Horticulture 64 (4): 410-414.
Singh, J D and Singh, I P. (2005). Studies on
correlation and path coefficient
analysis in field pea (Pisum sativum
L.). National Journal of Plant
Improvement. 7 (1): 59-60.
Singh, RK and Choudhary, BD. 1977.
Variance and Covariance analysis.
Biometrical methods in quantitative
genetic analysis. Kalyani Publisher,
Ludhiana (Rev. Ed., 1985). pp: 39-68.
Sureja, AK and Sharma, RR. 2000. Genetic
variability and heritability studies in
garden pea (Pisum sativum L.). Indian
Journal of Horticulture 57 (3): 243247.
Sureja, AK and Sharma, RR. 2004. Path
analysis for yield and its attributes in
garden pea (Pisum sativum L. sub sp.
hortense Asch and Graebn). Indian
Journal of Horticulture 61 (1): 42-45.
How to cite this article:
Kumawat, P.K., P. Singh, D. Singh, S. Mukherjee and Mamta Kumawat. 2018. Study of
Correlation and Path Analysis for Green Pod Yield and Its Contributing Traits in Vegetable Pea
(Pisum sativum L.). Int.J.Curr.Microbiol.App.Sci. 7(06): 3497-3502.
doi: />
3502