A study on drought in the South-central Region: Detection from the observation and the bias-correction rainfall projections of national climate change scenarios
Bạn đang xem bản rút gọn của tài liệu. Xem và tải ngay bản đầy đủ của tài liệu tại đây (776.44 KB, 10 trang )
Vietnam Journal of Hydrometeorology, ISSN 2525-2208, Volume 01: 20 - 29
Research Paper
A STUDY ON DROUGHT IN THE SOUTH-CENTRAL REGION:
DETECTION FROM THE OBSERVATION AND THE BIAS-CORRECTION RAINFALL PROJECTIONS OF NATIONAL CLIMATE
CHANGE SCENARIOS
Mai Kim Lien1, Tran Duy Hien2
ARTICLE HISTORY
Received: March 15, 2018; Accepted: April 20,
2018 Publish on: December 25, 2018
ABSTRACT
This article presents the results of detecting
the trend of drought conditions in the South-Central region based on the past observation and
bias-correction rainfall projections. The past observation of daily rainfall is updated up to 2017
and collected from Vietnam Meteorological and
Hydrological Administration. The bias-correction daily rainfall projections are collected from
Vietnam Institute of Meteorology, Hydrology and
Climate change (IMHEN) during the periods of
1986 - 2005, 2016 - 2035, 2036 - 2065 and 2080
- 2099 according to both RCP4.5 and RCP8.5
scenarios. The Standardized Precipitation Index
(SPI) and minimum value of SPI (SPI_min) are
used to define the mean drought condition and
the most extreme drought condition. The past
trend of drought conditions is found that the decreasing trends of mean drought condition and
increasing trends of the severity level. The future
trend of drought conditions according to both
RCP4.5 and RCP8.5 is found that it is similar to
the past trend. Where, the mean drought condition is generally found by slight decreasing
trends. However, the most extreme of drought
condition is significantly found by increasing
trends of drought at shorter timescales (1- and
3-month time scales).
Keywords: Drought condition, extreme
drought, SPI, SPI_min, South-Central region.
20
MAI KIM LIEN
1
Department of Climate Change, MONRE
2
Science and Technology, MONRE
1. Introduction
Comparing with other climatic regions, the
South - Central region has lowest dry seasonal
rainfall. The dry season in the South-Central is
longer than in other regions that mostly ranged
from December (in the previous year) to August
(in the next year). The climatology peak of the
dry season is from January to March. Especially,
the dry/drought condition in the South-Central
region is known as having the strongest intensity
in Vietnam (Ngu and Hieu, 2004).
As above mentioned, the dry/drought condition extremely has impacted on socio-economic
sectors, environment and human life. Thus,
many studies were focused on the dry/drought
condition in the South- Central region. Thang et
al. (2007) showed the very extreme drought
events that ever occurred during 1980 - 2005 in
the South - Central region as listed in 1983, 1993
and 1998. Where, extreme winter - spring
drought events occurred in 1983, 1993, 1998 and
summer - autumn drought in 1982, 1985, 1988,
1993 and 1998. Especially, the very extreme
drought event in the dry season 2015 - 2016 due
to impacts of El Nino event (DWR, 2016).
Recent years, the global warming issue is
considered as the major factor for increasing extreme events in terms of frequency and intensity
(IPCC, 2007, 2013). In Vietnam, many climate
changes scenarios have been published by Ministry of Natural resources and Environment
(MONRE) since 2009 (MONRE, 2009, 2012,
2016). These scenarios showed the increasing
A study on drought in the South - Central region: Detection from the observation
and the bias - correction rainfall projections of national climate change scenarios
trend of temperature in the future according to
GHG scenarios.
In 2016, MONRE published the “Climate
change and sea level rise scenarios for Vietnam”
based on the calculations of IMHEN (IMHEN,
2016). Where, the information of temperature
and rainfall as well as some of its extreme events
that can be found. However, the very important
information is drought condition is not detected.
Thus, the drought condition detected by these
bias-corrected rainfall projections is very important information for implementing responding to
climate change. Especially, the information related to the drought projection is significantly required for assessment of climate change on many
important sectors. From these mentioned above,
we try to detect the drought projection for the
South-Central region that is calculated by the
bias-correction rainfall collected from IMHEN
(2016).
2. Data and method
2.1. Data collected
In this study, we collected daily rainfall for
11 stations (Table 1) from sources as listed as:
- Daily rainfall observed: The 1975-2017
daily rainfall is collected from VMHA.
- Daily rainfall projected according to
RCP4.5 and RCP8.5 scenarios: In this study, the
bias-correction daily rainfall for 1980 - 2005,
2046 - 2065 and 2080 - 2099 is collected from
IMHEN (IMHEN, 2016). The Table 2 presents
the number of the projections that are used in this
study.
Table 1. List of stations used in the study
No.
1
2
3
4
5
6
7
8
9
10
11
Name of station
Da Nang
Tam Ky
Tra My
Ba To
Quang Ngai
Hoai Nhon
Quy Nhon
Son Hoa
Tuy Hoa
Nha Trang
Cam Ranh
Longitude
108.18
108.5
108.21
108.71
108.78
109.01
109.21
108.98
109.28
109.2
109.16
Latitude
16.03
15.55
15.35
14.76
15.13
14.53
13.76
13.05
13.08
12.25
11.95
Table 2. Simulations and projections used in the study (IMHEN, 2016)
No.
Regional climate models Global climate models
(RCMs)
(GCMs)
1
ACCESS1-0
2
CCSM4
3
4
CCAM
GFDL-CM3
MPI-ESM-LR
6
NorESM1-M
8
9
RegCM
PRECIS
10km
CNRM-CM5
5
7
Resolution of RCMs
ACCESS1-0
20km
NorESM1-M
HadGEM2-ES
10
GFDL-CM3
11
CNRM-CM5
25km
12
CLWRF
NorESM1-M
30km
13
MRI-20km_A
NCAR-SST
20km
14
MRI-20km_B
HadGEM2- SST
15
MRI-20km_C
GFDL - SST
16
MRI-20km_D
T h p SST
21
Mai, K.L and Tran, D.H
2.2 Methods of study
Definition of the drought condition:
The Standardized Precipitation Index (SPI) is
used to define the drought condition (WMO,
2012). The SPI was designed to quantify the precipitation deficit for multiple timescales. These
timescales reflect the impact of drought on the
availability of the different water resources. Soil
moisture conditions respond to precipitation
anomalies on a relatively short scale. Groundwater, streamflow and reservoir storage reflect
the longer-term precipitation anomalies. For
these reasons, McKee et al. (1993) originally calculated the SPI for 3-, 6-,12-, 24- and 48-month
timescales.
The SPI calculation for any location is based
on the long-term precipitation record for a desired period. This long-term record is fitted to a
probability distribution, which is then transformed into a normal distribution so that the
mean SPI for the location and desired period is
zero (Edwards and McKee, 1997). Positive SPI
values indicate greater than median precipitation
and negative values indicate less than median
precipitation. Because the SPI is normalized,
wetter and drier climates can be represented in
the same way; thus, wet periods can also be
monitored using the SPI.
In recent years, the SPI for 3-, 6-,12-, 24- and
48-month timescales are used to define the
drought condition of many types of drought as
Meteorological, Agriculture and Hydrological
drought conditions, respectively (WMO, 2012;
Liu et al., 2013; James et al., 2015; Marzena
Osuch et al., 2016; Dongwoo Jang, 2018).
SPI is defined by the below equation (WMO,
2012):
SPI
R R
(1)
where is the standard deviation of rainfall;
R and R are the rainfall and climatology rainfall,
respectively.
In general, the drought condition occurs when
the SPI<0 (Thang et al., 2007; Tri et al., 2015;
WMO, 2012). In this study, the extreme drought
22
event is defined by the minimum value of the
SPI (called as SPI_min). Thus, the trend of
SPI_min means that the trend of the most extreme drought condition is defined.
As mentioned above, the drought and extreme drought conditions are considered for
many timescales of 1-, 3-, 6- and 12-month
(SPI_1, SPI_3, SPI_6 and SPI_12). As mentioned by WMO (2012) and many studies
(Thang et al, 2007; Tri et al., 2015), we can define many types of drought based on the
timescales of SPI as:
- SPI_1: Meteorological drought
- SPI_3 and SPI_6: Agriculture drought;
- SPI_12: Hydrological drought.
Definition of the drought trend:
For identifying the drought trend in the
South-Central, we use the simple linear regression equation as used in many studies (IPCC,
2007, 2013; MONRE, 2009, 2012, 2016; Thang
et al., 2015).
Given a data set X: x 1, x 2, x 3,…, x n of n statistical units.
Consider the simple linear equation:
xt = b0 +b1t
(2)
where
n
b1
t 1
( xt
n
x)( t t )
(t t ) 2
t 1
b0 x b1t
We can find:
- b1: the slope of the fitted line (linear
changing rate)
- b o: mean value mass of the data points
From that, we can find the increase/decrease
rate of the duration study as: D=b1n
(3)
where n is sample sizes.
We can define the correlation coefficient (rxt):
Definition of the change rate of projection:
The change of projection is defined by comparing the future SPI (or SPI_min) with baseline
SPI (or SPI_min). These two future periods are
the period of 2046 - 2065 and 2080 - 2099. The
baseline period is 1986 - 2005. The change of
A study on drought in the South - Central region: Detection from the observation
and the bias - correction rainfall projections of national climate change scenarios
SPI (or SPI_min) is defined by the below equation as:
*
*
SPI future
-SPI1986-2005
future
*
SPI1986-2005
Where SPIfuture is the future change rate
(%) of SPI (or SPI_min); SPI*future and SPI*19862005 are the future SPI (or SPI_min) and past SPI
(or SPI_min), respectively.
In this study, the SPI index is calculated by
mean ensemble of the bias-correction rainfall
projections for each scenario and each period.
3. Results of study
3.1 Assessment of the past drought condition
in the South - Central region
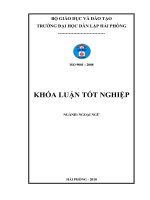
Results of the 1975 - 2017 trend of the SPI at
timescales are presented in the Fig.1. In general,
the increasing trend of SPI is found at most of
stations. The increasing rate of SPI is found from
0.02 to 0.06/decade. In which, the increasing rate
of longer timescales is higher than shorter
timescales. This trend means that the decrease
(b)
(a)
trend of mean drought condition at all
timescales. This decreasing trend of the mean
drought condition is ordered by the increase
trend of the rainfall projection (see more trend
of rainfall in MONRE, 2016).
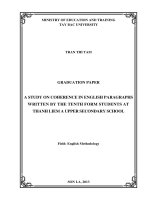
Remarkably, the important result is that the
increase trend of the extreme drought condition
is found (Fig. 2). As Fig. 2, we can find the significant decrease trend of SPI index at 1- and 3month timescales. The decrease rate of SPI_min
index at these two timescales is mostly from 0.02
to 0.06/decade at most stations. For 6-month
timescale, the decrease trend of the SPI_min is
only found at stations in the southern part of the
South-Central. However, the increase trend is
found at all stations (Fig. 2).
From these above analyses, the mean drought
condition at all timescales is found as decreasing in intensity according to the increase of rainfall. However, the most extreme of drought at
timescales from 1- to 3-month is found that increasing in intensity.
(d)
(c)
Fig. 1. The change rate of the SPI index (unit/decade): (a) SPI_1, (b) SPI_3, (c) SPI_6 và (d)
SPI_12
(a)
(b)
(c)
(d)
Fig. 2. SPI_Min: (a) SPI_1, (b) SPI_3, (c) SPI_6 và (d) SPI_12
23
Mai, K.L and Tran, D.H
3.2 The projections of drought condition according to scenarios
3.2.1 Drought condition projections for 2016
- 2035
The Fig.3 shows the results of the changes in
SPI (%) of 2016 - 2035 compared with baseline
period at 1-, 3-, 6- and 12-month timescales. We
clearly find increasing trends of SPI at all
timescales. These results show that the mean
drought condition in the South-Central region is
expected to decrease compared with the baseline
period. In general, the SPI of the 2016 - 2035
projected to increase by from 0 to 0.8% compared with the baseline period. The increasing
rate of the shorter timescales (1- and 3-month) is
smaller than longer timescale (6- and 12-month).
Comparing the Fig. 4 with the Fig. 3, according to both RCP4.5 and RCP8.5 scenarios, the
significant difference between trend of SPI and
SPI_min can be found. Meanwhile, SPI is defined by increasing trend of projections for all
timescales at all stations as shown in the Fig.3. In
contrast, SPI_min at 1- to 6-month timescales is
defined by an obvious decreasing trend of projections at stations in the central and southern
areas of the South - Central region as shown in
the Fig.4. Comparing with the baseline period,
the decreasing rate of the SPI_min from 2016 to
2035 is identified from 0 to 0.2%. Where, the
higher decrease rate of SPI_min is found by projection according to the RCP8.5 (Fig. 4).
These results indicate that the mean drought
condition in the South-Central during 2016 2035 is expected to decrease compared with the
baseline period. However, the severity of
drought condition is expected to increase at the
central and southern stations, especially on the
shorter timescales. The increasing trends of extreme drought at shorter timescales are found by
both RCP4.5 and RCP8.5 projection scenarios.
Although, the very long timescale (12-month),
the increasing trend of extreme drought is not
found by these projections.
(a)
(b)
(c)
(d)
(e)
(f)
(g)
(h)
Fig. 3. Changes in SPI index (%) at timescales calculated from bias-correction rainfall for
2016-2035 compared with baseline period according to RCP4.5 (above maps) and RCP8.5
(below maps) scenarios: SPI_1 (a, e), SPI_3 (b, f), SPI_6 (c, g) and SPI_12 (d, h)
24
A study on drought in the South - Central region: Detection from the observation
and the bias - correction rainfall projections of national climate change scenarios
(a)
(b)
(c)
(d)
(e)
(f)
(g)
(h)
Fig. 4. SPI_Min: SPI_1 (a, e), SPI_3 (b, f), SPI_6 (c, g) and SPI_12 (d, h)
3.2.2 Drought condition projections for the
period of 2046 - 2065
For the mid -21st century (2036 - 2065) (Fig.
5 and Fig. 6), the trend projections of SPI and
SPI_min are similar to that of the 2016 - 2035
period examined by both RCP4.5 and RCP8.5
scenarios.
In general, the mean drought condition of the
2036 - 2065 period in the South - Central region
is found less than the baseline period. The increasing rate of SPI is found from 0.2 to 0.8%
compared with the baseline period. The most increasing rate is found by the SPI at the longer
timescales (Fig. 5).
The interesting results that the severity extreme of the drought condition defined by
SPI_min is shown in Figure 6. As expected for
the beginning period of the 21st century, the
trend of SPI_min is found by decreasing trends
at most of stations in the central and southern
part of the South-Central region, especially for
drought condition at the shorter timescales. The
decreasing rate of the SPI_mean ranged from 0
to 0.2% compared with the baseline period
(Fig.6). Comparing the Fig.6 with Fig.4, we can
find the significant differences that the extreme
drought of 2036 - 2065 period according to
RPC8.5 scenario is found by increasing trends
for all timescales.
For the projections of the period 2036 - 2065,
this means that the extreme drought according to
RCP4.5 scenario at shorter timescales is expected to increase. However, the RCP8.5 scenario shows the increasing trend of extreme
drought at all timescales. In addition, the number
of the station that having the increasing trend according to RCP8.5 scenario is higher than
RCP4.5.
25
Mai, K.L and Tran, D.H
Fig.5. Same as Fig.3. but for 2046-2065: SPI_1 (a, e), SPI_3 (b, f), SPI_6 (c, g) and SPI_12 (d, h)
g
g
_ (
)
_ (
)
_ ( g) and SPI_12 (d, h)
Fig.6. Same as Fig.5. but for SPI_Min: SPI_1 (a, e), SPI_3 (b, f), SPI_6 (c, g) and SPI_12 (d, h)
3.2.3 Drought condition projections for 20802099
For the end - 21st century (2080 - 2099), the
trends of SPI and SPI_min are projected by the
same trend with the beginning and mid - 21st
century.
Fig. 7 shows that the SPI at all timescales of
2080 - 2099 is higher than that of the baseline
period. The increasing rate of the period 2080 -
26
2099 compared with baseline ranged from 0 to
0.8%. Whereas, the increase of SPI index at
longer timescales is higher than shorter
timescales. This means that the changes in mean
drought condition at shorter timescales are not
clearly found, especially at southern stations of
the region. The noticeable increasing trend of
drought condition is found at longer timescales.
As like the 2016-2035 and 2036-2065 peri-
A study on drought in the South - Central region: Detection from the observation
and the bias - correction rainfall projections of national climate change scenarios
ods, the SPI_min of 2080 - 2099 varied from
smaller values than that of the baseline period.
However, these smaller values are mostly found
at the SPI_min at 1- and 3-month timescales
(Fig. 8). This means that the extreme drought of
2080 - 2099 at shorter timescales is expected to
be more serious than that of the baseline period.
Fig. 7. Same as Fig.3. but for 2080-2099: SPI_1 (a, e), SPI_3 (b, f), SPI_6 (c, g) and SPI_12 (d, h)
Fig.8. SPI_Min: SPI_1 (a, e), SPI_3 (b, f), SPI_6 (c, g) and SPI_12 (d, h)
4. Conclusion and discussion
4.1. Conclusion
From these calculations and analysis above
which based on the past observed data and fu-
ture bias-correction rainfall, some conclusions
can be drawn:
(1) The SPI calculations for multiple
timescales show the average wetter condition
trend during 1961- 2017. However, the changes
27
Mai, K.L and Tran, D.H
in drought condition at the central and southern
stations in the South-Central region is not significant. Especially, the most extreme of drought
condition is detected by increase in severity level
due to the decrease trend of the SPI_min index.
(2) The future trends (2016 - 2035, 2036 2065 and 2080 - 2099 periods) of SPI and
SPI_min indices according to both RCP4.5 and
RCP8.5 scenarios are generally found the same
pattern with that of the past trend. Whereas, the
future mean drought condition at four timescales
is expected to decrease. The slight increase rate
of future SPI index is found by the central and
southern stations of the South-Central region and
by the shorter timescales. Although the decreasing trend of mean drought examined, the increasing trend of the most extreme drought
condition is found according to both RCP4.5 and
RCP8.5 scenarios. This increasing trend of the
most extreme drought condition is significantly
found by the shorter timescales and by the central and southern stations in the South-Central
region.
4.2. Discussion
In this study, we try to find the changes in
drought condition of the future periods
compared with the baseline period based on the
bias-cor-rection rainfall of IMHEN. This biascorrection rainfall was used in the “Climate
change and sea level rise scenarios” published
by MONRE. Thus, our results are presented in
this study that can provide useful information
for implement-ing responding to climate change
in the South-Central region.
Acknowledgements: This study is grant of funding
code: TNMT.2016.05.22
References
1. Jang, D.W., 2018. Assessment of Meteorological Drought Indices in Korea Using RCP
8.5 Scenario, Water 2018. 10: 283,
doi:10.3390/w10030283, MDPI.
2. DWR. Ministry of Agriculture and Rural
Development
(MARD):
/>
28
3. Edwards, D.C. and McKee, T.B., 1997.
Characteristics of 20th century drought in the
United States at multiple time scales. Climatology Report. 97(2). Department of Atmospheric
Science, Colorado State University, Fort Collins,
Colorado.
4. IMHEN, 2016. Climate change and sea
level rise scenarios for Vietnam, MONRE project.
5. IPCC, 2007. Climate Change 2007: The
Scientific Basis. Contribution of Working Group
I to the Fourth Assessment Report of the Intergovernmental Panel on Climate Change. Cambridge University Press, Cambridge. United
Kingdom and New York, NY, USA.
6. IPCC, 2013. Climate Change 2013: The
Physical Science Basis, Contribution of Working Group I to the Fifth Assessment Report of
the Intergovernmental Panel on Climate Change
[Stocker, T.F., D. Qin, G.-K. Plattner, M. Tignor,
S.K. Allen, J. Boschung, A. Nauels, Y. Xia, V.
Bex and P.M. Midgley (eds.)]. Cambridge University Press, Cambridge, United Kingdom and
New
York, NY,
USA,
pp
1535,
doi:10.1017/CBO97811074153
7. James, H. Stagge, L.M., Tallaksen, L.G.,
Anne, F.V.L., Kerstin, S., 2015. Candidate Distributions for Climatological Drought Indices
(SPI and SPEI). International Journal of Climatology, 35 (13): 4027
- 4040,
/>8. Liu, L., Hong, Y., Looper, J., Riley, R.,
2013. Climatological Drought Analyses and
Projection Using SPI and PDSI: Case Study of
the Arkansas Red River Basin. Journal of Hydrologic Engineering. 18 (7).
9. Osuch, M.M, Romanowicz, R.J.,
Lawrence, D. and Wong, W.K., 2016. Trends in
projections of standardized precipitation indices
in a future climate in Poland. Hydrol, Earth Syst.
Sci., 20: 1947-1969, doi:10.5194/hess-20-19472016
10. Mau, N.D, Thang, N.V and Khiem, M.V.,
2016. Changes in rainfall during the summer
monsoon over Vietnam projected by PRECIS
A study on drought in the South - Central region: Detection from the observation
and the bias - correction rainfall projections of national climate change scenarios
model. VNU Journal of Science. 3S (2016): 153166.
11. McKee, T.B., Doesken N.J. and Kleist, J.,
1993. The relationship of drought frequency and
duration to timescale, In: Proceedings of the
Eighth Conference on Applied Climatology.
Anaheim, California, 17-22 January 1993.
Boston, American Meteorological Society, 179 184.
12. MONRE, 2009. Climate change, sea level
rise scenarios for Vietnam, NARENCA.
13. MONRE, 2012. Climate change, sea level
rise scenarios for Vietnam. NARENCA, 2012.
14. MONRE, 2016. Climate change, sea level
rise scenarios for Vietnam. NARENCA, 2016.
15. Ngu, N.D and Hieu, N.T., 2004. Climate
and Climate resources in Vietnam. Agriculture
House.
16. Thang, N.V et al., 2017. Changes in climate extreme in Vietnam. Vietnam Science and
Technology (VISTECH). 1 (1): 79-87.
17. Thang, N.V et al., 2007. Research and de-
velop a technology for drought prediction and
early warning in Viet Nam, MONRE project,
2007.
18. Thang, N.V et al., 2014. Definition of the
criteria of drought condition for the South-Central region. Scientific and Technical Hydro-Meteorological Journal. 639: 49-55.
19. Thang, N.V et al., 2015. Study on drought
forecast and warning system in Viet Nam for 3month range, Code: KC.08.17/11-15.
20. Tri, T.D, et al., 2014. Projections of
drought condition for South-Central region by
using the PRECIS model. Scientific and Technical Hydro-Meteorological Journal. 644: 5-8.
21. Tri, T.D. et al., 2015. Trend of the drought
condition in the South-Central region during
1961 - 2010. Journal of Natural resources and
Environment. 217:18-20.
22. WMO, 2012. Standardized Precipitation
Index User Guide, WMO-No. 1090, Geneva 2,
Switzerland.
29