Interaction effect of phosphorus and sulphur on yield and quality of soybean in a Vertisol
Bạn đang xem bản rút gọn của tài liệu. Xem và tải ngay bản đầy đủ của tài liệu tại đây (211.93 KB, 7 trang )
Int.J.Curr.Microbiol.App.Sci (2018) 7(3): 152-158
International Journal of Current Microbiology and Applied Sciences
ISSN: 2319-7706 Volume 7 Number 03 (2018)
Journal homepage:
Original Research Article
/>
Interaction Effect of Phosphorus and Sulphur on Yield and
Quality of Soybean in a Vertisol
Jarupula Suman*, B.S. Dwivedi, A.K. Dwivedi and S.K. Pandey
College of Agriculture, JNKVV, Jabalpur-482 004 (MP), India
*Corresponding author
ABSTRACT
Keywords
Synergistic
relationship, Protein
and oil content
Article Info
Accepted:
04 February 2018
Available Online:
10 March 2018
A field experiment was carried out to evaluate the effect of sulphur and phosphorus
application on yield and N, P and K contents of soybean grown on Vertisol. It was found
that increasing application of sulphur and phosphorus, singly as well as in combination,
significantly increased the grain yield and contents of N, P and K over control. The
interaction of S x P exhibited a strong synergistic relationship in soybean nutrition grown
on deficient soil. Result indicated that grain and straw yield, uptake of phosphorus and
sulphur increased with increase in the rate of application of P and S individually as well as
in various combinations. Applied various levels of P and S also influenced the quality
parameters of soybean i.e. protein content and oil content. Available P in soil increased
with increasing levels of phosphorus. Similarly available S in the soil increased with
increasing levels of sulphur.
Introduction
Soybean is a well-known oilseed as well as
pulses crop which is grown in various
countries. Soybean, besides having excellent
nutritional quality, contributes the highest to
world oil production. Through, there has been
a prodigious increase in the acreage (1.5 to 6.3
m ha) as well as production (1.0 to 6.1 mt) of
soybean during last one and half decade, even
then. The share of India in world soybean
production is significantly (nearly 3.8%)
attributed to low productivity (SOPA, 2015).
Phosphorus, an important constituent of
biochemical products in plant itself plays a
key role in balance nutrition of the crop and
affects productivity of soybean. Next most
important emerging nutrient that is showing
wide spread deficiency is sulphur. Sulphur is
essential for synthesis of proteins, vitamins
and sulphur containing essential amino acids
and is also associated with nitrogen
metabolism. The good yield of soybean can be
achieved by balanced and adequate supply of
phosphate, sulphur and other deficient,
nutrients.
Sulphur interacts with phosphorus as
phosphate ion is more strongly bound than
sulphate (Choudhary and Das, 1996; Aulakh
et al., 1990). Phosphorus fertilizer application
results increased of anion adsorption sites by
phosphate, which releases sulphate ions into
the soil solution (Chandra Deo and
Khaldelwal, 2009). Thus, it may be subjected
152
Int.J.Curr.Microbiol.App.Sci (2018) 7(3): 152-158
to leaching if not taken up by plant roots.
Studies have indicated both synergistic and
antagonistic relationship between sulphur and
phosphorus but their relationship depends on
their rate of application and crop species
(Chaurasia et al., 2009; Dwivedi and Bapat,
1998). Synergistic effect of applied P and S
was observed by (Kumawat et al., 2004),
(Kumar and Singh, 1980) for soybean, (Islam
et al., 2006) for rice, (Pandey et al., 2003) for
linseed, (Chandra Deo and Khaldelwal, 2009)
for chickpea.
Antagonistic relationship between P and S was
observed in moong and wheat by (Islam et al.,
2006) and in lentil and chickpea by Hedge and
Murthy (Aulakh et al., 1990). The interaction
of these nutrient elements may affect the
critical levels of available P and S below
which response to their application could be
observed. Information on effect of combined
application of P and S on yield, quality and
content of each nutrient in soybean is rather
limited. Therefore, the present investigation
was undertaken to study interactive effects of
P and S application on yield and quality of
soybean.
Materials and Methods
The study was conducted in the All India
Coordinated Research Project on Long Term
Fertilizer Experiment (LTFE), Jawaharlal
Nehru Krishi Vishwa Vidyalaya, Jabalpur,
Madhya Pradesh. The experimental sites
(23°10ʺ N latitude and 79°57ʺ E longitude)
have a semi-arid and sub-tropical climate with
a characteristic feature of dry summer and
cold winter.
In winter season i.e. from November to
February the temperature ranges from 8.9°C to
34.5°C and the relative humidity varies from
70% to 90%. Dry and warm weather usually
persists during the month of March to June.
The temperature may rise as high as 460C
during these summer months. Monsoon season
extends from mid-June to mid-September. The
temperature during this period varies between
22°C and 38°C and the relative humidity
ranges from 70 to 80%. The total annual
rainfall varies from 1200 to 1500 mm. The
soil of the experimental sites falls under
Vertisol and belongs to Kheri-series of fine
montmorillonite, Hyperthermic family of
Typic Haplusterts popularly known as
“medium black soil”. At the inception of this
experiment in 1972, pooled soil sample were
drawn from the surface layers (0-20 cm) of the
experimental field has pH (7.6), electrical
conductivity (0.18), organic carbon (0.57%),
available N (193.0 kg ha-1) available P (7.60
kg ha-1) and available K (370 kg ha-1) and
available sulphur (17.47 kg ha-1). The
treatments consist of T1-50% NPK, T2-100%
NPK, T3-150% NPK, T4-100% NP, T5-100%
N, T6-100% NPK + FYM, T7-100% NPK-S
and T8-Control, and replicate with four times
in randomized block design.
Experimental details
Design used: Randomized block design
Replication: 04
Treatments: 8
Plot size: 17x10.8 m (183.6 m2)
Space between replications: 2m
Space between plots: 1 m
Experimental area: 146X58 m
Cropping sequence: Soybean-wheat
Results and Discussion
Grain and straw yield
With increasing level (Table 3) of both
phosphorus and sulphur grain and straw yield
of soybean were increased significantly. The
percent increase in grain yield due to
phosphorus and sulphur varied from 12.31 to
20.8% and 6.9 to 12.1%, respectively, whereas
the straw yield was increased from 10.6 to
153
Int.J.Curr.Microbiol.App.Sci (2018) 7(3): 152-158
15.9% and 6.3 to 12.9%. The magnitude of
response was more in case of phosphorus as
compared to sulphur. Synergistic effect of
phosphorus and sulphur interaction on grain
and straw yield was highest at 80 kg P2O5 and
20 kg S ha-1. The magnitude of increase in
grain and straw yield was 12.4 and 16.2% due
to combined application of phosphorus and
sulphur 80 kg P2O5 and 20 kg S ha-1 over
control, respectively. The synergistic effect of
P and S may be due to utilization of high
quantities of nutrients through their welldeveloped root system and nodules which
might have resulted in better growth and yield
at soil.
These results confirm the earlier findings of
(Nagar et al., 1993) in soybean, (Sinha et al.,
1995) in winter maize, (Choudhary and Das,
1996) in black gram, (Shankaralingappa et al.,
1999) in cowpea, (Randhawa and Arora,
2000) in wheat, (Teotia et al., 2000) in moong
bean, (Kumawat et al., 2004) in taramira and
(Islam et al., 2006) in rice. (Kumar and Singh,
1980) with soybean reported a suitable
balance between P and S for producing
increased yield. (Aulakh et al., 1990) and
(Singh et al., 1995) have shown that nature of
P and S interaction depends on their rates of
application.
Nitrogen and protein content
Nitrogen content (Table 2) was significantly
increased with the increase in level of P and S.
(Dwivedi and Bapat, 1998) reported that
nitrogen content in soybean increased
significantly by P and S application up to 50
kg ha-1of each nutrient. The interaction of P
and S was significant and maximum nitrogen
content was recorded at 80 kg P2O5 and 20 kg
S ha-1.Protein content in soybean grain was
increased significantly with application of P
and S individually as well as in combination
(Table 2). The maximum increase in protein
content (43.20%) was obtained with 40 kg
P2O5 and 20 kg S ha-1 together. Protein was
increased by 53.29% over control. The
response to applied P with respect to protein
content in soybean is attributed to more
nitrogen fixation. Similar results were also
reported by (Shankaralingappa et al., 1999) in
cowpea and (Kumawat et al., 2004) in
taramira.
Increasing doses of sulphur application
resulted in a significant increase in protein
content of soybean. The positive response to
added sulphur is assigned to low status of
available S of soil or due to stimulating effect
of applied sulphur in the synthesis of
chloroplast protein resulting in greater
photosynthetic efficiency which in turn
translated in term of increased yield. (Dwivedi
and Bapat, 1998) reported significant increase
in the protein content of soybean with
application of P and S up to 50 kg ha-1 over
control. The findings are similar to (JogendraSingh et al., 1997) in summer moong and
(Srinivasan et al., 2000) in black gram.
Phosphorus and sulphur content
With increasing in level of S from 0 to 40 and
40 to 80 kg ha-1, P and S content in grain and
straw were increased significantly. Similarly P
and S contents were increased significantly
with increasing levels of phosphorus from 0 to
10 and 10 to 20 kg P2O5 ha-1. The combined
application of 40 kg P2O5 and 20 kg S ha-1
significantly increased P and S content in
grain and straw (Table 2).
Phosphorus content in soybean ranged from
0.23 to 0.37% in grain and 0.12 to 0.26% in
straw, while S content ranged from 0.30 to
0.40% in grain and 0.10 to 0.13% in straw.
Similar results were reported by (Teotia et al.,
2000) and (Islam et al., 2006) in mungbean,
(Singh and Singh) in black gram and (Chandra
Deo and Khaldelwal, 2009) in chickpea.
154
Int.J.Curr.Microbiol.App.Sci (2018) 7(3): 152-158
Nutrient sources
i.
ii.
Nitrogen
Urea (46% N)
Phosphorus Single superphosphate (16% P 2 O5 ) while, Di-ammonium – phosphate
(46% P 2 O5 ) in T7
Muriate of potash (60% K 2 O)
iii. Potassium
Table.1 Physico-chemical properties of soil (0-20 cm depth) at the start of the LongTerm Fertilizer Experiment (1972)
S. No.
1.
2
3.
4.
5.
6.
7.
8.
9.
10.
11.
12.
13.
14.
Source:
Soil Properties
Unit
Value
Mechanical composition
i.
Sand
%
25.27
ii.
Silt
%
17.91
iii.
Clay
%
56.82
Textural class
Clay
Bulk density
Mg m -3
1.3
Particle density
Mg m -3
2.5
Cation exchange capacity
C mol (P + )kg -1
49.0
pH (1:2.5)
-7.6
Electrical conductivity (1:2.5)
dSm -1
0.18
Organic carbon
g kg -1
5.70
Calcium carbonate
%
4.60
Available nitrogen
kg ha -1
193.0
Available phosphorus
kg ha -1
7.60
Available potassium
kg ha -1
370.0
Available sulphur
kg ha -1
17.47
-1
Available zinc
mg kg
0.33
Annual report (2014) of AICRP on Long-Term Fertilizer Experiment, JNKVV, Jabalpur.
Table.2 Effect of continuous addition of fertilizers and manure on distribution of
available nutrients
Treatments
-1
50% NPK
100% NPK
150% NPK
100% NP
100% N
100% NPK + FYM
100% NPK (S FREE)
CONTROL
SEm±
CD (P=0.05)
N (kg ha )
0-15
15-30
cm
cm
217.00 182.00
275.00 238.00
291.00 260.00
240.00 215.00
198.00 180.00
310.00 280.00
248.00 217.00
182.00 165.00
12.18
12.90
35.35
37.44
Available nutrients status
P (kg ha-1)
K (kg ha-1)
0-15
15-30
0-15
15-30
cm
cm
cm
cm
22.61
20.16
243
234
33.18
28.95
275
253
40.55
39.15
296
275
30.75
28.88
225
180
11.26
10.80
207
172
42.88
40.81
328
297
30.15
27.86
255
245
10.01
9.80
208
165
2.20
2.05
11.14
11.51
6.40
5.94
32.34
33.39
155
S(kg ha-1)
0-15
15-30
cm
cm
24.17 22.34
34.98 32.64
39.30 37.21
30.82 27.40
15.08 14.63
42.66 38.47
15.94 14.63
13.95 12.72
0.81
0.97
2.39
2.85
Int.J.Curr.Microbiol.App.Sci (2018) 7(3): 152-158
Table.3 Effect of continuous application of fertilizers and manure on grain and straw
yield of soybean
Soybean yield (kg ha -1 )
Grain
Straw
600
1413
725
1900
1075
2463
665
1788
538
1356
1113
2713
963
2350
450
1100
Treatments
T1
T2
T3
T4
T5
T6
T7
T8
50% NPK
100%NPK
150%NPK
100%NP
100%N
100%NPK+ FYM
100%NPK-S
Control
Tables.4 Effect of continuous application of fertilizers and manure on protein and oil
yield of soybean
Soybean yield (kg ha -1 )
Protein
Oil
1658
993
2758
1281
4627
1993
2396
1109
1168
640
4800
2322
2671
1515
1084
494
294.51
155.54
854.65
451.39
Treatments
T1
T2
T3
T4
T5
T6
T7
T8
50% NPK
100%NPK
150%NPK
100%NP
100%N
100%NPK+ FYM
100%NPK-S
Control
SEm±
CD
Table.5 Effect of continuous application of fertilizers and manure on p rotein,
carbohydrate and oil content (%) in soybean seed
Treatments
50%NPK
T1
100%NPK
T2
150%NPK
T3
100%NP
T4
100%N
T5
100%NPK+FYM
T6
100%NPK – S
T7
Control
T8
SEm±
CD (p=0.05)
Protein (%)
28.09
38.22
43.11
36.11
23.23
43.20
27.67
23.53
1.415
4.107
156
Oil (%)
16.57
17.59
18.53
16.65
12.72
20.74
15.73
10.95
0.310
0.900
Carbohydrate (%)
13.41
18.34
20.13
16.51
12.09
20.25
17.18
11.56
0.574
1.666
Int.J.Curr.Microbiol.App.Sci (2018) 7(3): 152-158
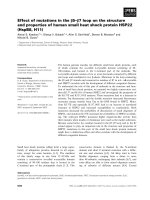
respectively over the control. The increase in
oil content with P application could be due to
the fact that P helped in synthesis of fatty
acids and their esterification by accelerating
biochemical reactions in glyoxalate cycle
(Dwivedi and Bapat, 1998). The increase in
protein and oil content due to 20 kg S ha-1
was 11.26 and 24.17% respectively. The
increase in oil content with S application
might be due to the fact that S helped in oil
synthesis by enhancing the level of
thioglucosides (Dwivedi and Bapat, 1998).
Soybean responded more to S in increasing
oil and protein content of seed, as also
reported by Kumar and Singh (1981). The
interaction between P and S was significant.
All the S levels increased both oil and protein
contents significantly at every level of P. The
maximum protein and oil content were
recorded with a treatment combination of 80
kg P2O5 and 40 kg S ha-1.
Available phosphorus and sulphur
The results presented in Table 4 showed that
the available P was increased consistently
with increasing in level of phosphorus; P
content in soil increased from 22.3 kg ha-1 in
control to 32.9 kg P2O5 ha-1 with application
of 40 kg P2O5 ha-1. Similar results were also
reported by Balaguravaish et al., and Chandra
Deo and Khaldelwal (2009). Application of S
did not affect the available P significantly in
the soil but it tends to increase with sulphur
was increased with increasing levels of
sulphur application. Phosphorus application
had no effect on sulphur content of the soil.
The findings are similar to Chandra Deo and
Khaldelwal (2009), reported that application
of 60 kg P2O5 ha had no effect on sulphur
content of the soil.
Effect of P and S on quality parameters of
soybean
References
Protein and Oil content
Aulakh, M.S., N.S. Pasricha and A.S. Azad, 1990.
Phosphorus-sulphur interrelationship for
soybean on P and S deficient soil. Soil Sci.,
150: 705-709
Chandra Deo and R.B. Khaldelwal, 2009. 23.
Nagar, R.P., G.C. Mali and P. Lal, 1993.
Effect of Effect of P and S nutrition on
yield and quality of phosphorus and sulphur
on yield and chemical chickpea (Cicer
arietinum L.). J. Indian Soc. Soil Sci.,
composition of soybean in Vertisols. J.
Indian Soc. 57: 352-356.
Chaurasia, Amit Kumar, G.P. Richharia and
Shridha Chaurasia (2009). Response of
Soybean (Glycine max) to doses and
sources of sulphur. Indian J. of Agricultural
Sciences, 79(5):356-358.
Choudhary, H.P. and S.K. Das, 1996. Effect of P,
content of black gram (Phaseolus mungo
L.) S and Mo application on yield of rainfed
blackgram J. Indian Soc. Soil Sci., 52: 266269.
Dwivedi, A.K., and P.N. Bapat, 1998. Sulphur –
Phosphrous interaction on the synthesis of
nitrogenous fraction and oil in soybean.
The data presented in Table 5 revealed that
increase in oil content was to the tune of
18.53% to 20.54% due to application of 40 to
80 kg P over control, while 2.32 to 4.79%
increase in oil content was due to application
of 10 to 20 kg S ha-1. There was improvement
in quality parameters (protein content,
carbohydrate and oil content) due to P and S
application. The improvement of protein and
oil content through P and S fertilizer form
application to the soybean crop. The
Chaousaria et al., (2009) recorded
improvement in protein and oil content due to
application of phosphorus and sulphur in
soybean crop. Further, Dwivedi and Bapat
(1998), Majumdar et al., (2001) and recently
Kumar et al., (2009) also reported that
improvement in protein and oil content due to
phosphorus and sulphur application. On an
average, 60 kg P2O5 ha-1 increased protein
and oil content by 7.03 and 15.24%
157
Int.J.Curr.Microbiol.App.Sci (2018) 7(3): 152-158
J.Indian Soc.Soil Sci., 46:254-257
Dwivedi, A.K. and P.N. Bapat (1998). Sulphurphosphorus interaction on the synthesis of
nitrogenous fractions andoil in soybean. J.
Indian Soc. Soil Sci., 46 (2):254-257.
Hedge, D.M. and I.Y.L.N. Murthy, 2005.
Management of secondary nutrients. Indian
J. Fert.1: 93-100.
Henry, A., S.P.S. Choudhary and B.K. Mathur,
2008. Clusterbean (Guar). In Souvenir of
the 3rd National
Indian J. Fert., 2: 37-52.
Islam, M.N., S. Hoque and A. Islam, 2006. Effect
of P x S interactions on nutrient
concentration and yield of wheat, rice and
mungbean. J. Indian Soc. Soil Sci., 54: 8691.
Jogendra-Singh, P., J.C. Tarafdar and B.R. Gupta,
1997. Sulphur fertilization for increased
production of summer moong (Vigna
radiate L.). J. Indian Soc. Soil Sci., 45:
256-528.
Kumar Mahesh, B.K. Nad and P. Raina (2009).
Effect of phosphorus and sulphur applied
along with FYM and green leaf manure on
their uptake and yield of mustard and
soybean. J. AridLegumes., 6 (2): 96-100.
Kumar, V. and M. Singh, 1980. Sulphur,
phosphorus and molybdenum interaction in
relationship to growth, uptake and
utilization of sulphur in soybean. Soil Sci.,
128: 297-304.
Kumawat, B.L., A.R.K. Pathan and R. Chahan,
2004. Response of taramirra to sulphur and
phosphorus application on Typic Pasmmnt.
J. Indian Soc. Soil Sci., 52: 476-478.
Majumdar, B., M.S. Venkatesh, B. Lal and
Kailash Kumar (2001). Response of
soybean (Glycine max) to phosphorus and
sulphur in acid alfisol of Meghalaya. Indian
Journal of Agronomy, 46 (3): 500-505.
Marok, A.S. and G. Dev, 1980. Phosphorus and
sulphur inter-relationship in wheat. J.
Indian Soc. Soil Sci., 28: 184-186.
Nagar, R.P., G.C. Mali and P. Lal, 1993. Effect of
phosphorus and sulphur on yield and
chemical composition of soybean in
Vertisols. J. Indian Soc. Soil Sci., 41: 385386.
Pandey, I.P. O.M. Sharan and S.B. Pandey, 2003.
Response of linseed to different levels of
phosphorus and sulphur application. Ann.
Plant SoilRes., 5: 99-101.
Randhawa, P.S. and C.L. Arora, 2000.
Phosphorus-sulphur interaction effects on
dry matter yield and nutrition uptake by
wheat. J. Indian Soc. Soil Sci., 48: 536-540.
Shankaralingappa, B.C., B. Shivaraj, K.P.
Krishnappa and A.P. Nagaraja, 1999.
Phosphorus-sulphur interaction effect on
growth and yield of cowpea. Karnataka J.
Agric. Sci., 12: 15-19.
Singh, V., V. Kumar and S.P.S. Karawasra, 1995.
Interaction of sulphur and zinc on dry
matter yield, concentration and uptake of
sulphur in green gram (Vigna radiata L.).
Crop Res., 9: 32-41.
Sinha, R.B., R. Sakal and S. Kumar, 1995.
Sulphur and phosphorus nutrition of winter
maize in calcareous soil. J. Indian Soc. Soil
Sci., 43: 413-418.
Symposium
on
Enhancing
Productivity,
Nutritional Security and Export Potential
through Arid Legumes held at CAZRI,
Jodhpur, 28-30 June, 2008, pp: 53.
Teotia, U.S., V.S. Mehta, D. Ghosh and P.C.
Srivastava, 2000. Phosphorus-Sulphur
interaction in moongbean (Vigna radiata L.
Wilczek): I. Yield, phosphorus and sulphur
contents. Legume Res., 23: 106-109.
Tiwari, K.N. and B.R. Gupta, 2006. Sulphur for
sustainable high yield agriculture in Uttar
Pradesh.
How to cite this article:
Jarupula Suman, B.S. Dwivedi, A.K. Dwivedi and Pandey, S.K. 2018. Interaction Effect of
Phosphorus and Sulphur on Yield and Quality of Soybean in a Vertisol.
Int.J.Curr.Microbiol.App.Sci. 7(03): 152-158. doi: />
158