Molecular characterization of heterotic groups of cotton through SSR markers
Bạn đang xem bản rút gọn của tài liệu. Xem và tải ngay bản đầy đủ của tài liệu tại đây (586.73 KB, 9 trang )
Int.J.Curr.Microbiol.App.Sci (2018) 7(3): 426-434
International Journal of Current Microbiology and Applied Sciences
ISSN: 2319-7706 Volume 7 Number 03 (2018)
Journal homepage:
Original Research Article
/>
Molecular Characterization of Heterotic Groups of
Cotton through SSR Markers
H.G. Kencharaddi*, R.R. Hanchinal, S.S. Patil, S.M. Manjula,
Ravi Kulkarni, C.V. Usharani and C.D. Soregoan
Department of Genetic and Plant Breeding, University of Agricultural Sciences,
Dharwad - 580 005, Karnataka, India
*Corresponding author
ABSTRACT
Keywords
Cotton (Gossypium
hirsutum L.), SSR
Makers
Article Info
Accepted:
04 February 2018
Available Online:
10 March 2018
Knowledge of genetic diversity and relationships among breeding materials has a
significant impact on crop improvement. Association between parental divergence and
progeny performance has not been well documented in cotton (Gossypium hirsutum L.).
This study was conducted to estimate genetic diversity based on simple sequence repeat
(SSR) markers among the selected elite cotton genotypes belong to different heterotic
groups developed at ARS, Dharwad. A total of 81 alleles were detected from 24 SSR
primers. Among these, 62 were polymorphic with an average of 70.29 per cent
polymorphism. The number of alleles per SSR locus ranged from 1 to 13 with an average
of 3.37. The per cent polymorphism was 0.00 to 100.00 per cent with an average 70.29.
Primers viz., BNL 2920, BNL2882, BNL 1059, BNL3171, BNL3994, CIR246, CIR351,
CIR070,CIR 100, CIR182, CIR200, CIR238,CIR034, CIR004, CIR373, CIR393,
JESPR195 66, JESPR 29 JESPR 58 and NAU3485 exhibited the highest (more than 50%)
per cent polymorphism. The number of bands ranged from four (primers BNL 3418) to 91
(primers JESPR58) with an average of 20.40 bands per primer. In case of compact groups,
lines DC-ANJ and DC095-7 revealed highest (0.91) similarity coefficient value followed
by DC095-7 and DC 4-11 (0.74), DC-ANJ and DC095-7 (0.73). Among robust lines,
DRAC 9565 and DR 2 recorded highest (0.78) followed by DRL-88 and DRAC -9565
(0.74). In case stay green groups, highest similarity coefficient value (0.81) was observed
between DSG-79-61-1 and DSG-3-5 line followed by DSG-102 and DSG-3-5 (0.79).
Among the elite lines of high RGR, highest similarity was observed between DRGR-24178 and DRGR-257 (0.75) followed by DRGR-32-100 and DRGR-257 (0.71). All the
parental lines showed diversity among themselves indicating that there is considerable
amount of variation, which can be exploited through appropriate breeding programme.
identification of diverse strains
hybridization with elite cultivars.
Introduction
Breeding programmes depend on a high level
of genetic diversity for achieving progress
from selection. Broadening the genetic base of
core breeding material requires the
for
Numerous studies investigating the assessment
of genetic diversity within breeding material
have been reported in all crops.
426
Int.J.Curr.Microbiol.App.Sci (2018) 7(3): 426-434
Morphological features are indicative of
genotype but are represented by only a few
loci because they are not large enough.
Moreover, they can also be affected by
environmental factors and cultural practices.
In the past the ability to discriminate between
varieties was heavily dependent on
morphological traits. Lately, DNA markers
have been employed as promising tools. DNA
molecular markers are employed for genetic
diversity estimation in place of morphological
markers as number of morphological
descriptors various in crops is in vogue for
characterization
purpose.
Observed
polymorphism is independent from effects
caused due to environmental conditions and
physiological stage of plant makes molecular
markers a reliable tool for diversity studies.
DNA markers have also been used to define
heterotic groups that can be used to exploit
heterosis (hybrid vigour). The development of
inbred lines for use in producing superior
hybrids is a relatively time-consuming and
expensive procedure. Unfortunately, it is not
yet possible to predict the exact level of
heterosis based on DNA marker data although
there have been reports of assigning parental
lines to the different heterotic groups. The
potential use of smaller subsets of DNA
marker data in combination with phenotypic
data to select heterotic hybrids has also been
proposed. Hence, present study was planned
with the intention of exploitation of heterotic
groups based on conventional and molecular
(SSR) markers.
Materials and Methods
Plant materials and molecular markers
used in the study
component traits as mentioned in Table 1 and
2, respectively.
SSR molecular marker analysis
Leaf tissue of each parent was harvested and
total genomic DNA was extracted from young
leaves
using
the
hexadecyl-trimethyl
ammonium
bromide
(CTAB)
method
described by Saghai-Maroof et al., (1984).
SSR assays were performed using 24
oligonucleotide primers from Sigma Aldrich
Chemicals Pvt. Ltd., Co. Amplification
reactions were carried out in 20 mL volumes
containing 2.0 mL 10× assay buffer, 2.0 mL
dNTP mix (2.5 mM each), 0.5 mL forward
primer (5 pM/mL), 0.5 ml Reverse (5
pM/mL), 0.5 mL Taq DNA polymerase
(3U/mL), 2.0 mL Template DNA (15 ng/mL)
and 7.5 mL Sterile double distill water. The
amplification programmed for 5 min at 940C
Denaturation (initial) of genomic DNA by one
cycle followed by 25 cycles of 1 min at 940C,
1 min at 48 ± 50C and 1 min at 720C. This was
followed by a final extension at 720C for 5
min. Amplification products were analysed by
Non-Denaturing gel electrophoresis (PAGE)
and viewed by silver staining.
Scoring the amplified fragments
The amplification of DNA profiles for all the
primers were compared with each other and
the bands of DNA at each amplification level
of every primer were scored as present (1) or
absent (0) thus generating the 0, 1 matrix.
Total No. of polymorphic bands
Per cent polymorphism (%) = ------------ 100
Total No. of bands generated by 24 primers
Analysis of SSR profiles
Five elite lines from each heterotic groups viz.,
compact, robust, stay green and high RGR.
Were used for 24 sets of cotton micro satellite
markers (SSR) linked to yield and yield
Pair similarity coefficients were calculated for
all pairwise combinations of the parental lines
according to the method developed by Nei and
427
Int.J.Curr.Microbiol.App.Sci (2018) 7(3): 426-434
Li (1979): Sij= 2Nij / (Ni+ Nj), where Sij is
the similarity between parents i and j; Nij is
the number of bands present in both parents;
Ni is the number of bands present only in
parent I; Nj is the number of bands present
only in parent j. GD (genetic distance) was
calculated as GD= 1- Sij.
The similarity matrix from SSR markers,
which were computed using NTSYS-PC
version 2.1 (Rohlf, 2001) were used to
construct dendrograms based on UPGMA (the
unweighted pair- group method with
arithmetic means). Using the same NTSYS
software, a cophenetic value matrix was
calculated to test the goodness of fit for the
cluster analysis to the original distance matrix.
Results and Discussion
The use of molecular markers will help to
study the genetic relationship among cotton
genotypes. DNA based molecular markers
acted as a versatile tool to study variability
and diversity in different plant species. The
search for superior hybrid parents in cotton
breeding programmes is commonly based on
the estimation of the general combining ability
(gca) and specific combining ability (sca) in
lines.
However, the application of this procedure is
relatively an expensive and time consuming
process. The development of DNA based
markers represent an alternative procedure for
the identification of promising parental lines
for superior performances of hybrids. The
microsatellite (SSR’s) markers have been
widely used for the estimation of variation
among closely related individuals due to its
multiallelic nature and high polymorphism.
Molecular markers based on polymorphism of
DNA are especially useful for this purpose
because they are not affected by environment
(Tatineni et al., 1996 and Saghai- Maroof et
al., 1984). Several examples of the application
of molecular markers to estimate genetic
distances have been reported in maize (Smith
et al., 1990) and rice (Zhang et al., 1995).
Thus, molecular markers like SSR’s
(microsatellite) could be used for germplasm
classification and clustering to derive valuable
information. A total of 81 alleles were
detected from 24 SSR primers. Among these,
62 were polymorphic with an average of 70.29
per cent polymorphism.
The number of alleles per SSR locus ranged
from 1 to 13 (Table 3) with an average of
3.37. The per cent polymorphism was 0.00 to
100.00 per cent with an average 70.29.
Primers viz., BNL 2920, BNL2882, BNL
1059, BNL3171, BNL3994, CIR246, CIR351,
CIR070,CIR
100,
CIR182,
CIR200,
CIR238,CIR034, CIR004, CIR373, CIR393,
JESPR195 66, JESPR 29 JESPR 58 and
NAU3485 exhibited the highest (more than
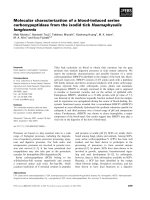
50%) per cent polymorphism. The number of
bands ranged from four (primers BNL 3418)
to 91 (primers JESPR58) with an average of
20.40 bands per primer. In case of compact
groups, lines DC-ANJ and DC095-7 showed
the highest (0.91) similarity coefficient value
followed by DC095-7 and DC 4-11 (0.74),
DC-ANJ and DC095-7 (0.73). Among robust
lines, DRAC 9565 and DR 2 recorded highest
(0.78) followed by DRL-88 and DRAC -9565
(0.74).
In case stay green elite lines highest similarity
coefficient value (0.81) was observed between
DSG-79-61-1 and DSG-3-5 followed by DSG102 and DSG-3-5 (0.79) (Table 4). Among the
elite lines of high RGR, highest similarity was
observed between DRGR-24-178 and DRGR257 (0.75) followed by DRGR-32-100 and
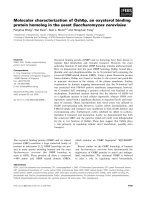
DRGR-257 (0.71). All the parental lines
showed diversity among themselves indicating
that there is considerable amount of variation,
which can be exploited through appropriate
breeding programme (Fig. 1).
428
Int.J.Curr.Microbiol.App.Sci (2018) 7(3): 426-434
Table.1 Experimental material used for molecular diversity analysis using 24 SSR Markers
Sl. No.
1
2
3
4
5
6
7
8
9
10
11
12
13
14
15
16
17
18
19
20
Heterotic Groups
Robust
Robust
Robust
Robust
Robust
Stay green
Stay green
Stay green
Stay green
Stay green
High RGR
High RGR
High RGR
High RGR
High RGR
Compact
Compact
Compact
Compact
Compact
Genotype
DRBM
DR2
DRAC 9565
DSMR-10
DRL-88
GSG 16
GSG 100
DSG-3-5
DSG 79-61-1
DSG-102
DRCR-041
DRGR-257
DRGR-24-178
DRGR-32-100
DRGR-308
DC 95-118
DC 4-11
DC-58-7
DC-095-7
DC-ANJ
Table.3 Analysis of SSR patterns generated using 24 primers pairs in elite genotypes
Sl. No.
1
2
3
4
5
6
7
8
9
10
11
12
13
14
15
16
17
18
19
20
21
22
23
24
Primers
BNL2920
BNL2882
BNL1059
BNL3418
BNL3259
BNL1440
BNL3171
BNL3408
BNL3994
CIR246
CIR381
CIR070
CIR100
CIR182
CIR238
CIR034
CIR004
CIR373
CIR393
CIR030
JESPR195
JESPR29
JESPR58
NAU3485
Total
No. of polymorphic alleles
4
3
3
0
0
0
2
2
1
2
2
2
2
2
2
1
1
1
0
4
4
3
12
9
62
429
No. of Alleles
4
5
4
1
1
1
3
5
1
2
3
3
2
3
2
1
1
1
1
5
6
3
13
10
81
Percent Polymorphism
100
80
75
0
0
0
66
40
100
100
66
66
100
66
100
100
100
100
0
80
66
100
92
90
70.29
Int.J.Curr.Microbiol.App.Sci (2018) 7(3): 426-434
Table.2 List of SSR primers used for diversity analysis
Sl. No.
1
2
3
4
5
6
7
8
9
10
11
12
13
Sl.
No.
14
15
16
17
18
19
20
21
22
23
24
Marker Name
BNL2920
BNL2882
BNL1059
BNL3418
BNL3259
BNL1440
BNL3171
BNL3408
BNL3994
CIR246
CIR381
CIR070
CIR100
Marker Name
CIR182
CIR238
CIR034
CIR004
CIR373
CIR393
CIR030
JESPR195
JESPR29
JESPR58
NAU3485
Forward Primer (5’-3’)
Reverse Primer (3’-5’)
TTCTTGCATTGAATAATACTGGC
CTTAATTCTAAAAATCAATAAATTTAGCC
CAACCTTTGGTAATCTTCTTTCG
CGCTAACGCATTTGACATCT
CCTTCTCTGACACTCTGCCC
TGTATTCTCTTCTTTTCCTTATACTTTT
GATGCCAGTGAGATCCCAAT
TCAGTGGAGATGGTCATATGC
TTTTGAAATTCCAGCGAAGG
GTCAATACCTGCTTCTCCACG
CCGAAATATACTTGTCATCTAAACG
CCCCCGGACTAATTTTTCAA
GAAAAATTGAGGAAGGACATACG
GGCCACAACCGAATTTACTG
ATCCAAACCATTGCACCACT
GTGTACGTTGAGAAGTCATCTGC
TTGAGGGCATCCAAATCCAT
CCTCCACCATACACGTGCTA
TTAGGGTTTAGTTGAATGG
ATGAACACACGCACG
TTTCCATCCTTTTGTGA
AAGGAGAAGAACAAGCAA
AACCACCAACCATTCA
TGGGACTCGGTCATC
GAGAGGCGATGCTAAA
GGGATACAAATGGAGAAA
Contd...
Forward Primer (5’-3’)
Reverse Primer (3’-5’)
CTTCATCATAGTAGCGAGTT
TCAACTCACCGATTACAC
TTGAACCAAGAATGGAA
ACAAATCCCATTCACG
ACCATTGACTTCCCTGT
GACCACACAGACAGACAA
CAATATCTCACTTGGACCT
GATCTGGACTAAACTAGTTGATGTG
CACCGTTTCCAAGTAAGATT
CCGCCCTTCTCTTGCTTAGATCTGG
GTTCAAAGTCGGGTTATTGG
430
GAATCAAGCAGAGGATTT
TCTTCATTCGGGCTT
TGTCACGCCATATACACT
GGTTTGCTAGTGTCCTTT
CCCTCTTGGTGTTATGTC
TCCACAACCAAACTAACA
TGCTACACATCATAGTTGG
GCCAATAATGGATGAAGGTTAC
GGTTAATCTTAGTTGAGGTC
GGAGCCAATTGAGAAGTGAATCCAA
AGTGCAACGGCTTAGGATAC
Int.J.Curr.Microbiol.App.Sci (2018) 7(3): 426-434
Table.4 Genetic similarity coefficients between the elite lines of heterotic groups
Genotypes
DRBM
DR2
DRAC
9565
DSMR10
DRCR8
GSG
16
GSG
100
DSG3-5
DSG
7961-1
DSG102
DRCR4
DRGR257
DRGR24-178
DRGR32-100
DRGR308
DC
95118
DC
411
DC587
DRBM
1.00
DR2
0.71
1.00
DRAC
9565
0.74
0.78
1.00
DSMR-10
0.58
0.61
0.61
1.00
DRCR-8
0.58
0.66
0.74
0.65
1.00
GSG 16
0.59
0.55
0.60
0.64
0.66
1.00
GSG 100
0.68
0.49
0.64
0.55
0.58
0.74
1.00
DSG-3-5
0.68
0.54
0.54
0.58
0.58
0.66
0.78
1.00
DSG 7961-1
0.69
0.63
0.58
0.59
0.56
0.73
0.64
0.81
1.00
DSG-102
0.59
0.48
0.45
0.56
0.46
0.55
0.61
0.79
0.78
1.00
DRCR-4
0.55
0.46
0.46
0.60
0.55
0.69
0.70
0.63
0.56
0.66
1.00
DRGR257
0.61
0.60
0.50
0.64
0.54
0.68
0.69
0.64
0.63
0.53
0.71
1.00
DRGR-24178
0.64
0.53
0.55
0.61
0.56
0.68
0.56
0.66
0.70
0.58
0.66
0.75
1.00
DRGR-32100
0.63
0.54
0.51
0.53
0.50
0.61
0.60
0.53
0.64
0.54
0.63
0.71
0.76
1.00
DRGR308
0.70
0.56
0.56
0.55
0.60
0.59
0.58
0.63
0.61
0.59
0.65
0.69
0.76
0.78
1.00
DC 95-118
0.58
0.61
0.64
0.63
0.68
0.61
0.58
0.55
0.54
0.59
0.60
0.59
0.59
0.58
0.73
1.00
DC 4-11
0.60
0.59
0.51
0.63
0.58
0.66
0.60
0.63
0.66
0.56
0.65
0.71
0.66
0.65
0.70
0.73
1.00
DC-58-7
0.58
0.64
0.54
0.55
0.58
0.71
0.53
0.55
0.61
0.51
0.55
0.54
0.64
0.60
0.55
0.65
0.63
1.00
DC-095-7
0.66
0.58
0.58
0.51
0.59
0.65
0.61
0.54
0.53
0.50
0.59
0.55
0.58
0.56
0.56
0.61
0.59
0.74
DC-ANJ
0.65
0.61
0.61
0.58
0.60
0.69
0.58
0.55
0.56
0.54
0.63
0.56
0.59
0.63
0.63
431
DC- DC095- ANJ
7
1.00
0.63 0.63 0.73 0.91 1.00
Int.J.Curr.Microbiol.App.Sci (2018) 7(3): 426-434
Fig.1 DNA amplification pattern of 20 genotypes of cotton
(Primer NAU3485)
(Primer JESPR58)
432
Int.J.Curr.Microbiol.App.Sci (2018) 7(3): 426-434
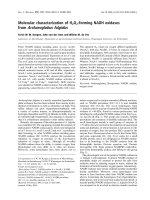
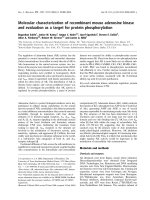
Fig.2 Dendrogram obtained from pooled data of SSR profiles of cotton genotypes from different
heterotic groups (Gossypium hirsutum L.)
The dendrogram constructed from the pooled
data (Fig. 2) revealed five distinct clusters at
0.70 per cent similarity. Cluster I had three
genotypes (DBM, DRC-9565 and DR2),
Cluster II included three genotypes (DC-5-87,
dc-0957 and DC-ANJ), cluster III consists of
(DSG-16 and DSG-100), cluster IV had four
RGR-genotypes (DRGR-24-178, DRGR-257,
DRGR-32-100 and DRGR-308) while, cluster
V consists of two compact genotypes viz.,
DC-95-118 and DC-4-11. In generally higher
similarity was observed among the elite lines
of each heterotic groups and less similarity
was noticed between the elite lines of
heterotic groups but in most of the elite lines
low range of distance was detected between
the elite lines of each heterotic group which
might be the refection of less number of
markers used in the present study. Hence it is
a worthwhile investigation to use highly
saturated map of markers particularly linked
to QTLs affecting most of the traits, to assess
diversity and to predict the level of heterosis
between the genotypes at the level of different
genomic points.
References
Saghai-Maroof, M. A., Soliman, K. M.,
Jorgensen, R. A. and Allard, R. W.,
1984, Ribosomal DNA spacer length
polymorphism in barley: Mendelian
inheritance, chromosomal location and
population dynamics. Proc Natl Acad
Sci, USA, 81: 8014-8018.
Smith, O. S., Smith, J. S. C., Bowen, S. L.,
Tenborg, R. A. and Wall, S. J., 1990,
Similarities among a group of elite
433
Int.J.Curr.Microbiol.App.Sci (2018) 7(3): 426-434
maize inbreeds as measured by
pedigree, F1 grain yield, grain yield,
heterosis and RFLPs. Theor. Appl.
Genet., 80: 833-840.
Tatineni, V., Cantrell, R. G. and Davis, D. D.,
1996, Genetic diversity in elite cotton
germplasm
determined
by
morphological
characteristics
and
RAPDs. Crop Sci., 36: 186-192.
Zhang Q., Saghai M.A., Yang G.P., Liu K.D.,
Zhou Z.Q., Gravois K.A., C.G. Xu, and
Gao Y.G., 1995, Correlations between
molecular marker polymorphism and
hybrid performance in rice, Plant
Genome IV Conference, San Diego,
CA, pp.307.
How to cite this article:
Kencharaddi, H.G., R.R. Hanchinal, S.S. Patil, S.M. Manjula, Ravi Kulkarni, C.V. Usharani
and Soregoan, C.D. 2018. Molecular Characterization of Heterotic Groups of Cotton through
SSR Markers. Int.J.Curr.Microbiol.App.Sci. 7(03): 426-434.
doi: />
434