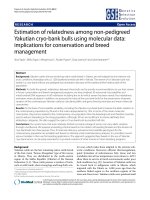
Molecular diversity analysis in fennel (Foeniculum vulgare Mill) genotypes and its implications for conservation and crop breeding
Bạn đang xem bản rút gọn của tài liệu. Xem và tải ngay bản đầy đủ của tài liệu tại đây (749.57 KB, 16 trang )
Int.J.Curr.Microbiol.App.Sci (2018) 7(3): 794-809
International Journal of Current Microbiology and Applied Sciences
ISSN: 2319-7706 Volume 7 Number 03 (2018)
Journal homepage:
Original Research Article
/>
Molecular Diversity Analysis in Fennel (Foeniculum vulgare Mill)
Genotypes and its Implications for Conservation and Crop Breeding
Sharda Choudhary*, Radheshyam Sharma, R.S. Meena and Arvind Kumar Verma
ICAR-National Research Centre on Seed Spices, Ajmer 305-206 (Rajasthan), India
*Corresponding author
ABSTRACT
Keywords
Fennel, ISSR,
Molecular diversity,
Molecular marker,
Polymorphism,
RAPD
Article Info
Accepted:
07 February 2018
Available Online:
10 March 2018
Seed spices are most valuable crops having a good export potential to boost national
economy. Among all seed spices, fennel has their prime importance in medicinal and
nationwide market. This crop is highly variable and rich in molecular variability. Two
DNA based molecular marker techniques viz., Random Amplified Polymorphic DNA
(RAPD) and inter-simple sequence repeat (ISSR), were used to study the molecular
diversity among 17 fennel genotypes. A total of 26 polymorphic primers (16 random and
10 ISSR) were used. Amplification of genomic DNA of 17 genotypes, using RAPD
analysis, yielded 79 fragments, in which 58 (73.41%) were polymorphic. The 10 ISSR
primers produced 59 bands across 17 genotypes, of which 51 (86.44%) were polymorphic.
The similarity coefficient ranged from 0.34 to 0.76 and 0.36 to 0.87. Based on the
similarity matrix data dendrogram were prepared using UPGMA method. Genotypes were
also classified into groups and several subgroups, respectively. Principal Coordinate
Analysis (PCA) confirmed the separation of fennel genotypes into groups comparable to
those from UPGMA analysis. The high rate of polymorphic lines generated by RAPD and
ISSR markers indicated that the method is efficient to analyze molecular diversity in
fennel genotypes and that the molecular divergence can be used to establish consistent
heterotic groups between fennel genotypes. Hence, molecular markers proud to be,
superior in assessing differences among genetically very similar genotypes and efficiently
utilized in plant breeding programme for improvement of crops.
Introduction
India is known as the “'Land of Spices” and
largest producer, consumer and exporter of
seed spices and their products in the world.
Fennel (Foeniculum vulgare Mill), 2n=22 an
important open cross-pollinated crop, belong
to family Apiaceae and is mainly grown for
seeds. It is also used in folk medicine for its
balasimic, cardiotonic, digestive, lactogogue
and tonic properties (Saleha, 2011;
Saravanaperumal and Terza, 2012; Choudhary
et al., 2017). Fennel seeds contain essential oil
which
has
a
valuable
antioxidant,
antibacterial, anticancer and antifungal
activity (El-Awadi and Hassan, 2010). In India
fennel is cultivated covering a total area of
about 76000 ha with annual production of
129350 tonnes (DASD, 205-16). The
importance of fennel was recognized long
back due to its medicinal values and export
potential as spices however it is remain
794
Int.J.Curr.Microbiol.App.Sci (2018) 7(3): 794-809
neglected for long time towards improvement
on its productivity and quality. With change to
sophisticate life style, the value added, quality
form of seed spices have become the thrust
area for introduction of new produces. The
main constraint for the production of value
added products are lack of sufficient number
of improved varieties having high volatile oil,
low crude fibre, high soluble sugars and high
seed yield. In the last few years, the interest
for a possible industrial use of fennel is
growing. Recently, fennel has become appoint
of attraction for main international seed
companies, which have improved research
breeding programs.
cumin, coriander and fenugreek (Choudhary et
al., 2013; 2015; 2017, Singh et al., 2012).
The genetic variability and divergence present
in the materials is an important tool for any
breeding programme. The assessment of
variation would provide us a correct picture of
the extent of variation, further helping us to
improve the genotypes for biotic and abiotic
stresses. The main objective of this study was
to characterize the fennel genotypes using
morphological and molecular markers in order
to evaluate the genetic diversity and
relationships among genotypes lines.
Materials and Methods
Being an open cross-pollinated crop this crop
has the abundant molecular variability and
tremendous scope for development of
improved varieties and characterization of
germplasm. The methods based on
morphological features are commonly used
but they not always allow the most accurate
information due to genotypes-environment
interaction; on the contrary it is well reported
that molecular methods overcome these
problems.
Since not much molecular information is
available in literature for fennel crop using
molecular markers, thus RAPD and ISSR
marker have been used with success to
identify and determine relationships at the
species, population and cultivar levels in many
plant species, including several aromatic and
medicinal plants (Haouari and Ferchichi,
2008).
These methods are widely applicable because
they are rapid, inexpensive, require small
amounts of template DNA and, unlike SSR
markers, do not require prior designing of
primer sequences (Godwin et al., 1997).
RAPD and ISSR markers have been
efficiently used for the study of molecular
diversity in various seed spice crops like
Plant materials
Seventeen (17) diverse fennel genotypes
developed from seven different geographical
regions of the India (Table 1). The seeds were
procured from Gene Bank, ICAR-National
Research Centre on Seed Spices, Tabiji,
Ajmer (Rajasthan), India. Seeds were grown
in pots and kept in seed germinator with
controlled conditions after 20 days of growth;
leaves were cut and frozen in liquid nitrogen
for DNA extraction. The present study was
conducted in Biotechnology Laboratory at
ICAR-National Research Centre on Seed
Spices, Tabiji, Ajmer (Rajasthan), India.
DNA extraction
Leaves were ground in liquid nitrogen to a
fine powder with chilled mortar and pestle.
Genomic DNA was extracted using modified
method of Doyle and Doyle (1990) Cetyl
Trimethyl Ammonium Bromide (CTAB)
method. The quantity and quality of DNA was
determined by electrophoresis on 0.8%
agarose gel as per Choudhary et al., (2016).
DNA samples were diluted to 50 ng μl-1 for
Polymerase
Chain
Reaction
(PCR)
amplification.
795
Int.J.Curr.Microbiol.App.Sci (2018) 7(3): 794-809
RAPD and ISSR-PCR analysis
RAPD-PCR amplification was performed
using 40 random decamer primers obtained
from IDT, India. Out of these 40 primers only
sixteen (16) primers produced reproducible
and scorable amplifications and chosen for
further studies (Table 3). In ISSR-PCR
analysis, only 10 primers were selected for
further analysis out of 20 ISSR primers
obtained from IDT, India. PCR amplifications
for RAPD and ISSR were performed in 20 μl
volume containing 2 μl dNTP (250 μM each
dNTP), 1μl primer (30 ng μl−1), 1 μl template
DNA (50 ng μl−1), 2.5 μl reaction buffer
[(10×) 10 mM Tris-Cl pH 9.0, 50 mM KCl],
0.3 μl Taq DNA polymerase [(5 U μl−1) SRL,
India], 2 μl MgCl2 (25 mM), and 11.2 μl
deionized water. PCR reactions were
performed with DNA thermal cycler (Bio Rad
C1000TM). Amplification conditions were as
follows: an initial denaturation at 94°C for 5
min followed by 1 min denaturation at 94°C
for 36 cycles for RAPD and ISSR,
respectively and 1 min at annealing
temperature (36°C for RAPD; for ISSR, 220C
to 530C it depends upon the primer), 2 min
polymerization at 72°C and 2 min final
extension at 72°C. After the completion of
amplification, 2 μl of gel loading dye (SRL)
was added to each sample and 20 μl volume
was resolved on 1.5 and 2.0% (w/v) agarose
gel for RAPD and ISSR, respectively in 1×
Tris–Borate–Ethylene Diamine Tetra Acetic
Acid (TBE) buffer, gels were stained with
ethidium bromide. The sizes of amplified
DNA fragments were estimated by comprising
them with standard molecular size markers.
The gels were visualized under UV using gel
documentation system (Gelvision, DC, India).
DNA amplifications with each RAPD and
ISSR primers were repeated at least three
times to ensure reproducibility. The bands
were considered reproducible and scorable
only after observing and comparing them in
three separate amplifications for each primer.
Clear and intense bands were scored while
faint bands against smear background were
not considered for further analysis.
Scoring and data analysis
DNA fingerprints were scored for the presence
(1) or absence (0) of bands for various
molecular weight and sizes in the form of
binary matrix. Initially, the potential of both
the markers for estimating molecular
variability of fennel genotypes was examined
by measuring the marker information through
counting of bands. Primer banding patterns
such as number of total bands (TB), number of
polymorphic bands (PB) and percentage of
polymorphic bands (PPB) were obtained. To
analyze the suitability of both the markers for
evaluation of molecular profiles of fennel
genotypes, the performance of the markers
was measured using two basic parameters:
polymorphic information content (PIC),
marker index (MI). The PIC value for each
locus was calculated using formula (RoldanRuiz et al., 2000); PICi = 2fi (1 - fi), Where
PICi is the polymorphic information content
of the locus i, fi is the frequency of the
amplified fragments and 1-fi is the frequency
of non-amplified fragments. The frequency
was calculated as the ratio between the
number of amplified fragments at each locus
and the total number of accessions (excluding
missing data). The PIC of each primer was
calculated using average PIC value from all
loci of each primer. Effective multiplex ratio
was calculated using formula; EMR (effective
multiplex ratio) = n 9 b, where n is the average
number of fragments amplified by accession
to a specific system marker (multiplex ratio)
and b is estimated from the number of
polymorphic loci (PB) and the number of
nonpolymorphic loci (MB); b = PB/(PB+MB).
Marker index for both the markers was
calculated to characterize the capacity of each
primer to detect polymorphic loci among the
genotypes. Marker index for each primer was
796
Int.J.Curr.Microbiol.App.Sci (2018) 7(3): 794-809
calculated as a product of polymorphic
information content and effective multiplex
ratio (Varshney et al., 2007); MI = EMR X
PIC. Data were analyzed to obtain Jaccard’s
coefficients (Jaccard, 1908) among the isolates
by using NTSYS-pc version 2.02e (Rohlf,
1998). The data matrix of both markers was
then converted into molecular similarity
matrix using Jaccard coefficient (Jaccard,
1908) in SPSS 17.0 (SPSS Inc.) and NTSYSPC 2.02j (Rohlf, 1998). The data matrix was
used to determine the molecular diversity,
molecular differentiation and gene flow.
Eigenvalues and eigenvectors were calculated
by the Eigen program using a correlation
matrix as input from NTSYS-pc. The
cophenetic correlation was calculated to find
the degree of association between the original
similarity matrix and the tree matrix in both
morphological and molecular analyses. Using
the Mantel test (Mantel, 1967), a comparison
between both methods was performed for
RAPD and ISSR data sets. Using the same
software, PCA was also carried out to identify
any genetic association among the genotypes.
Further, principal component analysis (PCA)
was performed to highlight the resolving
power of the ordination based on similarity
coefficient of data realized from RAPD and
ISSR average similarity indices using SPSS
statistics 17.0 software (SPSS Inc.).
Results and Discussion
RAPD band pattern
Information on molecular diversity and
relationship among individuals, population,
plant varieties and species are important to
plant breeders for the improvement of crop
plants. Molecular diversity studies can identify
alleles that might affect the ability of the
organism to survive in its existing habitat, or
might enable it to survive in more diverse
habitats. This knowledge is valuable for
germplasm
conservation,
individual,
population, variety or breed identification and
molecular improvement (Duran et al., 2009).
Various types of markers such as
morphological, biochemical and molecular
markers are used for this purpose (Barwar et
al., 2008). Forty RAPD primers having 50%
or more GC content were used for the present
investigation. Out of them only sixteen
primers were satisfactory and reproducible.
The reason for the non-amplifications of the
other 24 primers could not be explained.
Probably the sample DNA did not have any
binding site for the primers. A similar non
amplification of decamer primers was reported
by, Sosinski and Douches (1996) and
Mattagajasingh et al., (2006), in different
plant species. The amplification pattern is
shown in Figure 1 and the details of the RAPD
analysis in Table 3. All these 16 primers
resulted in the amplification of 79 amplified
bands from which 58 were polymorphic and
showed 73.41% polymorphism indicating the
presence of high degree of molecular variation
in the studied fennel varieties. The DNA
amplicon size and polymorphism generated
among various genotypes of fennel using
RAPD primers are presented in Table 3. The
total number of bands observed for every
primer was recorded separately and
polymorphic
bands
were
checked
subsequently. The total number of amplified
bands varied between 2 (primer OPB-06,
OPC-04 and OPC-05) and 9 (primer OPB-07)
with an average of 4.9 bands per primer. The
polymorphism of all 17 fennel genotype were
73.41% and the overall size of PCR amplified
products ranged between 180 bp to 2900 bp.
Similar to the present finding Choudhary et
al., (2013) obtained high level of
polymorphism of 57.66 per cent among Indian
fenugreek varieties. Based on RAPD
similarity matrix data, the value of similarity
coefficient ranged from 0.48 to 0.97 (Table 5).
The average similarity across all the genotypes
was found out to be 0.72 showing that
genotype were polymorphic genetically.
797
Int.J.Curr.Microbiol.App.Sci (2018) 7(3): 794-809
The RAPD cluster tree analysis of 17 fennel
genotypes showed that they were mainly
divided into main three clusters (Figure 3).
Cluster I contain eight genotypes viz., RF-101,
RF-205, RF-178, RF-145, RF-125, RF-143,
RF-281 and AF-1.
These genotypes are developed from same
climatic condition and having similar
longitude and latitude. Among these eight
genotypes AF-1 is out grouped from other due
to minor difference between their places of
origin. All genotypes were developed from
SKRAU-Jobner, Jaipur except AF-1 which is
developed at NRCSS-Ajmer.
Cluster II having five genotypes with diverse
origin and different geographical distribution,
includes, Rajendra-saurabh, Azad-saunf-1,
CO-1, Pant-madhurika and Hisar-swarup.
Among all, Hisar-swarup is outgrouped from
rest of all genotypes at a similarity coefficient
of 0.65. Similarly, in cluster III four genotypes
were present, all these were developed at
SDAU-Jagudan, Gujarat having similar
climatic condition and depicting to be
originated from a single ancestors. The
analysis gave 16 PCs, out of which the first 10
PCs contributed 97.495% of the total
variability of the analyzed genotypes. The first
5 PCs accounted for 83.08% of the total
variability; the first 3 accounted for 70.95% of
the variance, in which maximum variability
was contributed by the first component
(38.16%), followed by the second (20.26%)
and third (12.54%) components. Based on
Mantel Z-statistics (Mantel, 1967), the
correlation coefficient (r) was estimated as
0.95. The r value of 0.91 was considered a
good fit of the UPGMA cluster pattern to
RAPD data (Fig. 4).
ISSR band pattern
10 ISSR primers amplified 59 clear and
scorable bands across 17 fennel genotypes, of
which 51 were polymorphic (Table 4). The
total number of bands observed for every
primer was recorded separately and
polymorphic percentage was calculated
subsequently (Table 4). The total number of
amplified bands varied between 2 (primerUBC-820) and 8 (primers-UBC-810, UBC814 and UBC-824) with an average of 5.9 per
primer.
The polymorphism percentage ranged from as
low as 50% (primer-UBC-821) to as high as
100 % in six primers (Primer-UBC-810, UBC820, UBC-814, UBC-824, UBC-826 and
UBC-827). Average polymorphism across all
the 17 genotypes of fennel was found to be
86.44% showing abundant molecular diversity
at the population level (Sun et al., 2004).
Overall size of PCR amplified products ranged
between 100bp to 1550bp. PIC is a feature of
a primer and, therefore, PIC values were
calculated for all the primers. Maximum,
minimum
and
average
values
of
Polymorphism information content index
(PIC) were found to be 0.66, 0.00 and 0.35,
respectively (Table 4). Since the average value
of PIC (0.35) showed a good efficiency of the
used primers in discrimination of the
individuals. Although the low PIC value
obtained by some IISR markers maybe only
due to low number of IISR loci studied.
Similar results have been reported by other
workers (Pirseyedi et al., 2010; Soriano et al.,
2011).
Marker index (MI) as a feature of marker
diversity was also calculated for all the
primers based on the PIC and polymorphic
bands are showed in Table 4. MI value ranged
from 0 to 5.28 with an average value 1.86.
Highest MI (5.28) was observed with primer
UBC-810 that generated 8 polymorphic
fragments across all the 17 genotypes of
fennel. Based on ISSR similarity matrix data,
the value of similarity coefficient ranged from
0.39 to 0.96 (Table 6).
798
Int.J.Curr.Microbiol.App.Sci (2018) 7(3): 794-809
Table.1 Details of fennel genotypes from different geographical regions of India for the study of
molecular diversity
S.
Genotype Genotype
Geographical region
Latitude
and
No.
Code
1.
G1
GF-1
SDAU-Jagudan (Guj.)
23° 51ꞌ N, 72° 41ꞌE
2.
G2
GF-2
SDAU-Jagudan (Guj.)
23° 51ꞌ N, 72° 41ꞌE
3
G3
GF-11
SDAU-Jagudan (Guj.)
23° 51ꞌ N, 72° 41ꞌE
4
G4
GF-12
SDAU-Jagudan (Guj.)
23° 51ꞌ N, 72° 41ꞌE
5
G5
RF-101
SKNRAU-Jobner (Raj.)
26° 97ꞌ N, 75° 38ꞌE
6
G6
RF-125
SKNRAU-Jobner (Raj.)
26° 97ꞌ N, 75° 38ꞌE
7
G7
RF-143
SKNRAU-Jobner (Raj.)
26° 97ꞌ N, 75° 38ꞌE
8
G8
RF-178
SKNRAU-Jobner (Raj.)
26° 97ꞌ N, 75° 38ꞌE
9
G9
RF-281
SKNRAU-Jobner (Raj.)
26° 97ꞌ N, 75° 38ꞌE
10
G10
RF-145
SKNRAU-Jobner (Raj.)
26° 97ꞌ N, 75° 38ꞌE
11
G11
RF-205
SKNRAU-Jobner (Raj.)
26° 97ꞌ N, 75° 38ꞌE
12
G12
Rajendra-Saurabh
RAU-Dholli (Bhihar)
25° 85ꞌ N, 85° 78ꞌE
13
G13
Azad-Saunf-1
CSAUAT-Kanpur (UP)
26° 50ꞌ N, 80° 30ꞌE
14
G14
CO-1
TAU-Coimbatore (TN)
11° 01ꞌ N, 76° 97ꞌE
15
G15
Pant-Madhuricka
GBPAUT-Pantnagar (UK)
28° 97ꞌ N, 79° 41ꞌE
16
G16
AF-1
NRCSS-Ajmer (Raj.)
26° 45ꞌ N, 74° 64ꞌE
17
G17
Hisar-Swarup
CCHAU-Hisar (HR)
29° 19ꞌ N, 76° 23ꞌE
Longitude
Table.2 Unique/genotype specific bands as detected by 3 RAPD and 1 ISSR primers in 17
genotypes of fennel
RAPD Primers
Genotype
No. of Unique band
Size of Band (bp)
OPB-07
Pant-madurika
1
1850
OPB-11
Co-1
1
210
Hisar-swarup
1
1550
ISSR primer
UBC-810
Total
3
799
Int.J.Curr.Microbiol.App.Sci (2018) 7(3): 794-809
Table.3 Performance of 16 RAPD primers in the molecular diversity analysis of fennel genotypes
Primer*
Sequence 5’ to 3’
G:C (%)
Size (bp)
TGA
TB
PB
MB
PP
PIC
ß
EMR
MI
OPA-01
AGGCCCTTC
70
200-1400
17
6
5
1.00
83.33
0.74
0.83
4.15
3.07
OPB-06
TGCTCTGCCC
70
300-700
17
2
1
1.00
50
0.17
1.0
1.00
0.17
OPB-07
GGTGACGCAG
70
80-1850
17
9
9
0.00
100
0.85
1.0
9.00
7.65
OPB-11
GTAGACCCGT
60
170-1200
17
4
4
0.00
100
0.69
1.0
4.00
2.76
OPD-12
CACCGTATCC
60
250-1000
17
5
4
1.00
80
0.74
1.25
5.00
3.70
OPE-03
CCAGATGCAC
60
300-800
17
2
2
0.00
100
0.32
1.0
2.00
0.64
OPC-01
AACCCGGGAA
60
150-1200
17
6
3
3.00
50
0.79
2.0
6.00
4.74
OPC-02
CCTCTAGACC
60
200-1600
17
7
5
2.00
71.42
0.82
0.71
3.55
2.91
OPC-03
CCGAACACGG
70
250-1600
17
4
3
1.00
75
0.67
0.75
2.25
1.50
OPC-04
GTAGCACTCC
60
400-800
17
2
1
1.00
50
0.37
0.5
0.5
0.18
OPC-05
CTGATACGCC
60
300-600
17
2
1
1.00
50
0.35
0.5
0.5
0.17
OPC-06
GTGGGCTGAC
70
300-1100
17
4
4
0.00
100
0.62
1.0
4.00
2.48
OP7-07
GTCCATGCCA
60
400-1700
17
6
3
3.00
50
0.73
0.5
1.5
1.09
OPC-08
ACATCGCCCA
60
200-1800
17
8
8
0.00
100
0.83
1.0
8.00
6.64
OPC-12
AAGGGCGAGT
60
200-1600
17
5
2
3.00
40
0.57
0.4
0.8
0.45
OPC-16
CCAAGCTGCC
70
80-1050
17
7
3
4.00
42.85
0.83
0.42
1.68
1.39
79
58
73.41
74.53
0.63
0.44
3.37
2.47
Total Average
* Operon series code, TGA=Total Number of Genotype Amplified, TB=Total Number of bands, PB=Polymorphic bands, MB=Monomorpic bands, PP=Percent
polymorphism, PIC, EMR=Effective multiplex ratio, MI=Marker Index
800
Int.J.Curr.Microbiol.App.Sci (2018) 7(3): 794-809
Table.4 Performance of 10 ISSR primers in the molecular diversity analysis of fennel genotypes
Primer*
Sequence 5’ to 3’
TM (0C)
Size (bp)
(AG)8T
45.5
150-1300
UBC807
(GA)8T
44.0
100-1500
UBC810
(GA)8C
44.8
100-1150
UBC811
(CT)8A
43.0
200-1200
UBC814
(CA)8T
48.0
250-1000
UBC816
(GT)8C
50.0
300-500
UBC820
(GT)8G
49.0
300-1000
UBC821
(TC)8G
46.5
150-1550
UBC824
(AC)8C
50.0
180-1400
UBC826
(AC)8G
51.5
300-900
UBC827
Total Average
TGA=Total Number of Genotype Amplified, TB=Total Number of bands,
EMR=Effective multiplex ratio, MI=Marker Index
TGA
17
17
17
17
17
17
17
17
17
17
TB
6
8
7
8
5
2
4
8
7
4
59
PB=Polymorphic
PB
MB
PP
PIC
ß
EMR
MI
4
2
66.66
0.36
0.66
2.40
0.86
8
0
100
0.66
1.00
8.00
5.28
4
3
57.14
0.38
0.57
2.28
0.86
8
0
100
0.58
1.00
8.00
4.64
4
1
80.0
0.27
0.80
3.20
0.86
2
0
100
0.53
1.00
2.00
1.06
2
2
50.0
0.00
0.5
1.00
0.00
8
0
100
0.49
1.00
8.00
3.92
7
0
100
0.00
1.00
7.00
0.00
4
0
100
0.30
1.00
4.00
1.2
51
8
86.44
0.35
0.86
4.58
1.86
bands, MB=Monomorpic bands, PP=Percent polymorphism, PIC,
GF-1
GF-2
GF-11
GF-12
RF-101
RF125
RF-143
RF-178
RF-281
RF-145
RF-205
HISAR-SWARUP
Rajendra-saurabh
AZAD-SAUNF-1
CO-1
Pant-Madhurika
AF-1
1.00
1.00
0.75
0.40
0.18
0.36
0.27
0.20
0.29
0.22
0.20
0.22
0.31
0.44
0.46
0.38
0.34
1.00
0.75
0.40
0.18
0.36
0.27
0.20
0.29
0.22
0.20
0.22
0.31
0.44
0.46
0.38
0.34
1.00
0.45
0.17
0.30
0.25
0.18
0.24
0.18
0.19
0.20
0.33
0.48
0.50
0.45
0.42
1.00
0.02
0.02
0.02
0.02
0.02
0.02
0.02
0.02
0.27
0.33
0.30
0.35
0.33
1.00
0.54
0.71
0.79
0.68
0.90
0.95
0.58
0.16
0.19
0.17
0.18
0.15
1.00
0.72
0.64
0.76
0.62
0.58
0.59
0.23
0.26
0.23
0.24
0.20
1.00
0.68
0.96
0.72
0.75
0.69
0.29
0.28
0.27
0.29
0.24
1.00
0.65
0.71
0.75
0.42
0.18
0.20
0.18
0.20
0.16
801
1.00
0.76
0.72
0.67
0.28
0.30
0.27
0.29
0.24
1.00
0.95
0.59
0.18
0.22
0.19
0.20
0.16
1.00
0.62
0.18
0.20
0.19
0.20
0.17
1.00
0.29
0.20
0.23
0.24
0.24
1.00
0.57
0.56
0.60
0.61
1.00
0.68
0.72
0.60
1.00
0.77
0.55
1.00
0.58
AF-1
PANTMADHU
RIKA
CO-1
RAJEND
RASAURA
BH
AZADSAUNF1
HISARSWARU
P
RF-205
RF-145
RF-281
RF-178
RF-143
RF125
RF-101
GF-12
GF-11
GF-2
GF-1
Table.5 Jaccard similarity matrix generated using UPGMA method with RAPD primers
1.00
Int.J.Curr.Microbiol.App.Sci (2018) 7(3): 794-809
Table.6 Jaccard similarity matrix generated using UPGMA method with ISSR primers
AF-1
PANT-
MADHURI
CO-1
KA
AZAD-
SAUNF-1
RAJENDR
A-
SAURABH
HISAR-
SWARUP
RF-205
RF-145
RF-281
RF-178
RF-143
RF125
RF-101
GF-12
GF-11
GF-2
GF-1
GF-1
1.00
GF-2
1.00
1.00
GF-11
0.94
0.94
1.00
GF-12
0.71
0.71
0.77
1.00
RF-101
0.74
0.74
0.81
0.84
1.00
RF125
0.97
0.97
0.97
0.74
0.77
1.00
RF-143
0.84
0.84
0.90
0.74
0.84
0.87
1.00
RF-178
0.81
0.81
0.87
0.90
0.94
0.84
0.84
1.00
RF-281
0.87
0.87
0.87
0.71
0.81
0.90
0.97
0.81
1.00
RF-145
0.81
0.81
0.81
0.77
0.94
0.84
0.84
0.87
0.87
1.00
RF-205
0.77
0.77
0.84
0.81
0.97
0.81
0.87
0.90
0.84
0.97
1.00
HISAR-SWARUP
0.77
0.77
0.84
0.74
0.77
0.81
0.87
0.71
0.84
0.77
0.81
1.00
Rajendra-saurabh
0.55
0.55
0.61
0.58
0.48
0.58
0.65
0.55
0.61
0.48
0.52
0.65
1.00
AZAD-SAUNF-1
0.52
0.52
0.52
0.42
0.39
0.48
0.55
0.45
0.52
0.39
0.42
0.42
0.77
1.00
CO-1
0.52
0.52
0.52
0.42
0.39
0.48
0.55
0.45
0.52
0.39
0.42
0.48
0.77
0.87
1.00
Pant-Madhurika
0.52
0.52
0.58
0.48
0.45
0.55
0.61
0.52
0.58
0.45
0.48
0.55
0.84
0.87
0.94
1.00
AF-1
0.42
0.42
0.48
0.45
0.35
0.45
0.52
0.42
0.48
0.35
0.39
0.52
0.81
0.65
0.71
0.77 1.0
802
Int.J.Curr.Microbiol.App.Sci (2018) 7(3): 794-809
M G G G GGGGGGG G G G G G G G
1
M
1
2
3
4
5
6
7
8
9
10
11
12
13
14
15
16
17
10kb
2
3Kb
2kb
1KB
1kb
500b
Unique
band
300bp
100bp
Figure 1. RAPD banding pattern generated through primer OPB-07
(M1=100 bp DNA ladder; M2= 1kb DNA ladder, G1-G17 are code of
different genotypes as listed in Table 1). Arrows indicate putative
genotype specific bands.
MG G G G GGGG GG G G G G G G G M
1
2
3
4
5 6 7 8
9 10 11 12
13 14
15 16
17
22kb
5.1kb
3.5kb
2027bp
1375bp
1KB
800bp
831bp
500bp
Unique
band
300bp
100bp
Figure 2. ISSR banding pattern generated through primer UBC-810
(M1=100 bp DNA ladder; M2= Lambda DNA/EcoRI/HindIII double
digest, G1-G17 are code of different genotypes as listed in Table 1.
Arrows indicate putative genotype specific bands
803
Int.J.Curr.Microbiol.App.Sci (2018) 7(3): 794-809
Fig.3 Dandrogram constructed with UPGMA clustering method of 17 genotypes of Fennel using RAPD primers
P
l
a
i
n
S
u
b
tr
o
p
i
c
a
l
r
e
gP
il
oa
ni
n
d
i
v
e
r
s
e
804
S
u
b
-
D
i
v
e
r
s
e
g
e
o
g
r
a
p
h
i
c
a
l
r
e
g
i
o
n
s
Int.J.Curr.Microbiol.App.Sci (2018) 7(3): 794-809
Fig.4 Two and three dimensional PCA analysis using RAPD markers
805
Int.J.Curr.Microbiol.App.Sci (2018) 7(3): 794-809
Fig.5 Dandrogram constructed with UPGMA clustering method of 17 genotypes of Fennel using ISSR primers
806
Int.J.Curr.Microbiol.App.Sci (2018) 7(3): 794-809
The ISSR cluster analysis of 17 fennel
genotype showed that they were mainly
divided into two major clusters at similarity
coefficient of 0.40 (Figure 5). The cluster I
contain five genotypes and out grouped from
other at a similarity coefficient 0.73. In this
cluster all the genotypes belong to different
geographical origin with vast molecular
diversity. Similarly, cluster II have the
remaining twelve genotypes. Similarly,
Farajpour et al., (2012) also asses the
molecular diversity using ISSR in medicinal
plants Achillea millefolium. The analysis gave
16 PCs, out of which the first 10 PCs
contributed 98.03% of the total variability of
the analyzed genotypes. The first 5 PCs
accounted for 82.91% of the total variability;
the first 3 accounted for 69.74% of the
variance, in which maximum variability was
contributed by the first component (42.65%),
followed by the second (15.53%) and third
(11.56%) components. Based on Mantel Zstatistics (Mantel, 1967), the correlation
coefficient (r) was estimated as 0.93. The r
value of 0.949 was considered a good fit of
the UPGMA cluster pattern to ISSR data.
The matrix correlation coefficient r
(normalized Mantel statistic Z) was 0.66753,
which shows the data is significant. The
association amongst different genotypes were
presented in the form of dendogram, the
genotype which lay nearer to each other in
dendogram are more similar to one another
then those lying apart. The dendogram also
showed the relative magnitude of resemblance
among different genotypes of fennel used for
current investigation.
Unique bands in 17 fennel genotypes
Some primers gave unique bands in specific
fennel genotypes as shown in (Table 2).
These primers produced specific DNA bands
which distinguished one genotype from the
rest. Primer OPB-07 generated a unique allele
for Pant-madurika (Figure 1). Primers OPB11 generated a unique band for the CO-1.
Similarly, ISSR primer UBC-810 generated a
unique allele for Hisar-swarup (Figure 2).
In the present investigation, estimation of
genetic variability to establish genetic
relationships through RAPD and ISSR
markers analyses among the fennel genotypes
were successfully revealed. The RAPD and
ISSR data generated from the 17 genotype
were sufficient to provide inferences on
genetic divergence and relationships. The
RAPD and ISSR markers showed a high level
of
polymorphism).
Jaccard’s
genetic
similarity values of RAPD and ISSR also
revealed a high level of genetic diversity
through RAPD and ISSR markers, This high
level of genetic diversity suggests its wide
genetic base which is possibly due to
accumulation of novel gene combinations by
cross pollination. DNA fingerprinting is a
routine method employed to study the extent
of genetic diversity across a set of genotypes
or cultivars and group them into specific
categories. In conclusion, results indicate the
presence of high genetic variability among the
Cumulative data analysis of RAPD and
ISSR molecular marker
Pairwise similarity among the genotypes
ranged from 0.27 to 1.0 based on combined
morphometric RAPD and ISSR. The highest
similarity (100%) was observed between the
GF1 and GF2, whereas the lowest was
observed between RF145 and AF-1. A
dendrogram based on RAPD and ISSR
clustered all 17 genotypes into 3 major
clusters at similarity coefficient of 0.60.
Based on Mantel Z-statistics (Mantel, 1967),
the correlation coefficient (r) was estimated as
0.93. The r value of 0.94 was considered a
good fit of the UPGMA cluster pattern to the
cumulative RAPD and ISSR data. The Mantel
Z test also revealed moderate level of
correlation between RAPD and ISSR data.
807
Int.J.Curr.Microbiol.App.Sci (2018) 7(3): 794-809
elite fennel genotypes. Characterization and
assessment of diversity among the fennel
genotypes have great significance in
designing breeding strategies, both for
qualitative and quantitative traits. By this
study, we have successfully assessed the level
of inter and intra-specific diversity
relationship
among
different
fennel
genotypes. Results derived from this study
would be highly useful in fennel breeding
programs and may be used for further crop
improvement using advance marker systems.
RAPD markers. Legume Research,
36(4): 289-298.
Choudhary, S., Meena, R.S., Singh, R.,
Vishal, M.K., Jethra, G., Saini, M. and
Panwar, A. 2015. Analysis of diversity
among cumin (Cuminum cyminum)
cultivars using RAPD markers. Indian
Journal of Agricultural Sciences, 85(3):
409-413.
Choudhary, S., Pereira, A., Basu, S. and
Verma, A.K. 2017. Differential
antioxidant composition and potential of
some commonly used Indian spices.
Journal of Agrisearch, 4:160-166.
DASD,
205-16.
/images/kerala/SpicesArea_and_Production_in_India.pdf
Doyle, J.J. and Doyle, J.L. 1990. Isolation of
plant DNA from fresh tissue. Focus. 12:
13-15.
Duran, C., Appleby, N., Edwards, D. and
Batley, J. 2009. Molecular Markers:
Discovery, applications, data storage
and visualization. Curr. Bioinfo., 4:1627.
El-Awadi, M.E., and Hassan, E.A. 2010.
Physiological responses of fennel
(Foeniculum Vulgare Mill) plants to
some growth substances. Journal of
American Science. 6:985-991.
Farajpour, M., Ebrahimi, M., Amiri, R.,
Golzari, R. and Sanjari, S. 2012.
Assessment of molecular diversity in
Achillea millefolium accessions from
Iran using ISSR marker. Biochem Syst
Ecol., 43: 73-79.
Godwin, I.D, Aitken, E.A.B. and Smith, L.W.
1997. Application of inter-simple
sequence repeats (ISSR) markers to
plant genetics. Electrophoresis, 18:
1524-1528.
Haouari, M. and Ferchichi, A. 2008. Study of
molecular polymorphism of Artemisia
herba-alba from Tunisia using ISSR
markers. Afr. J. Biotechnol., 7(1): 4450.
Acknowledgement
The authors gratefully acknowledge the
Director, ICAR- National Research Centre on
Seed Spices, Ajmer, Rajasthan for providing
facility, support and cooperation during
course of investigation.
References
Barwar, A., Sangwan, M.L., Kumar, S. and
Ahlawat, S. 2008. Molecular diversity
between Murrah and Bhadawari breeds
of Indian buffalo using RAPD-PCR.
Indian. J. Biotechnol. 7 491-495.
Choudhary, S., Jethra, G., Sharma, R. and
Verma, A.K. 2017. Microsatellite in
coriander: A cross species amplification
within Apiaceae family. International
Journal of Current Microbiology and
Applied Sciences, 6(5): 2714-2721.
Choudhary, S., Jethra, G., Sharma, R.,
Tripathi, A., Mishra, J. and Pareek, D.
2016. Rapid and reliable method for
high quality RNA isolation from major
seed spices. Journal of Plant
Development Sciences, 8(2): 79-82.
Choudhary, S., Meena, R.S., Singh, R.,
Vishal, M.K., Choudhary, V. and
Panwar, A. 2013. Assessment of genetic
diversity among Indian fenugreek
(Trigonella foenum -graecum L.)
varieties using morphological and
808
Int.J.Curr.Microbiol.App.Sci (2018) 7(3): 794-809
Jaccard, P. 1908. Nouvelles recherches sur la
distribution florale. Bull Soc Vaudoise
C. Sci Nat 44: 223-270.
Mantel, N. 1967. The detection of disease
clustering and a generalized regression
approach. Cancer Res, 27(2) 209–220.
Mattagajasingh, I., Mukherjee, A.K. and Das,
P. 2006. Genomic relations among 31
species of Mammillaria haworth
(Cactaceae) using Random Amplified
Polymorphic DNA. Z Naturforsch, 61:
583-591.
Pirseyedi, S.M., Valizadehghan, S., Mardi,
M., Ghafari, M.H., Mahmodi, P.,
Zahravi, M., Zeinalabedini, M. and
Khayam Nekoui, S.M. 2010. Isolation
and
characterization
of
novel
microsatelite Markers in Pomegranate
(Punica granatum L.). Int. J. Mol. Sci.,
1: 2010-2016.
Rohlf, F.J. 1998. NTSYS-PC Numerical
taxonomy and multivariate analysis
system. Version 2.02e. EXETER
Software, New York.
Roldán-Ruiz, I., Calsyn, E., Gilliland, T.J.,
Coll, R., Van Eijk, M.J.T. and De
Loose, M. 2000. Estimating molecular
conformity between related ryegrass
(Lolium)
varieties.
2.
AFLP
characterization. Mol. Breeding 6: 593–
602.
Saleha, Y.M.A. 2011. Investigation of the
molecular toxicology of dill and fennel
extracts and cyclophosphamide in male
rats by RAPD-PCR assay. Journal of
American Science, 7(9): 398-408.
Saravanaperumal, S.A. and Terza, A.L. 2012.
Polyphenolics free DNA isolation and
optimization of PCR RAPD for fennel
(Foeniculum vulgare Mill.) from mature
and young leaves. African Journal of
Biotechnology, 11(35): 8622-8631.
Singh, S.K., Kakani, R.K., Meena, R.S.,
Pancholy, A., Pathak, R. and Raturi, A.
2012. Studies on genetic divergence
among Indian varieties of a spice herb.
Coriandrum sativum. Journal of
Environmental Biology, 33: 781-789.
Soriano, J.M., Zuriaga, E., Rubio, P., Llacer,
G., Infante, R., and Badenes, M.L.
2011. Development and characterization
of
microsatellite
markers
in
pomegranate (Punica granatum L.).
Mol Breding, 27: 19-128.
Sosinski, B. and Douches, D.S. 1996. Use of
PCR based DNA amplification to
fingerprint North American potato
cultivars. Horticulture Science, 31: 130133.
Sun, K., Chen, W., Ma, R.J. and Chen, X.
2004. A study on the molecular
diversity of subpopulations of Hipophae
rhamnoides spp. Sinensis at Ziwuling,
Gansu. Journal of Lanzhou University
(Natural University), 40(3): 72-75.
Varshney, R.K., Chabane, K., Hendre, P.S.,
Aggarwal, R.K. and Graner, A. 2007.
Comparative assessment of EST-SSR,
EST-SNP and AFLP markers for
evaluation of molecular diversity and
conservation of molecular resources
using wild, cultivated and elite barleys.
Plant Sci., 173: 638-649.
How to cite this article:
Sharda Choudhary, Radheshyam Sharma, R.S. Meena and Arvind Kumar Verma. 2018.
Molecular Diversity Analysis in Fennel (Foeniculum vulgare Mill) Genotypes and its
Implications for Conservation and Crop Breeding. Int.J.Curr.Microbiol.App.Sci. 7(03): 794809. doi: />
809