Impact of different seed rates on yield and economics of direct seeded rice in eastern vidharbha zone of Maharashtra, India
Bạn đang xem bản rút gọn của tài liệu. Xem và tải ngay bản đầy đủ của tài liệu tại đây (389.42 KB, 11 trang )
Int.J.Curr.Microbiol.App.Sci (2018) 7(3): 32-42
International Journal of Current Microbiology and Applied Sciences
ISSN: 2319-7706 Volume 7 Number 03 (2018)
Journal homepage:
Original Research Article
/>
Impact of Different Seed Rates on Yield and Economics of Direct Seeded
Rice in Eastern Vidharbha Zone of Maharashtra, India
Usha R. Dongarwar1, Nitin Patke2, L.N. Dongarwar3 and Sumedh R. Kashiwar4*
1
Krishi Vigyan Kendra, Bhandara (Sakoli), Maharashtra - 441802, India
Zonal Agricultural Research Station, Sindewahi, Maharashtra - 441222, India
3
Dr. Panjabrao Deshmukh Krishi Vidhyapeeth, Akola, Maharashtra – 444001, India
4
Institute of Agriculture, Visva-Bharati, Santiniketan, West Bengal - 731236, India
2
*Corresponding author
ABSTRACT
Keywords
Direct-seeded rice,
Seed rate, GMR,
NMR, Sye-2001,
PKV-HMT
Article Info
Accepted:
04 February 2018
Available Online:
10 March 2018
An experiment was conducted, for three consecutive years to evaluate the effect of seed
rates on yield and economic traits in Bold as well as Fine seeded rice variety in terms of
Direct-Seeded technique. The experiment was laid out in Factorial Randomized Block
design and replicated thrice. Study concluded that Pooled means of seed rates at Sakoli
indicated that sowing of 75 kg seed ha-1 (3458 kg ha-1) was expressively higher in grain
yield but was at par with sowing of 50 kg seedha -1. As well as pooled mean at Sindewahi
indicated that Variety Sye-2001 was higher in grain yield (3631 Kg ha -1) of Rice than PKV
HMT. The pooled mean of grain yield over three seasons and two locations revealed that
variety Sye-2001 was significantly higher in grain yield over PKV HMT Variety. Among
seed rates, 75 kg seedha-1 recorded significantly higher grain yield over other seed rates
but was at par with 50 kg seedha-1. Interaction effect showed the variety Sye-2001 was
significantly highest in grain yield at 75 kg seedha-1 and PKV HMT variety at 50 kg ha-1.
Also the highest GMR, NMR and B:C ratio was recorded in Sye-2001 with 75 kg seed rate
ha-1 and in PKV HMT at 50 kg Seedha-1.
increases total plant weight per unit area and
decreases the total weight per plant (Yoyock
et al., 1979). The number of plants per unit
area has an impact on plant architecture,
modifies growth and development pattern and
effects on the production photosynthesis
(Abuzar et al., 2011). The increase in plant
density increases the yield up to a limit and
thereafter a leveling off or decline in yield
(Sivaesarajah et al., 1995). The reason for the
reduction in yield is due to the reduction in
resources per plant. So the reduction in yield
Introduction
Seed rate has a great impact on plant density
and the competitiveness of the crop stand,
tiller, time to maturity and yield. Low plant
density and improper sowing method are the
most important factors of agronomic
constraints for obtaining higher yields and
have a positive influence on the yield of rice.
Optimum plant density is the primary factor
for obtaining higher yield in rice (Sivaesarajah
et al., 1995). The increase in plant density
32
Int.J.Curr.Microbiol.App.Sci (2018) 7(3): 32-42
(S1), 75 kg seed ha-1 (S2), 100 kg seed ha-1
(S3), 125 kg seed ha-1 (S4) and 150 kg seed
ha-1 (S5). The experiment was planned in a
Factorial Randomized Block Design and
replicated thrice. The soil of experimental site
was analyzed for initial soil nutrient status
(Table 1) and the application of recommended
dose of 125:62.5:62.5 kg NPK ha-1 was
common in all combinations. Date of Sowing
and harvesting was strictly followed for
consequent three years (Table 2).
will not be compensated by increasing plant
number. Direct seeding technique offers a
useful option to reduce the limitations of
transplanted rice. Direct seeding is being
practiced in many developed countries where
labour is scarce and expensive (Pingali et al.,
1994). Direct-seeded rice occupies 26% of the
total rice area in South Asia (Gupta et al.,
2006). Direct seeding of rice avoids puddling,
does not need continuous submergence, and
thus reduces the overall water demand for rice
culture. When rainfall at planting time is
highly variable, direct seeding may help
reduce the production risk (Singh et al., 2006).
Direct seeding can also reduce the risk by
avoiding terminal drought that lowers the
yield of transplanted rice, especially if the
latter is established late due to delayed
rainfall. Direct seeding can facilitate crop
intensification (Singh et al., 2008). In
Vidharbha region of Maharashtra, rice is
majorly grown by puddled transplanting
method, which is laborious and costly method.
The peak period of rice transplanting is in the
month of July, which results in labour
shortage at the time of transplanting. For this
instance, the present study aimed to find out
the suitable seed rate for bold and fine seeded
rice under drill condition, effect of different
seed rates on yield and yield attributing
characters of drilled rice and the economics
Results and Discussion
Growth traits
Average results observed in growth traits as
influenced by various seed rates on Bold and
Fine seeded variety throughout three-year
shows, as seed rate increases the plant height,
grains panicle-1, length of panicle and
effective tillers sq. m-1 decreases eventually
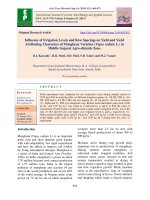
(Table 3). In term of plant height V1 showed
up 94.09 cm, was at its best among entire
treatment combinations for three years
followed by V1V2S3 attended 90.36 cm and
V1V2S2 was at 89.30 cm. Number of tillers
sq. m-1 was recorded highest in V1 (531.73)
but the fine seeded variety V2 showed 442.73
tillers sq. m-1 (Table 3). Some different trends
had been noticed like the number of tillers sq.
m-1 was increasing as seed rate increases in
both varieties. Number of effective tillers sq.
m-1 was noticed superior at V1V2S3 (289.17)
and V1V2S2 (285.33) in Bold as well as Fine
seeded variety. Seed rate of 50 and 75 kg ha-1
results the average panicle length of 20.95 cm
and 20.25 cm but V1 showed the highest
panicle length of 21.59 cm in consecutive
three years average record (Table 3). The fine
seeded variety V2 recorded the highest 179.09
grains panicle-1 afterward V1V2S2 and V1V2S3
were at par to each other throughout the
growing seasons. Miller et al., (1991) found
that panicle is a key factor that determines and
contributes 89 % of differences in yield. These
results are in line with those of Kenneth et al.,
Materials and Methods
The study was aimed to investigate the effect
of different seed rates on yield and growth
traits of bold and fine seeded rice varieties.
Study conducted during three rainy (kharif)
seasons of 2013-2016 at two locations Krishi
Vigyan
Kendra,
Bhandara
(Sakoli),
Maharashtra, India and Zonal Agricultural
Research Station, Sindewahi, Maharashtra,
India. The experimental material comprised of
two well-known rice varieties viz., Bold
seeded: Sye-2001 (V1) and Fine seeded: PKVHMT (V2) with five different seed rate
combinations like Sowing of 50 kg seed ha-1
33
Int.J.Curr.Microbiol.App.Sci (2018) 7(3): 32-42
(1996) who reported rough rice has gained
high yield in the optimum plant stand. V1V2S3
and V1V2S2 showed the significantly highest
grain yield sq. m-1 of 389.33 and 377.20 but in
terms of variety V1 results the high in grain
yield. This is in agreement with the studies
reported by Mahajan et al., (2004), Hardev et
al., (2014) and Rajiv et al., (2013). Basically
V1 is Bold seeded variety so it has the high
test weight of 25.72 g and V2 was at 14.34 g.
Similar results showing that yield of rice
linearly increased with seed rate (density) has
been reported by Baloch et al., (2002). The
plants at low seed rate have sufficient space
and this enables to utilize more nutrients,
water and solar radiation for better
photosynthesis. Hence, the individual plants
performed better. This is in agreement with
the studies reported by Baloch et al., (2002),
Akbar et al., (2004), Prasad et al., (1999),
IRRI (2008), Subbaiah et al., (2002), Gill et
al., (2008), Sharma et al., (1992), Mahajan et
al., (2006), Dongarwar et al., (2015) and
Abou-Khalifa et al., (2014).
2001 was significantly higher, in grain yield of
rice, with 3225 kg ha-1 of grain yield, Whereas
V2- PKV HMT recorded grain yield of 2581
kg ha-1. Among various seed rates, V1V2S2 (75
kg seed ha-1) showed 3458 kg ha-1 of grain
yield was higher but was at par with sowing of
V1V2S1 (50 kg seed ha-1) with the yield of
3319 kg ha-1 (Table 6). The seed rate 50 kg
and 75 kg ha-1) were at par with each other
and significantly superior over other
treatments. Pooled means of interaction of
variety and seed rate at KVK, Bhandara
(Sakoli) revealed that variety bold seeded V1Sye-2001 was higher yield at S2 (75 kg ha-1)
and fine seeded PKV HMT recorded best
results at S1 (50 kg ha-1) seed rates (Table 7).
Zhao et al., (2007), Chauhan et al., (2011),
Gill et al., (2006), Phuong et al., (2005) and
Kaun et al., (2014) also reported similar
results. The results of pooled mean of grain
yield over three seasons of both locations
revealed that bold seeded V1 - Sye-2001
variety recorded 3578 kg ha-1 of grain yield,
which was expressively higher grain yield
over fine seeded V2 - PKV HMT Variety with
2874 kg ha-1 of yield.
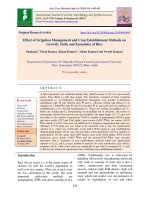
Yield traits
Pooled means of three consecutive years at
ZARS Sindewahi location point to bold
seeded variety V1 - Sye-2001 for highest grain
yield of 3631 Kg ha-1 than PKV HMT at 3167
kg ha-1. V1V2S2 (75 kg ha-1 seed rate) was
recorded significantly highest yield over other
treatment with 3710 kg ha-1 of yield (Table 4).
Interaction effects between variety and seed
rate resulted as significant. V1 - Sye-2001
recorded 4162 kg ha-1 grain yield, which was
superior, over all other combinations, and V2 PKV HMT, recorded significantly higher
yield, in seed rate S1 - 50 kg seed ha-1 of 3710
kg ha-1 (Table 5). This is in agreement with
the studies reported by Zhao et al., (2007),
Chauhan et al., (2011), Gill et al., (2006),
Phuong et al., (2005), Dongarwar et al.,
(2015) and Kaun et al., (2014). Pooled means
of KVK, Bhandara (Sakoli) location for entire
three years indicated that, variety V1 - Sye-
Among different seed rates V1V2S2 (75 kg
seed ha-1) recorded 3584 kg ha-1 of grain yield
which was significantly higher grain yield,
over other seed rates but was at par, with S1
(50 kg seed ha-1) which was with 3485 kg ha-1
of yield (Table 8). Interaction effect between
variety and seed rate revealed that that V1 Sye2001 variety recorded 4167 kg ha-1 of grain
yield, which was significantly higher grain
yield at S2 - 75 kg seed ha-1. V2 PKV HMT
variety recorded yield of 3483 kg ha-1 at S1
(50 kg seed ha-1) (Table 9). This is in
agreement with the studies reported by
Kumhar et al., (2016), Payman et al., (2008),
Walia et al., (2009), Baloch et al., (2002),
Akbar et al., (2004), Prasad et al., (1999),
IRRI 2008, Subbaiah et al., (2002), Gill et al.,
(2008), Sharma et al., (1992), Mahajan et al.,
(2006) and Abou-Khalifa et al., (2014).
34
Int.J.Curr.Microbiol.App.Sci (2018) 7(3): 32-42
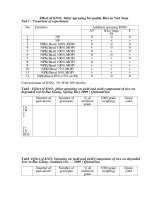
Table.1 Initial soil fertility status of ZARS Sindewahi and KVK, Bhandara (Sakoli),
Maharashtra, India
Locations
Method used
Particulars
pH
EC (dsm-1)
Organic Carbon
(%)
Available N
kg/ha
Available P2O5
kg/ha
Available K20
kg/ha
ZARS Sindewahi
KVK, Sakoli
7.30
0.22
0.48
7.30
0.18
0.49
221.00
234.00
30.2
25.6
290.00
318.00
pH meter (Piper,1966)
Conductivity meter (Jackson,1967)
Walkley and Black method
(Jackson,1967)
Alkaline permanganate method
(Subbiah & Asija, 1956)
Olsen’s method (Jackson,1967)
Neutral normal ammonium acetate
method (Jackson,1967)
Table.2 Dates of sowing and harvesting at ZARS Sindewahi and KVK, Bhandara (Sakoli),
Maharashtra, India
Date of sowing
Date of Harvesting
Parameter
Sindewahi
Sakoli
Sindewahi
Sakoli
First Year
01.07.2013
08.07.2013
08.11.2013
15.11.2013
Second Year
01.07.2014
08.07.2014
28.11.2014
11.11.2014
Third Year
01.07.2015
08.07.2015
10.11.2015
20.11.2015
Table.3 Average Ancillary Characters as influenced by different seed rates at ZARS Sindewahi
and KVK, Bhandara (Sakoli), Maharashtra, India
Plant
No. of
No. of
Length
No. of
Grain
Test
Treatments
Height
tillers
effective
of
grains
yield
weight
(cm)
sq. m-1
tillers sq. panicle
per
sq.m-1
m-1
(cm)
panicle
(g)
(g)
91.09
531.73
275.33
21.59
114.12
371.20
25.72
V1
V2
84.92
442.44
236.26
19.57
179.09
303.46
14.34
V1V2S1
86.20
461.67
232.67
20.25
137.43
288.33
20.13
V1V2S2
89.30
481.50
285.33
20.95
156.53
377.00
19.96
V1V2S3
90.36
469.50
289.17
21.10
159.25
389.33
20.17
V1V2S4
88.25
512.33
253.50
20.63
148.65
351.50
20.19
V1V2S5
85.92
520.44
218.33
19.98
131.15
280.50
19.72
35
Int.J.Curr.Microbiol.App.Sci (2018) 7(3): 32-42
Table.4 Pooled Mean of grain yield of Rice (Kg ha-1) as influenced by various treatments at
Sindewahi, Maharashtra, India
Grain yield kg ha-1
2014-15
Treatment
2013-14
Main plot : Varieties
3441
V1
3298
V2
110
SEm±
NS
CD @ 5%
12.62
CV %
Sub Plot Seed rates
3578
V1V2S1
3612
V1V2S2
3448
V1V2S3
3217
V1V2S4
2994
V1V2S5
114
SEm±
341
CD @ 5%
8.26
CV %
Interaction between Variety x Seed Rate
161
SEm±
NS
CD @ 5%
8.26
CV %
2015-16
Pooled mean
3427
2781
91.0
554
11.36
4023
3422
49
298
8.10
3631
3167
39
236
6.42
3245
3392
3099
2991
2794
98
295
7.75
3968
4125
3697
3545
3279
119
356
7.80
3597
3710
3415
3251
3023
78
233.0
5.60
139
433
7.75
168
522
7.80
110
342
5.60
Table.5 Pooled Interaction effect of Grain yield as influenced by different seed rates at
Sindewahi, Maharashtra, India
Treatments
V1
V2
Mean
S1
3484
3710
3597
SEm±
CD @ 5%
CV %
S2
4162
3257
3710
S3
3697
3132
3415
S4
3514
2988
3251
S5
3296
2750
3023
Mean
3631
3167
110
342
5.60
Table.6 Pooled Mean of grain yield of Rice (Kg ha-1) as influenced by various treatments at
Sakoli, Maharashtra, India
Treatment
2013-14
Main plot : Varieties
3424
V1
2436
V2
118
SEm±
720
CD @ 5%
15.63
CV %
Sub Plot Seed rates
3079
V1V2S1
3322
V1V2S2
2872
V1V2S3
2710
V1V2S4
2667
V1V2S5
128
SEm±
383
CD @ 5%
10.67
CV %
I Interaction between Variety x Seed Rate
181
SEm±
562
CD @ 5%
10.67
CV %
Grain yield kg ha-1
2014-15
2015-16
Pooled mean
3275
2471
52
317
7.02
3878
2835
61
370
7.01
3225
2581
44
266
5.55
3226
3265
2810
2594
2471
139
416
11.82
3652
3788
3276
3183
2884
126
379
9.22
3319
3458
2986
2829
2674
74
222
5.95
196
610
11.82
179
556
9.22
105
327
5.95
36
Int.J.Curr.Microbiol.App.Sci (2018) 7(3): 32-42
Table.7 Pooled Interaction effect of Grain yield as influenced by different seed rates at Sakoli,
Maharashtra, India
S1
S2
S3
S4
S5
Mean
Treatments
3383
4172
3515
3360
3197
3525
V1
3255
2744
2456
2299
2151
2581
V2
3319
3458
2986
2829
2674
Mean
105
SEm±
327
CD @ 5%
5.95
CV %
Table.8 Pooled mean of grain yield (Kgha-1) as influenced by different treatments at ZARS
Sindewahi and KVK, Bhandara (Sakoli), Maharashtra, India
Treatment
Sindewahi
Grain yield (Kg ha-1)
Sakoli
Main plot : Varieties
3631
V1
3167
V2
39
SEm±
236
CD @ 5%
4.42
CV %
Sub Plot: Seed rates
3597
V1V2S1
3710
V1V2S2
3415
V1V2S3
3251
V1V2S4
3023
V1V2S5
78
SEm±
233.0
CD @ 5%
5.60
CV %
Interaction between Variety x Seed Rate
110
SEm±
342
CD @ 5%
5.60
CV %
Pooled mean (Kg ha-1)
3225
2581
44
266
5.55
3578
2874
30
183
3.61
3319
3458
2986
2829
2674
74
222
5.95
3458
3584
3200
3040
2848
53
159
4.02
105
327
5.95
75
233
4.02
Table.9 Pooled Interaction effect of Grain yield as influenced by different seed rates at ZARS
Sindewahi and KVK, Bhandara (Sakoli), Maharashtra, India
S1
S2
S3
S4
S5
Mean
Treatments
3434
4167
3606
3437
3246
3578
V1
3483
3001
2794
2644
2450
2874
V2
3458
3584
3200
3040
2848
Mean
Sig.
F Test
75
SEm±
233
CD @ 5%
4.02
CV %
37
Int.J.Curr.Microbiol.App.Sci (2018) 7(3): 32-42
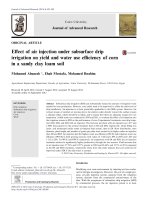
Table.10 Average Cost of cultivation, GMR, NMR and B:C ratio as influenced by different
treatments at ZARS Sindewahi and KVK, Bhandara (Sakoli), Maharashtra, India
Treatment
Pooled Grain
yield (Q/ha)
Main plot : Varieties
3578
V1
2874
V2
Sig
F Test
30
SEm±
183
CD @ 5%
3.61
CV %
Sub Plot: Seed rates
3458
V1V2S1
3584
V1V2S2
3200
V1V2S3
3040
V1V2S4
2848
V1V2S5
Sig
F Test
53
SEm±
159
CD @ 5%
4.02
CV %
Interaction between Variety x Seed Rate
Sig.
F Test
75
SEm±
233
CD @ 5%
4.02
CV %
Cost of
cultivation
Gross Monetary
Return (Rs/ha)
Net Monetary
Return(Rs/ha)
B:C
ratio
33500
34000
50092
51736
Sig
355
2159
2.70
18047
18714
NS
493
3001
10.39
1.49
1.52
32375
33062
33750
34438
35125
55380
56175
50391
47849
44776
Sig
890
2667
4.28
24271
24506
17850
14568
10760
Sig
1080
3239
14.40
1.71
1.69
1.49
1.38
1.27
Sig
1258
3916
4.28
Sig
1528
4756
14.40
Table.11 Interaction effect on GMR as influenced by different seed rates at ZARS Sindewahi
and KVK, Bhandara (Sakoli), Maharashtra, India
S1
S2
S3
S4
S5
Mean
Treatments
48074
58341
50487
48114
45451
50093
V1
62688
54011
50296
47586
44103
51737
V2
55381
56176
50392
47850
44777
Mean
1258
SEm±
3916
CD @ 5%
4.28
CV %
Table.12 Interaction effect on NMR as influenced by different seed rates at ZARS Sindewahi
and KVK, Bhandara (Sakoli), Maharashtra, India
S1
S2
S3
S4
S5
Mean
Treatments
17277
27067
18558
15246
12085
18047
V1
31264
21946
17143
13889
9330
18714
V2
24271
24506
17850
14568
10707
Mean
1528
SEm±
4756
CD @ 5%
14.40
CV %
38
Int.J.Curr.Microbiol.App.Sci (2018) 7(3): 32-42
Table.13 Treatment wise Cost of cultivation (INR ha-1) at ZARS Sindewahi and
KVK, Bhandara (Sakoli), Maharashtra, India
Cost of cultivation (INR ha-1)
Treatments
32250.00
V1S1
32875.00
V1S2
33500.00
V1S3
34125.00
V1S4
34750.00
V1S5
32500.00
V2S1
33250.00
V2S2
34000.00
V2S3
34750.00
V2S4
35500.00
V2S5
studies reported by Huang et al., (2013),
Mehala et al., (2016), Singh et al., (2005),
Rao et al., (2007), Naresh et al., (2010),
Jagagir et al., (2005), Younas et al., (2016),
Awan et al., (2005), Kahloon et al., (2012)
and Mazher et al., (2017). The cost of
cultivation of entire combinations has shown
the normal phenomenal results of cultivars as
the seed rate increases the cost of cultivations
also increases (Table 13). These results were
in accordance to Kumar et al., (2011) reported
that labor saving of 86% and cost saving of
87% in Direct Seeded Rice compared to
manual transplanting.
Economics traits
Labour saving of Direct Seeded Rice reduces
11.2% of total production cost as well as
Direct Seeded Rice methods have several
advantages over transplanting (Singh et al.,
(2005; Naresh et al., (2010). In addition to
higher economic returns, Direct Seeded Rice
crops are faster and easier to plant and less
labor intensive (Jehangir et al., (2005). Thus,
it is necessary to change the cultivation
system from transplanting to direct seeded
rice (Sanjitha Rani and Jayakiran, 2010).
In terms of Gross monetary return, V1V2S2
recorded the highest GMR with 56175 INR
ha-1, in the same combination Net monetary
return was also noticed higher with 24506
INR ha-1 with the B:C Ratio of 1.69 (Table
10). Whereas other combinations were not up
to the mark for recommendations. The
interaction effect of both locations for GMR,
NMR and B: C stated that V1 was best with
58341 INR ha-1, 27067 INR ha-1 of GMR and
NMR respectively only when it is
transplanted with the seed rate of S2 - 75 kg
ha-1(Table 11). Effect on fine seeded variety
V2- PKV HMT was high in V2S1 combination,
which was reported 62688 INR ha-1, 31264
INR ha-1 of GMR and NMR respectively
(Table 12). This is in agreement with the
In paddy, a labor saving of 95-99% in Direct
Seeded Rice was recorded compared to
transplanting during three years. Sehrawat et
al., (2010) also observed 13-16% labor saving
in Direct Seeded Rice as compared to manual
puddled transplanted rice. Kumar (2011) also
recorded similar findings and found higher B:
C ratio in Direct Seeded Rice as compared to
transplanted rice. To get the highest grain
yield, Gross monetary returns and net
monetary returns from drilled rice in Eastern
Vidarbha Zone of Maharashtra, 75 kg seed
ha-1 for course varieties and 50 kg seed rate
ha-1 for fine varieties with application of 125:
62.5: 62.5 kg NPK ha-1 is recommended. This
is in agreement with the studies reported by
39
Int.J.Curr.Microbiol.App.Sci (2018) 7(3): 32-42
Gangetic plains. Indian J. Agric. Sci. 78:
655-58.
Gill M.S., Ashwini K. and Pardeep K. 2008.
Growth and yield of rice (Oryza sativa)
cultivars under various methods and times
of sowing. Indian Journal of Agronomy.
51(2): 123-127.
Gill MS, Kumar P and Kumar A. 2006. Growth
and yield of direct-seeded rice (Oryza
sativa) as influenced by seeding technique
and seed rate under irrigated conditions.
Indian Journal of Agronomy 51(4): 283287.
Gupta R K, Ladha J K, Singh S, Singh R G, Jat M
L, Saharawat Y, Singh V P, Singh S S,
Singh G, Sah G, Gathala M, Sharma R K,
Gill M S, Alam Murshad, Mujeeb Ur
Rehman Hafiz, Singh U P, Mann, Riaz A
Pathak, Chauhan H, Bhattacharya B S and
Malik P R K. 2006. Production Technology
for direct seeded rice. Rice- Wheat
Consortium for the Indogangetic Plains, pp
16. New Delhi.
Hardev, R. Singh, J. P. Bohra, J. S. Singh K. R.
and Sutaliya, J. M. 2014. Effect of seedling
age and plant spacing on growth, yield,
nutrient uptake and economics of rice
genotypes
under
system
of
rice
intensification. Indian J. Agron., 59(2):
256-260.
Huang, H.-P., S.-M. Ma, E.-D. Lin, et al., (2013).
Benefits comparison analysis of different
rice and wheat cropping patterns to adapt to
climate change. Adv. Clim. Change Res.,
4(3), doi:10.3724/SP.J.1248.2013.182.
Hussain, S., Ramzan, M., Rana, M. A., Mann R.
A. and Akhter, M. 2013. Effect of various
planting techniques on yield and yield
components of rice. The Journal of Animal
& Plant Sciences, 23(2): 672-674.
International Rice Research Institute (IRRI).
2008. Rice Production Training Module:
Method of Planting Rice. IRRI, Los Barios,
Laguna, Philippines. pp. 1-13.
Iqbal, M. F., Hussain, M., Waqar, M. Q., and Ali,
M. A. 2015. Effect of sowing methods on
disease of paddy. Int. J. Adv. Mutli-discip.
Res. 2(10):4-7.
Jackson, M.L., 1973. Soil Chemical Analysis.
Printice Hall Inc. Engiewood Cliffs. N. J.
U.S.A.
Husaain et al., (2013), Awan et al., (2005),
Kumar et al., (2011), Iqbal et al., (2015),
Seharawat et al., (2010), Gangawar et al.,
(2008) and Sidhu et al., (2014).
References
Abou Khalifa A A., ELkhoby, W., and Okasha, E.
M. 2014. Effect of sowing dates and seed
rates on some rice Cultivars. African
Journal of Agricultural Research. 9(2): 196201.
Abuzar M.R., Sadozai G.U., Baloch M.S., Shah
A.A., Javaid T., and N. Hussain N., Effect
of plant population densities on yield of
maize, The J. of Ani. and Plant Sci., 21(4),
692-695 (2011).
Akbar N. and Ehsanullah. 2004. Agro-Qualitative
Responses of Direct Seeded Fine Rice to
Different Seeding Densities, Pak. J. of
Agric. Sci., 41, 1-2.
Annual Maharashtra State Rice Workshop
Progress Report, 4-5 March, 2014 pp. 12.
Awan, T. H., I. Ali, C. M. Anwar, G. M. Sarwar,
C. M. Ahmad, Z. Manzoor and M. Yaqub
(2005). Economic effect of different plant
establishment
techniques
on
rice
production. In Proc. Int. Seminar on Rice
Crop, RRI, KSK, Lahore, Punjab- Pakistan.
2-3, October 2005. Pp: 226- 231.
Baloch A.W., Soomro A.M., Javed M.A. and
Ahmed M., Optimum plant density for high
yield in rice, Asian J. Plant Sci., 1, 25–27
(2002).
Chauhan BS, Singh VP, Kumar A and Johnson
DE. 2011. Relations of rice seeding rates to
crop and weed growth in aerobic rice. Field
Crops Research 121: 105-115.
Dongarwar, U. R., Khedikar, G. R., Kashiwar S.
R., and Dongarwar L., 2015, Effect of
different Organic Sources Available with
Farmers on Paddy (Oryza sativa) in
Bhandara District of Maharashtra, Journal
of Agricultural Engineering and Food
Technology, 2 (2), 142-144.
Gangwar, K.S., Tomar. O.K. and Pandey D.K.
2008. Productivity and economics of
transplanted and direct-seeded rice (Oryza
sativa)-based cropping systems in Indo-
40
Int.J.Curr.Microbiol.App.Sci (2018) 7(3): 32-42
Jehangir, W. A., Masih, I., Ahmed, S., Gill, M.
A., Ahmad, M., Mann, R. A, Chaudhary,
M. R., and Turral, H.2005. Sustaining crop
water productivity in rice-wheat systems of
South Asia: a case study from Punjab
Pakistan. In: Draft Working Paper. Inter.
Water Manag. Ins. Lahore, Pakistan.
Kahloon, M.H., M.F. Iqbal, M. Farooq, L. Ali, M.
Fiaz and I. Ahmad. 2012. A comparison of
conservation technologies and traditional
techniques for sowing of wheat. J. Anim.
Plant Sci. 3: 827-830.
Kashiwar, S. R., Kumar, D., Dongarwar, U. R.,
Mondal, B., and Nath, T. 2016.
Experiences, challenges and Opportunities
of Direct Seeded Rice in Bhandara District
of Maharashtra. Journal of Energy Research
and Environmental Technology (3) 2: 141145
Kaur, S., and Singh, S. 2014. Influence of crop
density on weeds, growth and yield of
direct-seeded rice. Indian Journal of Weed
Science 46(4): 318–321.
Kenneth and Ronnie S. Halms, Seeding rate effect
on rough rice yield, head rice and total
milled rice, Agron. J., 88, 82-84 (1996)
Kumar, V. and Ladha, J. K. 2011. Direct seeding
of rice: Recent developments and future
research needs. Adva. Agro. 111: 297-413.
Mahajan G, Chauhan B S and Johnson D E. 2009.
Weed management in northwestern IndoGangetic Plains. Journal of Crop
Improvement 23: 366–82.
Mahajan G, Sardana V, Brar AS and Gill MS.
2006. Effect of seed rates, irrigation
intervals and weed pressure on productivity
of direct-seeded rice (Oryza sativa). Indian
Journal of Agricultural Science 76
(12):756-759.
Mahajan, G. Sardana, V. Brar, A. S. and Gill, M.
S. 2004. Grain yield comparison among
rice (Oryza sativa L.) varieties under direct
seeding and transplanting. Haryana J.
Agron., 20 (1/2):68-70.
Mazher Farid Iqbal, Muzzammil Hussain and
Abdul Rasheed. (2017). Direct seeded rice:
purely a site specific technology. Int. J.
Adv. Res. Biol. Sci. 4(1): 53-57. DOI:
/>1.006
Mehala Vinay, et al., (2016) Impact of Direct
Seeded Rice on Economics of Paddy Crop
in Haryana. International Journal of
Agriculture Sciences, ISSN: 0975-3710 &
E-ISSN: 0975-9107, Volume 8, Issue 62,
pp.-3525-3528.
Miller B.C., Hill J.E. and Roberts S.R., Plant
population effects on growth and yield in
water seeded rice, Agron. J., 83, 291-297
(1991)
Naresh R.K., Gupta Raj K., Singh B., Kumar
Ashok;
Shahi
U.P.,
Pal
Gajendra;Singh,Adesh;
Yadav
Ashok
Kumar;and Tomar S.S.2010. Assessment of
No-Tillage
and
Direct
Seeding
Technologies in rice-wheat rotation for
Saving of Water and Labor in Western IGP.
Progr. Agri. Int. J. 10 (2): 205- 218.
Payman G and Singh S. 2008. Effect of seed rate,
spacing and herbicide use on weed
management in direct seeded upland rice
(Oryza sativa L.) Indian Journal of Weed
Science 40 (1&2): 11-15
Phuong LT, Denich M, Vlek PLG and
Balasubramanian V. 2005. Suppressing
weeds in direct-seeded lowland rice: Effects
of methods and rates of seeding. Journal of
Agronomy and Crop Sciences 191:185-194.
Pingali, P.L. and Rosegrant, M.W. 1994.
Confronting
the
environmental
consequences of the green revolution. In:
Proceedings of the 18th Session of the
international Rice Commission, Rome.
FAO, Rome, Italy, pp. 59-69
Piper C. S., 1966. Soil and plant analysis. Hans
publishers, Bombay. 368.
Prasad, M.K., S.B. Singh, J.M Singh and RP.
Sinha. 1999. Effect of seeding method, seed
rate and nitrogen splitting on yield
attributes of direct seeded rice. Ind. J. App.
Bio. 9(1): 55-57.
Rajiv, S. K. 2013. Response of basmati (Oryza
sativa L.) rice varieties to system of rice
intensification (SRI) and conventional
methods of rice cultivation. Ann. Agric.
Res., 34 (1): 50-56.
Rao, A.N., Johnson, D.E., Shivaprasad, B., Ladha,
J.K. and Mortimer, A.M. 2007. Weed
management in direct-seeded rice. Adv.
Agro. 93: 153-255.
41
Int.J.Curr.Microbiol.App.Sci (2018) 7(3): 32-42
Sanjitha Rani T. and Jayakiran K.2010.Evaluation
of different planting techniques for
economic feasibility in Rice. Elec. J. Envir.
Agri. Food Chem. 9 (1):150-153.
Seharawat, Y.S., Bhagat Singh, Malik, R.K.,
Ladha, J. K., Gathala, M., Jat, M.L. and
Kumar, V. 2010. Evaluation of alternative
tillage and crop establishment methods in a
rice–wheat rotation in North Western IGP.
Field Crops Res., 116: 260- 267.
Sharma. A. R. 1992. Effect of varying seed rates
and transplanting colonel tillers on the
performance of rice under intermediate
deep water conditions (0- 80 cm). Journal
of Agricultural Science. 119(2): 171- 177
Sidhu, A. S., Kooner, R. and Verma, A. 2014. Onfarm assessment of direct-seeded rice
production system under central Punjab
conditions. Journal of Crop and Weed,
10(1): 56-60
Singh S, Ladha J K, Gupta R K, Bhushan L and
Rao A N. 2008. Weed management in
aerobic rice systems under varying
establishment methods. Crop Protection,
27: 660–9.
Singh Samar, Sharma R K, Govindra Singh, Singh
S S, Singh U P, Gill M A, Jat M L, Sharma
S K, Malik R K, Josan A S and Gupta R K.
2005. Direct Seeded Rice: A Promising
Resource Conserving Technology. RiceWheat Consortium for the Indo- Gangetic
Plains, New Delhi.
Singh Y, Singh G, Johnson D, Mortimer M. 2005.
Changing from transplanted rice to direct
seeding in the rice-wheat cropping system
in India. In: Rice is Life: Scientific
Perspectives for the 21st Century, Tsukuba,
Japan: Proceeding of the Word Rice
Research Conference, 4-7 November 2004;
pp. 198- 201.
Singh, S.P. Sreedevi, B. Kumar, R.M. and
Subbaiah, S.V. 2008. Grain yield and
economics of wet direct sown rice under
different establishment methods and
nitrogen schedules. Oryza 45 (3):245-246.
Singh, Y. P. Singh, G. Singh, S. P. Kumar, A.
Sharma, G., Singh, M.K. Mortin, M. and
Johnson, D. E. 2006. Effect of weed
management and crop establishment
methods on weed dynamics and grain yield
of rice. Indian J. Weed Sci., 38 (1 and 2):
20-24.
Sivaesarajah K., Sangakkara U.R. and Sandanam
S., Effect of plant density, nitrogen and
gypsum on yield parameters of groundnut
(Arachis hypogea L.) in regosols of
Batticloa district, Trop. Agric. Res., 7, 112123 (1995)
Subbaiah S. V., Balasubramanian V. and
Krishnaiah K. 2002. Evaluation of drum
seeder in puddle rice fields. AMA,
Agricultural Mechanization in Asia, Africa
and Latin America. 33(4): 23-26.
Subbiah, B.V. and Asija, G.L. 1956. A rapid
procedure for the estimation of available
nitrogen in soil.Curr. Sci. 25: 259.
Walia US, Bhullar MS, Nayyar S and Sidhu AS.
2009. Role of seed rate and herbicides on
growth and yield of direct-dry seeded rice.
Indian Journal of Weed Science 41 (1 & 2):
33- 36.
Younas, M., Rehman, M. A., Hussain, A., Ali, L.,
and Waqar, M. Q. 2016. Economic
Comparison of Direct Seeded and
Transplanted Rice: Evidences From
Adaptive Research Area of Punjab
Pakistan.Asian J Agri Biol, 2016, 4(1): 1-7.
Yoyock J.Y., Effects of variety and spacing on
growth, development and dry matter
distribution in groundnut at 2 locations in
Nigeria, Exp. Agric., 15, 339-351 (1979)
Zhao DL, Bastiaans L, Atlin GN and Spiertz JHL.
2007. Interaction of genotypes by
management on vegetative growth and
weed suppression of aerobic rice. Field
Crops Research 100(1): 327-340.
How to cite this article:
Usha R. Dongarwar, Nitin Patke, L.N. Dongarwar and Sumedh R. Kashiwar. 2018. Impact of
Different Seed Rates on Yield and Economics of Direct Seeded Rice in Eastern Vidharbha
Zone of Maharashtra, India. Int.J.Curr.Microbiol.App.Sci. 7(03): 32-42.
doi: />42