Regulation of phytosiderophore (PS) and yellow stripe-1 (YS1) transporter activity by sulphur (S) and that of high-affinity sulphate (SULTR1; 1) transporter by iron (Fe) in wheat
Bạn đang xem bản rút gọn của tài liệu. Xem và tải ngay bản đầy đủ của tài liệu tại đây (773.21 KB, 18 trang )
Int.J.Curr.Microbiol.App.Sci (2018) 7(1): 71-88
International Journal of Current Microbiology and Applied Sciences
ISSN: 2319-7706 Volume 7 Number 01 (2018)
Journal homepage:
Original Research Article
/>
Regulation of Phytosiderophore (PS) and Yellow Stripe-1 (YS1)
Transporter Activity by Sulphur (S) and that of High-Affinity Sulphate
(SULTR1; 1) Transporter by Iron (Fe) in Wheat
Vasundhara Sharma1, Ranjeet Ranjan Kumar2,
Raghunath Pandey3 and Bhupinder Singh4*
1
Division of Plant Physiology, Indian Agricultural Research Institute, New Delhi, India
2
Division of Biochemistry, Indian Agricultural Research Institute, New Delhi, India
3
Division of Soil Science and Agricultural Chemistry, Indian Agricultural Research Institute,
New Delhi, India
4
Nuclear Research Laboratory, CESCRA, Indian Agricultural Research Institute,
New Delhi, India
*Corresponding author
ABSTRACT
Keywords
Iron deficiency,
Sulphur,
Phytosiderophore,
Uptake transporter,
SULTR1; 1, YS1
Article Info
Accepted:
09 December 2017
Available Online:
10 January 2018
Deficiency of micronutrients in soil particularly, that of Fe is a major nutritional and
production constraint worldwide. We hypothesize a role of sulphur nutrition in altering the
Fe deficiency tolerance response of crop plants. Present investigation was conducted to
elucidate the role of S in regulating uptake and in-plant partitioning of Fe in bread and
durum wheat through a field and a nutrient solution culture experiment. S application to
wheat, on low Fe field soil (<4ppm), increased the shoot Fe concentration and grain yield
significantly. Results from the hydroponic studies, which supported the field level
observations, showed that an increase in Fe uptake by Fe deficient plants under S
sufficiency is mediated via a higher release of PS and that S deficiency inhibits the root
synthesis and release of PS. Transcript expression analysis revealed an up regulation of
YS1 transporter and a down regulation of SULTR1; 1 transporter at increasing S nutrition.
Interestingly, SULTR1; 1 expression was up regulated only in the presence of Fe. The
study concludes that S nutrition is critical for Fe deficiency tolerance response of crops
and indicates a reverse regulation of S nutrition by Fe under low S.
burgeoning population further compounds the
challenge. Increasing the micronutrient
concentration of grain cereals such as wheat
therefore assumes significance and is currently
a high-priority research area (Cakmak, 2008;
White and Broadley, 2009; Govindaraj, 2015).
Among micronutrients, Fe deficiency is most
common in calcareous or alkaline soils and
Introduction
Wheat, a staple food crop of millions of
Indians and of those in other developing
countries, is facing huge challenge of poor
input use efficiency, grain productivity and
quality particularly in the Indo-gangetic wheat
belt. Increasing malnutrition among the
71
Int.J.Curr.Microbiol.App.Sci (2018) 7(1): 71-88
prevalent in human population affecting the
health of over three billion people worldwide
(Lindsay and Schwab, 1982; Aciksoz et al.,
2011). Although, Fe is present in sufficient
quantities in most soils but its deficiency
occurs mainly in terms of its availability for
plant uptake. It is, thus, important to elucidate
mechanisms that increase Fe availability for
plant uptake from the immobilized/locked Fe
fractions of the soil. For making this
immobilized Fe to
mobilized form
dicotyledonous species possess Strategy I
(Reduction
strategy)
which
involves
acidification of the soil by specific H¬+ATPases, resulting in an increase of Fe
solubility and reduction of the Fe+3 by
specific root reductases (Briat and Lobreaux,
1997; Hell and Stephan, 2003), whereas in
monocotyledonous species, Strategy II
(Chelation Strategy) is present which involves
the biosynthesis and secretion of mugineic
acid family of PS (Takahshi et al., 2011;
Kobayashi and Nishizawa, 2012). The
precursor of PS is sulphur containing amino
acid methionine so Fe uptake can be increased
by increasing S supplies (Astolfi et al., 2012).
assimilation pathway has been recently
investigated in durum wheat (Ciaffi et al.,
2013). These metallophores although can bind
with metals other than Fe and Zn, highest
affinity is reported for Fe (III) leading to
predominance of Fe-PS complex which is
taken up by the roots through YS1/YSL
family transporters (Curie et al., 2001). YS1
transporters are high affinity transporters
which are up-regulated under Fe deficiency
condition (Murata et al., 2006). S is taken up
by plants as sulphate through the activity of
different high affinity sulphate transporters
under conditions of low S availability.
SULTR1; 1 is an important root specific high
affinity sulphate transporter with a Km of 3.6
±0.6µM in cereal crops (Takahashi et al.,
2000). Effect of S nutrition on PS synthesis
and uptake of Fe-PS complex has not yet been
conclusively elucidated in wheat. The present
study, thus, hypothesizes that S metabolism in
plants impinge upon and is important
determinant of the Fe metabolism and that
optimum S nutrition of crops may increase PS
mediate Fe availability for plant uptake and Fe
deficiency tolerance of wheat. The aim of
present study was to measure the effect of S
application on Fe, S content and yield
attributes, changes in PS production and
release as affected by S availability and the
transcript expression of sulphate transporter
SULTR1;1 and Fe-PS transporter YS1 in
bread and durum wheat under Fe sufficient
and deficient condition.
Importance of PS in improving the
mobilisation of Fe and zinc (Zn) has been well
documented (Cakmak et al., 1998). PS release
follows a diurnal pattern with maximum
release during early morning (Takagi et al.,
1984). Inter and intra species variation for the
release of PS and their role in Fe nutrition
under Fe deficiency has been documented in
wheat (Khobra et al., 2014). It has been
demonstrated that S re-supply to deficient
plants allowed the restoration of their capacity
to cope with Fe shortage (Astolfi et al., 2010).
In addition, it is shown that the S supply in
form of sulphate can increase synthesis
(Kuwajima and Kawai, 1997) and release of
PS in Fe-deficient barley roots to improve the
capacity of these plants to cope with Fedeficiency (Römheld and Marschner, 1990).
The impact of Fe deprivation on the S
Materials and Methods
Field experiment
Field study was conducted in the year 2014-15
at Indian Agricultural Research Institute
(IARI) using bread and durum wheat, cv. HD2967 and HI-8713 respectively, procured from
the Division of Genetics and Plant Breeding,
IARI, New Delhi. Soil at the experimental site
was alkaline with a pH of 8.0-8.5 and <4ppm
72
Int.J.Curr.Microbiol.App.Sci (2018) 7(1): 71-88
Fe and 11 ppm S. A basal dose of phosphorus
(@60 kg P2O5 ha-1) and potassium (@60 kg
K2O ha-1) was applied at sowing. Urea was
applied as a source of nitrogen (@120 kg N
ha-1) in two equal splits while different S
levels viz., 0, 30 and 60 kg S ha-1 soil (referred
respectively as S0, S30 and S60) were
maintained using gypsum (CaSO4.2H2O).
nutrient solution (NS) culture. The roots were
washed off the sand particles with deionized
water prior to transfer (Zhang et al., 1991) to
the S and Fe deficient and sufficient solutions
i.e., 0, 1.2 and 2.5 mM SO4 (Zuchi et al.,
2012) as K2SO4 and 1 and 100 µM Fe as FeIIIEDTA (Khobra et al., 2014), in glass tanks
(10 liter capacity) with darkened sides to
prevent algal growth (Fig. 1) and under
continuous aeration. Plants were grown in a
climate chamber under 300 µmol m−2 s−1 PAR
at leaf level and 14 h/10 h day/night regime
(temperature 27ºC diurnal; 20ºC nocturnal;
relative humidity 80%). The S-deficient NS
was prepared by replacing sulphate salts (K+,
Mn2+, Zn2+, Cu2+) with appropriate amounts of
chloride salts (K+, Mn2+, Zn2+, Cu2+).
Concentrations of other nutrients in the
solution culture were as follows: Ca(NO3)2;
2.00 mM, KH2PO4; 0.25 mM MgCl2;1.00
mM, KCl; 0.10 mM, H3BO3; 1.00 mM,
MnSO4; 0.50 mM, CuCl2; 0.20 mM,
(NH4)2Mo7O24; 0.02 mM and ZnCl2; 0.001
mM. All the chemicals used for preparation of
nutrient solution were of AR grade. The
nutrient solution was changed every three days
to maintain the pH of 5.6 to 5.8 throughout the
experimental duration. Total biomass was
determined at 21 days of plant growth after
transfer to the nutrient solution. For this shoot
and root were collected and dried in hot air
oven at 70°C for 4 hours and then at 60ºC till
constant weight were reached and their dry
weight were recorded. Root release of PS,
diurnal pattern of PS release and PS content of
roots were determined at different days of
plant growth in Fe and S deficient and
sufficient treatments and their combinations,
in bread and durum wheat cultivars.
The experiment was laid out in Randomized
Complete Block Design and subplots size was
5m x 3m. Observations recorded were yield
attributes and Fe and S content of shoot. Shoot
Fe and S content of bread and durum wheat
were measured at 40, 70 and 120 DAS while
grain yield was recorded at harvest.
Iron and sulphur content
A known amount of dried tissues were
subjected to diacid digestion using HNO3 and
HClO4 (9:4) following established protocol.
The Fe concentration in acid digests of plant
samples were measured by Atomic Absorption
Spectroscopy (AAS) at 248.3 nm whereas
tissue S content was determined following
turbidimetric method (Tabatabai and Bremner,
1970). Fe and S content were calculated and
expressed as µg Fe plant-1 and µg S plant-1,
respectively.
Hydroponics experiment
Nutrient solution culture
Seeds of bread and durum wheat cultivars
were surface sterilized by rinsing for 3 min in
70% ethanol followed by 10 min in 15%
hydrogen peroxide solution and finally in
distilled water and were sown on autoclaved
sand in plastic trays. Trays were kept in a seed
germinator in dark at 25°C and were watered
as and when necessary. After three days of
germination, the trays with emerging seedlings
were moved to light to prevent etiolation. Five
days old healthy seedlings were gently
removed from sand and transferred to the
Phytosiderophore content in root tips
PS content was determined in root tips of
bread and durum seedlings at 11DAT. Wheat
seedlings were removed from the respective
NS treatments at 2 hours after the onset of
light and their root tips (about 3 mm) were
73
Int.J.Curr.Microbiol.App.Sci (2018) 7(1): 71-88
collected and homogenized to a fine powder
with liquid nitrogen. Distilled water at 100ºC
was added to aliquots of the powdered tissue
(500 µl mg−1 FW) and homogenates were
incubated for 10 min at 80ºC.Insoluble
material was removed by 10 min
centrifugation in a centrifuge at 12,000 rpm
and the pellet was then re-extracted with 500
µl of boiling water as described above. After a
further centrifugation step, the supernatant
was used for determination of PS content in
root tips using the Fe-mobilization assay
(Reichman and Parker, 2007) - modified from
Takagi (1976) and Gries and Runge (1995).
stored at -20ºC until the estimation of PS.
Measurement of PS was done following the Fe
mobilization method (Reichman and Parker,
2007) - modified from Takagi (1976) and
Gries and Runge (1995).
Collection
of
root
exudates
and
determination of phytosiderophore release
Total RNA isolation, complementary DNA
(cDNA) synthesis and real time polymerase
chain reaction (RT-PCR)
Transcript expression of S and Fe uptake
transporters
Transcript expression profile of SULTR1; 1
and YS1gene was studied in the root tissues of
11 day old bread and durum wheat seedlings
under Fe and S sufficient and deficient
treatment combinations as detailed earlier.
PS release from wheat plants was analyzed at
8,11and 14DAT by determining PS content in
root washings. A subset of 10 plants was
removed from the nutrient solution at 2 h after
the onset of the light period and the roots were
washed two times for 1 min in deionised
water. Root systems were submerged into 20
ml deionised water for 4 h with continuous
aeration. Thereafter, micropur (10 mg l−1)
(Roth, Karlsruhe, Germany) was added to
prevent microbial degradation of PS. PS
content in root washings were determined
using the Fe-mobilization assay (Reichman
and Parker, 2007) - modified from Takagi
(1976) and Gries and Runge (1995). Mean
average PS release over 8, 11 and 14DAT was
calculated to ascertain the treatment effect.
Diurnal
release
rhythm
of
100 mg of root tissue was ground in liquid
nitrogen.1 ml of trizol was added to it and kept
for 5 minutes at room temperature in mortar
itself. The contents were then transferred to a
1.5 ml Eppendorf and 200µl chloroform was
added with thorough mixing. It was followed
by 15 minutes incubation at room temperature
and centrifuged at 13,000 rpm for 15 minutes
at 4°C. Aqueous phase was transferred to fresh
tubes and 0.5 ml of isopropanol was added,
stored at room temperature for 15 min and
again centrifuged at 13,000 rpm for 15
minutes at 4°C. Supernatant was discarded
and the pellet was washed in 500µl of 70%
chilled ethanol and centrifuged at 13,000 rpm
for 15 min at 4°C. Supernatant was again
discarded and the pellet was allowed to dry for
10-15 minutes in incubator at 37°C and eluted
in 50 µl DEPC treated H2O and incubated at
60°C for 10 minutes, and RNA was stored at 80°C. cDNA synthesis was carried out by
using Revert Aid H Minus First Strand cDNA
synthesis kit (Thermo scientific, USA) as per
the instructions of manufacturer’s protocol.
Quantitative RT-PCR analysis was carried out
by using KAPA SYBR Green qPCR mix on a
Bio-Rad CFX96 machine using gene specific
phytosiderophore
Diurnal rhythm of PS release from the roots
was studied at 11DAT by collecting the PS,
following the method described earlier in this
section, over the 24 hour cycle at a regular
interval of 3 hours i.e. 6AM -9AM, 9AM12PM, 12PM-3PM, 3PM-6PM, 6PM-9PM,
9PM-12AM, 12AM-6AM. The samples were
74
Int.J.Curr.Microbiol.App.Sci (2018) 7(1): 71-88
primers for high affinity sulphate (SULTR1.1,
Accession no JX896648) and Fe-PS complex
transporter (HvYS1, Accession no AB214183;
and actin as
follows: SULTR1;1-FB (5’AGCCTCTGCAT
ACCTCAGGA3’)
and
SULTR1;1-RB
(5’ACTGGACCGATGGCTATGTC3’)
for
SULTR1;1; HvYS1-FB (5’GCCTTGTT TAG
CGTTCTTGC3’) HvYS1-RB (5’GTAAG
CCCTGTCCCGTATGA3’) for YS1 and
ACT-F (5’AGCGAGT CTTCATAG GGCG
ATTGT3’) and ACT-R (5’TAGCTCTG
GGTTCGAGTGGCATTT3’) for actin gene.
Shoot S and Fe content
The shoot Fe content on per plant basis
showed a significant increase from 40 to 120
DAS for both bread and durum wheat
cultivars. Plant Fe also increased significantly
with an increase in S application for both
cultivars. However, the S response on Fe
accumulation was higher for bread than durum
wheat. Even without S application (S0) the
bread wheat accumulated significantly higher
root and shoot Fe than durum wheat (Table 2).
Whereas, shoot S content on per plant basis
measured a significant four to ten folds
increase from 40 to 120 DAS for both the
experimental wheat cultivars. Here too, S
content of shoot in bread wheat did not vary
significantly with S availability in the soil
unlike durum wheat which showed a S dose
dependent increase in shoot. This probably
hints at a great S uptake by durum than bread
wheat (Table 2).
Reactions were run in Bio-radqRT-PCR CFX
96 machine using the standard cycling
program. Relative quantification and qRTPCR efficiency for the target genes were
calculated according to Pfaffl (2001).
Statistical analysis
All analyses were conducted in three (n = 3)
replications and data are expressed as mean ±
standard deviation (SD) using SPSS 16.0.
Significant differences were established by
posthoc comparisons (Duncan analysis) at P <
0.05.
Hydroponics experiment
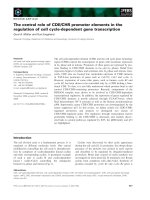
Biomass
Shoot mass, was greatly reduced in the
absence of both S and Fe (-S-Fe) when
compared with S and Fe sufficient (+S2+Fe)
control, the reduction being 22.3 and 30.8%
respectively for bread and durum wheat.
Availability of S, irrespective of the level,
improved shoot mass of both bread and durum
wheat by 10.8 to 19.3% and 15.6 to 22.7 %
(+S1-Fe to +S2-Fe) respectively, when
compared with the combined S and Fe
deficient control.
Results and Discussion
Field experiment
Yield attributes
S application caused a significant increase in
the number of spikes per unit area in bread
wheat over durum wheat. A significant
increase in grain and biological yield, across
wheat varieties was also measured at S30 over
S0 (Table 1). However, the variation in grain
and biological yield between S30 and S60 was
insignificant. Bread wheat, in general, gave
more grain and biological yield than the
durum wheat. A similar pattern of variation
and cultivar and S effect was observed for
harvest index and straw yield.
On the other hand, S deprivation with the
addition of Fe (-S+Fe) showed only 8.2 and
15.6% increase in biomass over nutrient
deficient control for bread and durum wheat,
respectively. However, when compared with
nutrient sufficient control, the reduction in
shoot mass under –S+ Fe condition was 16
75
Int.J.Curr.Microbiol.App.Sci (2018) 7(1): 71-88
and 19.8 % respectively, for the bread and the
durum cultivars.
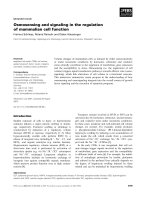
over 8, 11 and 14 DAT (Supplementary table
S1) under variable availabilities of Fe and S is
shown in Figure 2. Bread wheat (Fig. 2c), in
general, released a higher amount of PS
(~three times) than durum wheat (Fig. 2d)
across the S and Fe nutrient treatments.
Induction of PS occurred mainly under Fe
deficiency with highest measured release of
PS observed in +S2-Fe treatment for both
bread and durum wheat (2.22 and 0.87 nmol
Fe equivalent/g root fw, respectively).
However, PS release under dual nutrient
deficiency i.e. -S –Fe is significantly reduced
for both bread and durum wheat.
Higher (+S¬2) than lower S (+S1) availability
condition with or without Fe, ensured a better
shoot growth and thus, suggested that optimal
S availability is critical for making use of
available Fe in wheat (Fig. 1a, c).
Changes in root biomass across various S and
Fe availability condition reveal a higher
proliferation of roots in bread wheat than
durum wheat under conditions of S and Fe
deficiency.
Durum plants produced 44.1% more roots
under nutrients sufficient conditions while a
reduction in roots mass (-16.6%) over
respective nutrient deficient controls was
measured for the bread wheat (Fig. 1b, d).
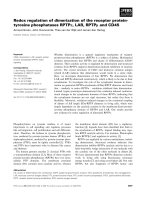
Diurnal pattern of PS release by roots
Root release of PS under different Fe and S
nutrient availability condition clearly indicates
that the day and night release pattern of PS is
independent of the nutrient availability across
the wheat cultivars and follows a similar
diurnal rhythm for PS release in both bread
and durum wheat with a maximum release
between 9 AM-12 PM (Fig. 3).
These results indicate greater Fe deficiency
sensitivity or Fe requirement of bread wheat
than durum wheat which causes a greater
proliferation of roots in the former cultivar.
The differences between treatments were
observed only with respect to the magnitude
of PS release. Highest release was measured at
2-3 h (8-9AM) after onset of light period and
continued till 3pm followed by a decline at the
later hours. Higher diurnal release of PS was
observed in bread wheat (Fig. 3a) as compared
to durum wheat (Fig. 3b).
Phytosiderophore content in root tips
Concentration of the total PS synthesized and
available for release (Table 2) under different
Fe and S availability conditions at11DAT in
bread (Fig. 2a) and durum (Fig. 2b) wheat
reveals a higher availability of PS in roots of
bread wheat under S+ Fe- condition which
matched the respective PS release profile.
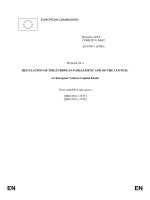
Relative expression of sulphate (SULTR1;
1) and iron (YS1) transporter
On the other hand, under similar S and Fe
availability condition durum wheat did not
release PS despite a substantially higher PS
level in the root tips.
Transcript expression pattern of sulphate
transporter (Fig. 4a) and Fe-PS complex
transporter (Fig. 4b) was investigated in root
tissues of bread and durum wheat under varied
S and Fe availability treatments.
Phytosiderophore release
Mean average root release of PS measured
76
Int.J.Curr.Microbiol.App.Sci (2018) 7(1): 71-88
Table.1 Effect of different level of applied sulphur (S0, S30, and S60 kg ha-1) on grain yield and
yield attributes of bread (cv. HD-2967) and durum (cv. HI-8713) wheat under field condition
Wheat Cultivars
(C)
HD-2967
Sulphur treatment
(kg ha-1)
S0
Grain yield
(t/ha)
4.0B±0.1
Straw yield (t/ha)
5.8A±0.0
Harvest Index
(%)
40.3C±0.7
Spikelet Number
(No. m-2)
301.7B±4.4
S30
4.7A±0.2
6.0A±0.4
44.1B±0.5
338.3A±4.4
5.2A±0.1
6.4A±0.1
45.1A±0.5
351.3A±1.9
4.6
6.1
43.2
330.5
Mean
b
a
c
c
S
3.0
±0.1
5.3
±0.3
36.1
±0.2
298.3
±4.4
HI-8713
0
a
a
b
b
S30
4.0 ±0.1
6.4 ±0.3
38.7 ±0.3
330.0 ±2.9
S60
4.2a±0.2
6.5a±0.4
39.6a±0.3
342.3a±1.5
3.7
6.1
38.1
323.6
Mean
C
0.3
NS
0.4
5.2
CD at 5%
S
0.3
0.6
0.5
6.3
CXS
NS
NS
0.6
NS
Values are mean ± standard deviation (n = 4).Significant differences between samples are indicated by different
letters: different capital letters indicate significant differences among different S levels in bread wheat (HD-2967) (P
< 0.05) (n = 4); different small letters indicate significant differences among different S levels in durum wheat (HI8713).
S60
Table.2 Effect of different level of applied sulphur (S0, S30, and S60 kg ha-1) on shoot iron (Fe)
and shoot sulphur (S) content of bread (cv. HD-2967) and durum (cv. HI-8715) wheat at
different days after sowing (DAS) under field condition
Wheat Cultivars
(C)
HD-2967
HI-8713
CD at 5%
HD-2967
HI-8713
Sulphur treatment
(kg ha-1)
Crop Growth Stage
40DAS
70DAS
120DAS
Shoot Fe content (µg Fe plant-1)
S0
402.4A±17.7
454.7B±23.8
2438.3B±111.4
A
B
S30
373.4 ±52.8
462.8 ±11.8
2793.2B±78.9
A
A
S60
454.8 ±9.0
711.4 ±36.1
3713.5A±50.8
410.2
542.9
2981.6
Mean
S0
230.0b±5.3
350.9b±26.4
1680.4c±88.5
b
a
S30
285.7 ±15.9
616.3 ±18.5
2336.0b±96.2
a
a
S60
340.4 ±13.6
748.7 ±14.3
2863.8a±94.3
282.0
572.0
2293.4
Mean
C: 63.5, S: 77.7, D: 77.7, C X S: 109.9, C X D: 109.9, S X D: 134.6, C X S X D: NS
Shoot S content (µg S plant-1)
S0
57.2A±4.5
310.8A±19.9
2745.2A±87.7
A
A
S30
53.7 ±11.2
248.9 ±9.2
2832.2A±200.7
A
A
S60
61.3 ±5.5
322.2 ±29.5
3057.5A±120.3
57.4
294.0
2878.3
Mean
S0
73.2b±1.1
465.0c±21.7
2613.5b±300.2
ab
b
S30
82.4 ±6.74
680.7 ±23.2
3227.4b±16.6
S60
93.3a±4.83
816.0a±45.2
5280.8a±120.8
82.9
653.9
3707.2
Mean
C: 132.9, S: 162.9, D: 62.9, C X S: 230.4, C X D: 230.4, S X D: 282.1, C X S X D: 399.0
CD at 5%
Values are mean ± standard deviation (n = 4).Significant differences between samples are indicated by different
letters: different capital letters indicate significant differences among different S levels in bread wheat (HD-2967) (P
< 0.05) (n = 4); different small letters indicate significant differences among different S levels in durum wheat (HI8713).
77
Int.J.Curr.Microbiol.App.Sci (2018) 7(1): 71-88
Fig.1 Shoot (A and C) and root (B and D) dry weight of bread (HD-2967) and durum (HI-8713)
wheat plants grown for 21 days in NS at 1 (-Fe) and 100 (+Fe) µM FeIII–EDTA and under three
S concentrations in the NS i.e. 0 (-S), 1.2 (+S1) and 2.5 (+S2) mM, deficient, adequate and high,
respectively. Data are means ± SD of three independent replications. Significant differences
between samples are indicated by different letters: different capital letters indicate significant
differences among different S levels in 1-Fe condition (P < 0.05) (n = 3); different small letters
indicate significant differences among different S levels in 100-Fe condition
78
Int.J.Curr.Microbiol.App.Sci (2018) 7(1): 71-88
Fig.2 PS content (A and B) and PS release (C and D) of bread (HD-2967) and durum (HI-8713)
wheat plants grown on NS at 1 (-Fe) and 100 (+Fe) µM FeIII–EDTA and under three S
concentrations in the NS i.e. 0 (-S), 1.2 (+S1) and 2.5 (+S2) mM, deficient, adequate and high,
respectively. PS content was measured at 11DAT and is presented as replicate mean ±SE while
PS release data are means of three independent replications ±SE at 8, 11 and 14 DAT (See
supplementary table S1 for individual stage PS release data). Statistics as in Figure 1
79
Int.J.Curr.Microbiol.App.Sci (2018) 7(1): 71-88
Fig.3 Diurnal release of phytosiderophores (PS) (nmol Fe equiv./g FW) in bread (HD-2967) and
durum (HI-8713) wheat plant raised in nutrient solution at 1 (-Fe) and 100 (+Fe) µM FeIII–
EDTA and under three S concentrations in the NS i.e. 0 (-S), 1.2 (+S1) and 2.5 (+S2) mM,
deficient, adequate and high respectively at 11 days after transfer (DAT). Data are means ± SD
of three independent replications. Statistics as in Figure 1
80
Int.J.Curr.Microbiol.App.Sci (2018) 7(1): 71-88
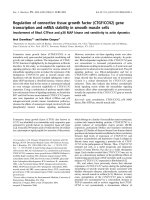
Fig.4 Relative transcript abundance of SULTR1;1 and YS 1 in roots of bread (HD-2967) and
durum (HI-8713) wheat grown under different iron and sulphur supply. Data are means ±SD of
three independent replications. Statistics as in Figure 1
81
Int.J.Curr.Microbiol.App.Sci (2018) 7(1): 71-88
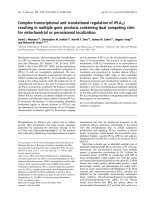
Plate.1 Growth response of bread (HD-2967) and durum (HI-8713) wheat to deficiency and/or
sufficiency of iron and sulphur in nutrient solution culture
Bread
-
Durum
Fe -S
Bread
+
Durum
Fe -S
Bread
-
Durum
Bread
Fe +S1
Bread
+
-
Fe +S2
Bread
Durum
+
Fe +S1
Durum
Durum
Fe +S2
Table S1: Phytosiderophore (PS) release in bread (HD-2967) and durum (HI-8713) wheat varieties raised in nutrient solution
at 1 µM (–Fe) and 100 µM (+Fe) FeIII-EDTA and under three S concentrations (0 (-S), 1.2 (+S1) and 2.5 (+S2) mM) at 8, 11 and
14 days after transfer (DAT)
Wheat
Cultivars (C)
Nutrient
Crop Growth Stage (D)
Mean
treatment
8DAT
11DAT
14DAT
(T)
Phytosiderophore release (nmol Fe equivalent g-1 root fw)
- 0.08
0.17
0.02
HD-2967
S Fe
0.09
+ 1.06
1.79
0.60
S1 Fe
1.15
+ 2.85
2.22
1.19
S2 Fe
2.09
– +
0.01
0.16
0.02
S Fe
0.06
+ +
0.01
0.11
0.11
S1 Fe
0.08
+ +
0.02
0.09
0.06
S2 Fe
0.06
Mean
0.67
0.76
0.33
- –
0.03
0.00
0.02
HI-8713
S Fe
0.02
+ –
0.38
0.65
0.17
S1 Fe
0.40
+ –
0.59
0.87
0.20
S2 Fe
0.52
– +
0.01
0.00
0.00
S Fe
0.00
+ +
0.01
0.03
0.03
S1 Fe
0.02
+ +
0.01
0.04
0.01
S2 Fe
0.02
Mean
0.17
0.27
0.07
CD at 5%
(C)
(S)
(D)
(C X S)
(C X D)
(S X D)
(C X S X D)
82
0.03
0.12
0.17
0.27
0.27
0.34
0.37
Int.J.Curr.Microbiol.App.Sci (2018) 7(1): 71-88
SULTR1; 1 gene was mainly expressed in
absence of S in both bread and durum wheat
cultivars and the gene expression was
enhanced in the presence of Fe (under –S+Fe)
across the wheat cultivars but about 10 times
in durum than bread wheat. Whereas, Fe
transporter gene (YS1), expressed more under
Fe deficiency condition and S sufficient
condition (+S -Fe) in bread wheat than durum
wheat. Some expression was also observed
under S and Fe sufficient condition in durum
wheat whereas, in absence of both S and Fe, a
negligible expression was measured.
causes damage to mitochondrial oxidative
phosphorylation system in Arabidopsis
thaliana
(Ostaszewska-Bugajska
and
Juszczuk, 2016). Thus increasing sulphur
supply increases the protein and enzyme level
of plant which in turn increases
photosynthesis, respiratory metabolism as
well as grain yield attributes. In previous
studies, Fe content of roots was found to
decrease with the increasing level of S
applications from 30 to 120 mg S kg-1 (Wu et
al., 2014) and that at excessive S supply Fe
accumulation in the shoot declines Hu et al.,
(2007) on the other hand demonstrated a
positive relation between Fe and S nutrition in
rice seedlings.
Sulphur, an essential mineral nutrient,
regulates plant metabolism, growth and grain
yield production as component of amino acids
such as cysteine and methionine besides
having role in regulating several other
important physiological functions (Muneer et
al., 2013). Involvement of sulphur nutrition in
nitrogen use efficiency in wheat (Salvagiotti
et al., 2009) and Fe uptake in barley (Astolfi
et al., 2012) has been reported. However, the
interactive effect of S nutrition on uptake and
use of other macro or micro nutrient may
depend on their respective availabilities in the
soil.
Significant reduction in shoot growth under
combined deficiency of Fe and S than the
nutrient sufficient treatment supports their
well-known essential role in plant metabolism
and growth. Root mass was invariably higher
under -Fe than +Fe conditions. Decrease in
the number of functional proteins has also
been reported under S and Fe deficiency
(Muneer et al., 2013) which may be attributed
to the depletion of biochemical attributes
controlling signal transduction and gene
function, due to excessive production of
deleterious ROS (Luo et al., 2002; Choudhary
et al., 2009). A better shoot mass with +S-Fe
deficiency over -S-Fe condition could be
related to a better ability of plants to cope up
Fe deficiency in the presence of S (Astolfi et
al., 2010).
A positive effect of sulphur fertilization on
growth attributes (Ciaffi et al., 2013), grain
yield (Zhao et al., 1999) and grain quality
(Pompa et al., 2009) have been evidenced in
different crops (Jarvan et al., 2008). Our
result confirmed this as the measure of yield
and its attributes indicated a positive impact
of sulphur application at S30 over S0
condition. Gilbert et al., (1997) reported a
significant effect of sulphur availability on
activities of the carboxylating enzymes and
synthesis of new proteins. Low soil sulphur
impairs the synthesis of Rubisco and cause
inhibition/reduced
activity
of
the
photosynthetic apparatus leading to a reduced
assimilation and storage of carbon
(Hawkesford 2000). Sulphur deficiency also
Optimum availability of S in plants would
ensure an enhanced assimilation of S and a
relatively higher synthesis and availability of
methionine for the production PS and
nicotianamine. Changes in PS synthesis and
release dynamics and the relative transcript
expression of S and Fe-PS complex
transporters (SULTR1; 1 and YSI) measured
under S and Fe deficient and sufficient
condition, on one hand confirm the reports in
83
Int.J.Curr.Microbiol.App.Sci (2018) 7(1): 71-88
literature that PS release is induced chiefly
under Fe deficiency (Kobayashi and
Nishizawa, 2012) but also indicate beyond
doubt, towards an absolute requirement of S
for the PS biosynthesis. Astolfi et al., (2012)
reported that Fe deficient plants grown in
presence of heavy metal cadmium partitioned
more S for the biosynthesis of PS than for
phytochelatin synthesis. Release of PS, in
fact, has been causally related to the plants
ability to tolerate Fe deficiency (Kobayashi et
al., 2005; Forieri et al., 2013). The variation
in PS release between S and Fe treatments
and when compared with those reported in
literature could be determined by cultivar
sensitivity difference towards Fe deficiency
and stringency of Fe deficiency condition
achieved under the experimental setup. A
lower release of PS by roots under -S -Fe in
the present study might be related to
limitation in PS synthesis or in its actual
release. To this effect, we measured the PS
level of root tips that are actually available for
the release. Results clearly showed that low
PS release under S deprivation is not limited
by release but by the availability of PS in the
roots for their release.
relative abundance of SULTR1; 1 and YS1
gene transcripts clearly suggests a dynamic
relationship and regulation of S and Fe on the
activity of these transporters. Durum was
more responsive to S in terms of induction of
high affinity transporter SULTR1; 1. Further
this sulphate transporter was induced under
low S availability condition only in the
presence of Fe while YS1 was induced under
Fe deficiency only when S was present. The
regulatory mechanism of SULTR1; 1 gene
expression was studied using inhibitors of
transcription,
translation
and
protein
phosphorylation/dephoshphorylation
by
Nakashita et al., (2004). SULTR1; 1
expression in cortex and epidermis of roots
was highly regulated by S deficiency in
Arabidopsis (Takahashi et al., 2000;
Yoshimoto et al., 2002). Buchner et al.,
(2010) and Ciaffi et al., (2013) investigated
the effect of Fe and S deprivation on
expression profile of certain important
transporters and enzymes involved in S
assimilation and reduction and concluded that
Fe-S interaction is a complex interplay of
transcriptional/translational
and
post
translational mechanisms that are induced
under S/Fe deficiency. Importance of
mugineic acid family of PS as Fe (III)
chelator to improve Fe uptake from
calcareous/alkaline soils is known (Kobayashi
et al., 2012). Further, Curie et al., (2009)
investigated and suggested the importance of
nicotianamine (NA) and yellow strip-1 like
(YSL1) transporters for higher metal uptake
in plants. ZmYS1 was shown to function as
proton coupled symporter for the uptake of PS
and NA-chelated metals (Schaaf et al., 2004)
and in barley (Murata et al., 2006).
Diurnal release pattern of PS was determined
Fe deficiency (Zang et al., 1991) and under
Fe and Zn deficiency (Singh et al., 2006) and
was found to be identical. Plant S nutrition is
likely to affect PS biosynthesis via
methionine substrate availability (Ma et al.,
1995) and also methionine mediated effect on
the diurnal rhythm of PS release under
regulated Fe and S availability condition was
found to be similar for both bread and durum
wheat. PS synthesis and release mechanism
was light regulated, as was also reported by
Zhang and coworkers (1991).
In conclusion, results clearly indicate a
complex
interplay
of
physiological,
transcriptional and translational factors
operative at the plant root level that not only
governs the interaction between Fe and S
metabolism but also determine the effect of S
The present study also elucidated the
variation in induction of sulphate and Fe
transporter SULTR1; 1 and YS1 under S and
Fe sufficient and deficient condition. Data on
84
Int.J.Curr.Microbiol.App.Sci (2018) 7(1): 71-88
nutrition on Fe deficiency tolerance.
Requirement of sufficient Fe for the induction
of high affinity S uptake transporter SULTR1;
1 is worth exploring further to gain insight
into regulation of S uptake by Fe.
Briat JF, Lobreaux S., 1997. Iron transport
and storage in plants. Trends Plant Sci
2: 187-193. doi: 10.1016/S13601385(97)01033-9
Buchner P, Parmar S, Kriegel A, Carpentier
M, Hawkesford MJ., 2010. The sulfate
transporter family in wheat: Tissuespecific gene expression in relation to
nutrition. Mol Plant 3: 374–389. doi:
10.1093/mp/ssp119
Cakmak I, Erenoglu B, Gut KY, Derici R,
Rolmheld V., 1998. Light-mediated
release of phytosiderophores in wheat
and barley under iron or zinc
deficiency. Plant Soil 202: 309–315.
doi: 10.1023/A:1004384712817
Cakmak I., 2008. Enrichment of cereal grains
with zinc: agronomic or genetic
biofortification? Plant Soil 302: 1–17.
doi: 10.1007/s11104-007-9466-3
Choudhary MK, Basu D, Datta A,
Chakraborty N, Chakroborty S., 2009.
Dehydration-responsive
nuclear
proteome of rice (Oryza sativa L.)
illustrates protein network, novel
regulators of cellular adaptation, and
evolutionary. Mol Cell Prot 8: 1579–
1598. doi: 10.1074/mcp.M800601MCP200
Ciaffi M, Paolacci AR, Celletti S, Catarcione
G, Kopriva S, Astolfi S., 2013.
Transcriptional
and
physiological
changes in the S assimilation pathway
due to single or combined S and Fe
deprivation in durum wheat (Triticum
durum L.) seedlings. J Exp Bot 64:
1663–1675. doi: 10.1093/jxb/ert027
Curie C, Cassin G, Couch D, Divol F,
Higuchi K, Le Jean M, Misson J,
Schikora A, Czernic P, Mari S., 2009.
Metal movement within the plant:
Contribution of nicotianamine and
yellow stripe 1-like transporters. Ann
Bot
103:
1–11.
doi:
10.1093/aob/mcn207
Curie C, Panavience Z, Loulergue C,
Acknowledgement
Financial support to first author from ICARIndian Agricultural Research Institute, New
Delhi is thankfully acknowledged.
Author Contribution
VS executed the experiments, collected and
analyzed the results, RRK and RP helped with
qRTPCR experiment and analysis and BS
conceptualized and facilitated the experiments
and wrote the paper.
Abbreviations
S: Sulphur, Fe: Iron, PS: Phytosiderophore,
SULTR1; 1: Sulphur Transporter 1; 1, YS1:
Yellow Stripe 1
References
Aciksoz SB, Yazici A, Ozturk L, Cakmak I.,
2011. Biofortification of wheat with
iron through soil and foliar application
of nitrogen and iron fertilizers. Plant
soil 349: 215-225. doi: 10.1007/s11104011-0863-2
Astolfi S, Zuchi S, Hubberten HM, Panton R,
Hoefgen R., 2010. Supply of sulphur to
S-deficient young barley seedlings
restores their capability to cope with
iron shortage. J Exp Bot 61: 799–806.
doi: 10.1093/jxb/erp346
Astolfi S, Zuchi S, Neumann G, Cesco S, Di
Toppi LS, Pinton R., 2012. Response of
barley plants to Fe deficiency and Cd
contamination as affected by S
starvation. J Exp Bot 63: 1241–1250.
doi: 10.1093/jxb/err344
85
Int.J.Curr.Microbiol.App.Sci (2018) 7(1): 71-88
Dellaporta SL, Briat JF, Walker EL.,
2001. Maize yellow stripe1 encodes a
membrane protein directly involved in
Fe(III) uptake. Nature 409: 346– 349.
doi: 10.1038/35053080
Droux M., 2004. Sulfur assimilation and role
of sulfur in plant metabolism: a survey.
Photosynth Res 79: 331–348. doi:
10.1023/B:PRES.0000017196.95499.11
Forieri I, Wirtz M, Hell R., 2013. Toward
new perspectives on the interaction of
iron and sulfur metabolism in plants.
Front
Plant
Sci
4:357.
doi:10.3389/fpls.2013.00357
Gilbert S, Clarkson DT, Cambridge M,
Lambers H, Hawkesford MJ., 1997.
Sulphate-deprivation has an early effect
on the content of ribulose 1,5bisphosphate
carboxylase/oxygenase
and photosynthesis in young leaves of
wheat. Plant Physiol 115: 1231–1239.
doi: 10.1104/pp.115.3.1231
Gries D, Runge M., 1995. Responses of
calcicole and calcifuge poaceae species
to iron-limiting conditions. Bot Acta
108: 482–489. doi: 10.1111/j.14388677.1995.tb00525.x
Hawkesford MJ., 2000. Plant responses to
sulphur deficiency and the genetic
manipulation of sulphate transporters to
improve S‐ utilization efficiency. J Exp
Bot 51:131-138.
Hell R, Stephan UW., 2003. Iron uptake,
trafficking and homeostasis in plants.
Planta
216:
541-551.
doi:
10.1007/s00425-002-0920-4
Hu ZY, Zhu YG, Li M, Zhang LG, Cao ZH,
Smith FA., 2007. Sulfur (S)-induced
enhancement of iron plaque formation
in the rhizosphere reduces arsenic
accumulation in rice (Oryza sativa L.)
seedlings. Environ Pollut 147: 387-393.
doi: 10.1016/j.envpol.2006.06.014
Järvan M, Edesi L, Adamson A, Lukme L,
Akk A., 2008. The effect of sulphur
fertilization on yield, quality of protein
and baking properties of winter wheat.
Agron Res 6: 459-469.
Khobra R, Ahuja S, Singh B., 2014.
Chlorophyll biosynthesis as the basis of
iron use efficiency under iron
deficiency and its relationship with the
phytosiderophore synthesis and release
in wheat. Indian J Plant Physi 19: 330337. doi: 10.1007/s40502-014-0112-9
Kobayashi T, Nishizawa NK., 2012. Iron
uptake, translocation, and regulation in
higher plants. Annu. Rev Plant Biol 63:
131-152. doi: 10.1146/annurev-arplant042811-105522
Kobayashi T, Suzuki M, Inoue H, Itai RN,
Takahashi M, Nakanishi H, Nishizawa
NK., 2005. Expression of ironacquisition-related genes in irondeficient rice is co-ordinately induced
by partially conserved iron-deficiencyresponsive elements. J Exp Bot 56:
1305–1316. doi: 10.1093/jxb/eri131
Kuwajima K, Kawai S., 1997. Relationship
between sulfur metabolism and
biosynthesis of phytosiderophores in
barley roots. In:Ando T, Fujita K, Mae
T, Matsumoto H, Mori S, Sekiya J, eds.
Plant Nutr—for Sustainable Food
Production and Environment. Dordrech,
The Netherlands: Kluwer Academic
Publishers, 285–286.
Lindsay WL, Schwab AP., 1982. The
chemistry of iron in soils and its
availability to plants. J Plant Nutr 5:
821–840.
doi:
10.1080/01904168209363012
Luo S, Ishida H, Makino A, Mae T., 2002.
Fe+2-catalyzed site specific cleavage of
the large subunit of ribulose 1,5bisphosphate carboxylase close to the
active site. J Biol Chem 277: 12382–
12387. doi: 10.1074/jbc.M111072200
Ma JF, Shinada T, Matsuda C, Nomoto K.,
1995.
Biosynthesis
of
phytosiderophores, mugineic acids,
associated with methionine cycling. J
86
Int.J.Curr.Microbiol.App.Sci (2018) 7(1): 71-88
Biol Chem 270: 16549-16554. doi:
10.1074/jbc.270.28.16549
Maruyama-Nakashita A, Nakamura Y,
Watanabe-Takahashi A, Yamaya T,
Takahashi H., 2004. Induction of
SULTR1; 1 sulfate transporter in
Arabidopsis roots involves protein
phosphorylation/
dephosphorylation
circuit for transcriptional regulation.
Plant Cell Physiol 45: 340-345. doi:
10.1093/pcp/pch029
Muneer S, Lee BR, Bae DW, Kim TH., 2013.
Changes in expression of proteins
involved in alleviation of Fe-deficiency
by sulfur nutrition in Brassica napus L.
Acta Physiol Plant 35: 3037-3045. doi:
10.1007/s11738-013-1336-4
Murata Y, Ma JF, Yamaji N, Ueno D,
Nomoto K, Iwashita T., 2006. A
specific transporter for iron(III)phytosiderophore in barley roots. Plant J
46: 563–572. doi: 10.1111/j.1365313X.2006.02714.x
Ostaszewska-Bugajska M, Juszczuk IM.,
2016. Changes in the OXPHOS system
in leaf and root mitochondria of
Arabidopsis thaliana subjected to longterm sulphur deficiency. Acta Physiol
Plant 38: 1-16. doi:10.1007/s11738016-2155-1.
Pfaffl MW., 2001. A new mathematical
model for relative quantification in realtime RT-PCR. Nucleic Acids Res
29:e45. doi:10.1093/nar/29.9.e45
Pompa M, Giuliani MM, Giuzio L, Gagliardi
A, Di Fonzo N, Flagella Z., 2009. Effect
of sulphur fertilization on grain quality
and protein composition of durum
wheat (Triticum durum Desf.). Ital J
Agron
4:159-70.
doi:
10.4081/ija.2009.4.159
Reichman SM, Parker DR., 2007 Critical
evaluation of three indirect assays for
quantifying phytosiderophores released
by the roots of Poaceae. Euro J Soil Sci
58:
844–853.
doi:10.1111/j.1365-
2389.2006.00874.x
Römheld V, Marschner H., 1990. Genotypical
differences
among
graminaceous
species in release of phytosiderophores
and uptake of iron phytosiderophores.
Plant Soil 123: 147-53.
Salvagiotti F, Castellarín JM, Miralles DJ,
Pedrol HM., 2009. Sulfur fertilization
improves nitrogen use efficiency in
wheat by increasing nitrogen uptake.
Field Crops Res 113: 170-177. doi:
10.1016/j.fcr.2009.05.003
Schaaf G, Ludewig U, Erenoglu BE, Mori S,
Kitahara T, Von Wirén N., 2004.
ZmYS1 functions as a proton-coupled
symporter for phytosiderophore and
nicotianamine-chelated metals. J Biol
Chem
279:
9091–9096.
doi:
10.1074/jbc.M311799200
Singh B, Kumar S, Singh BK., 2006.
Phytosiderophore production and its
release is related to Zn-efficiency of
wheat under Zn-deficiency, In. Wheat
for tropical areas, Eds Nayeem KA,
IARI Publication 247-252.
Tabatabai MA, Bremner JM., 1970. A simple
turbidimetric method of determining
total sulfur in plant material. Agron J
62: 805–806.
Takagi S., 1976. Naturally occurring ironchelating compounds in oat and riceroot washings. Soil Sci Plant Nutr 22:
423-433.
doi:
10.1080/00380768.1976.10433004
Takagi Si, Nomoto K, Takemoto T., 1984.
Physiological aspect of mugineic acid, a
possible
phytosiderophore
of
graminaceous plants. J Plant Nutr 7:
469–477. doi: 10.1080/0190416840936
3213
Takahashi H, Kopriva S, Gior-dano M, Saito
K, Hell R., 2011. Sulfur assimilation in
photosynthetic organisms: molecular
functions and regulations of transporters
and assimilatory enzymes. Annu Rev
Plant Biol 62: 157–184. doi:
87
Int.J.Curr.Microbiol.App.Sci (2018) 7(1): 71-88
10.1146/annurev-arplant-042110103921
Takahashi H, Watanabe-Takahashi A, Smith
FW, Blake-Kalff M, Hawkesford MJ,
Saito K., 2000. The roles of three
functional
sulphate
transporters
involved in uptake and translocation of
sulphate in Arabidopsis thaliana. Plant J
23: 171–182. doi: 10.1046/j.1365313x.2000.00768.x
White
PJ,
Broadley
MR.,
2009.
Biofortification of crops with seven
mineral elements often lacking in
human diets—iron, zinc, copper,
calcium, magnesium, selenium and
iodine. New Phytol 182: 49–84. doi:
10.1111/j.1469-8137.2008.02738.x
Wu CY, Lu J, Hu ZY., 2014. Influence of
sulfur supply on the iron accumulation
in rice plants. Commun Soil Sci Plant
Anal
45(8):1149-61.
doi:
10.1080/00103624.2013.875189
Yoshimoto N, Takahashi H, Smith FW,
Yamaya T, Saito K., 2002. Two distinct
high-affinity sulfate transporters with
different in- ducibilities mediate uptake
of sulfate in Arabidopsis root. Plant J
29: 465–473. doi: 10.1046/j.09607412.2001.01231.x
Zhang FS, Römheld V, Marschner H., 1991.
Role of the root apoplasm for iron
acquisition by wheat plants. Plant
Physiol 97: 1302–1305. doi: 10.1104
/pp. 97.4.1302
Zhao FJ, Hawkesford MJ, McGrath SP.,
1999. Sulphur assimilation and effects
on yield and quality of wheat. J Cereal
Sci 30: 1–17. doi:10.1006/jcrs.1998.
0241
Zuchi S, Cesco S, Astolfi S., 2012. High S
supply improves Fe accumulation in
durum wheat plants grown under Fe
limitation. Environ Exp Bot 77: 25-32.
doi:10.1016/j.envexpbot.2011.11.001
How to cite this article:
Vasundhara Sharma, Ranjeet Ranjan Kumar, Raghunath Pandey and Bhupinder Singh. 2018.
Regulation of phytosiderophore (PS) and Yellow Stripe-1 (YS1) transporter activity by sulphur
(S) and that of high-affinity sulphate (SULTR1; 1) transporter by iron (Fe) in wheat.
Int.J.Curr.Microbiol.App.Sci. 7(01): 71-88. doi: />
88