Effect of azotobacter vinelandii strain SRIAz3 and N-source on microbiological properties of rice grown soil
Bạn đang xem bản rút gọn của tài liệu. Xem và tải ngay bản đầy đủ của tài liệu tại đây (252.29 KB, 9 trang )
Int.J.Curr.Microbiol.App.Sci (2018) 7(3): 2170-2178
International Journal of Current Microbiology and Applied Sciences
ISSN: 2319-7706 Volume 7 Number 03 (2018)
Journal homepage:
Original Research Article
/>
Effect of Azotobacter vinelandii strain SRIAz3 and N-source on
Microbiological Properties of Rice Grown Soil
Soumya Ranjan Dehury1, Rajeswari Das1*, Pinki Seth2,
Madhusmita Pradhan1and Santanu Mohanty1
1
Department of Soil Science and Agricultural Chemistry, College of Agriculture OUAT,
Bhubaneswar, Odisha, India
2
Department of Soil Science and Agricultural Chemistry, College of Agriculture, University of
Agricultural Sciences, Bangalore - 560065 (Karnataka), India
*Corresponding author
ABSTRACT
Keywords
Azotobacter rice,
Biomass, Urease,
Dehydrogenase,
Phosphatise activity
Article Info
Accepted:
20 February 2018
Available Online:
10 March 2018
The present investigation was carried out to assess the efficiency as well as effect of bio
inoculation of free living N2 fixing bacterial strain (Azotobacter vinelandii strain SRIAz3)
with N sources on enhancement of microbial properties of soil. A. vinelandii strain SRIAz3
was isolated from SRI Field (Central Farm, OUAT, Bhubaneswar) with optimum
nitrogenase activity [121.09 N2-ase activity (nmole C2H4 mg-1 bacteria-1 h-1)]. Azotobacter
inoculated plots significantly influenced the microbial parameters. In Azotobacter
innoculated plot with 75% nitrogen source total heterotrophic bacteria, Azotobacter
population, soil microbial biomass carbon, dehydrogenase, urease and phosphatase activity
were enhanced by 40, 160, 80, 240, 80, 210 and 250 percent respectively over
uninoculated plots. Higher Azotobacter population resulted in increased soil enzymatic
(dehydrogenase, urease and phosphatase) activities and microbial biomass carbon. Use of
Azotobacter vinelandii strain SRIAz3 isolated from SRI Field as biofertilizer significantly
influenced soil microbial biomass and enzymatic activity, which could consequently
enhance the rice yield and nutrient (N, P and K) uptake.
Introduction
Rice is the staple food for 60 percent of
Indians and source of livelihood for 120-150
million rural households. India is the largest
producer of rice being cultivated in 43.95
Mha area with a production of 106.35 Mt and
productivity of 2.42t ha-1 (Agricultural
Statistics at a Glance, 2014). In Odisha, rice is
cultivated in 4.18 Mha area with production
of 7.61 Mt and productivity of 1.82 t ha-1
(Economic Survey Odisha, 2013-14). In
India, the production of rice has been set at
115 Bt by the year 2025. India ranked first in
area under Paddy and second in terms of
production next to China, but productivity is
less (2.42 t ha-1) as compared to other major
rice producing countries like Japan (6.52t
ha-1), China (6.24t ha-1), and Indonesia (4.25t
ha-1).
Nowadays, Rice production faces several
2170
Int.J.Curr.Microbiol.App.Sci (2018) 7(3): 2170-2178
challenges to produce the required quantity
per unit area because the growing population
has ceased the area of the cultivable land.
Green revolution of 1960s contributed a lot to
food grain production by use of high inputs
particularly chemical fertilizer. The increase
in population has led to intensification of
agricultural systems. To meet the food
requirement, attempts have been made to
increase the food production by utilization of
synthetic chemicals such as fertilizers and
pesticides. This led to many fold increase in
food grain production but it has also
causedsoil health degradation, environmental
pollution and moreover the unsustainable crop
production. It is well known that
microorganisms play an important role in
maintaining soil health in the farming
ecosystem. So the activities related to
production, preservation and utilization of
microorganisms on commercial scale in
agriculture sector are fast increasing in recent
times.
Biological nitrogen fixation (BNF) has
become important in rice farming systems
because, this process diminishes the need for
expensive chemical fertilizers which have
been associated with numerous health and
environmental problems. As crop growth and
development are closely related to the nature
of the soil microflora, especially those in
close proximity to plant roots, i.e. the
rhizosphere.
Therefore
control
of
microorganisms is essentially required to
overcome the limitations of conventional
agricultural technologies. The soil and
rhizosphere microflora can accelerate the
growth of plants and enhance their resistance
to disease and harmful insects by producing
bioactive substances. Biological nitrogen
fixation (BNF) has become important in rice
farming systems because this process
diminishes the need for expensive chemical
fertilizers which have been associated with
numerous health and environmental problems.
Among different microorganisms Azotobacter
plays an important role in Biological nitrogen
fixation. Azotobacter are aerobic, free-living
soil microbes which play an important role in
the nitrogen cycle in nature, binding
atmospheric nitrogen which is inaccessible to
plants and releasing it in the form of
ammonium ions into the soil (nitrogen
fixation). In addition to being a model
organism for studying diazotrophs, it is used
by humans for the production of biofertilizers,
food additives and some biopolymers.
Materials and Methods
The techniques of investigation followed and
the materials used for the experiments are
described in this section.
Field experimentation
The Field trial was conducted in the
Agronomy Research Plot, Orissa University
of Agriculture and Technology (OUAT),
Bhubaneswar, Odisha located at 20026’N
latitude and 85080’E longitude with an
altitude of 30 m above mean sea level, which
is 60 km away from Bay of Bengal. The
experimental
site
experienced
high
temperature in summer and mild temperature
during winter .The annual rainfall was about
1505mm, out of which more than 85 per cent
was received between months of July to
October. The field experiment was conducted
in Randomized complete block design
(RCBD) with eight treatment combinations
(Table 1) which were replicated thrice.
Medium duration rice cultivar Pyari was
raised in nursery bed with recommended
management practices. At the time of final
land preparation vermicompost was applied
@ 2 t ha-1to each plot. The test crop received
N-P2O5-K2O @ 80-40-40 kg ha-1 in the form
of urea, DAP and MOP respectively. Thirty
(30) days old seedlings were uprooted from
the nursery bed on the day of transplanting
and were dipped in Azotobacter broth
2171
Int.J.Curr.Microbiol.App.Sci (2018) 7(3): 2170-2178
(1010cfu ml-1) for 2 hrs and kept under shade.
The seedlings were then transplanted @ 1-2
seedlings/hill in the main field with the
recommended spacing of 20 cm X 10 cm. The
crop was harvested when more than 80%
grains turned yellow and were sundried in the
field for 3-4 days and threshed. The grains,
chaffs and straw yields were recorded after
proper sun drying to retain 14% moisture
content in grains.
Representative composite soil samples were
collected from all the treatments till harvest.
The samples were dried under shade, grinded
with wooden hammer and sieved through
2mm sieve. The samples were preserved in
polythene bags for analysis. Fresh rhizosphere
soils were used immediately for estimating
microbial parameters before transplanting, 45
DAT, 90 DAT and at harvest.
Method of analysis
Microbial and chemical analysis of Soil
samples
Soil samples were analyzed for different
parameters. Soil reaction was determined in 1:
2.5 soil : water ratio by pH meter as described
by Jackson (1973). Organic carbon content of
soil was determined by wet digestion
procedure of Walkley and Black as outlined
by Page et al., 1982. The soil microbial
population
(heterotrophic
bacteria,
Azotobacter) was determined by serial
dilution and spread plate technique. Microbial
biomass carbon (MBC) was measured as
described by Vance et al., (1987).
Soil enzyme activity
Soil Dehydrogenase assay was measured
following the method of reduction of 2, 3,5triphenyltetrazolium chloride (TTC) to the
creaming red-colored triphenyl formazan
(TPF). The red colour intensity was measured
at 485 nm by Spectrophotometer (Tabatabai,
1982).Soil Urease activity was measured as
described by Tabatabai and Bremner,
1972.Acid and alkaline phosphatase activity
was
measured
at
420nm
by
Spectrophotometer (Tabatabai and Bremner,
1969).
Results and Discussion
The experimental findings of the field
experiment
and
laboratory
analysis
undertaken during the period of investigation
are reported in this chapter.
Microbial and chemical analysis of Soil
samples
Initial chemical and microbial properties of
the experimental site
The initial chemical and biological properties
of the experimental site (Table 2) revealed
that the soil was strongly acidic (pH- 4.53 4.57) in reaction. Organic carbon content of
the soil was 0.62- 0.68 per cent. Further the
nutrient status of the soil revealed that
available N, P and K values ranged 143.0 179.6, 7.1 - 9.5 and 139.2 - 153.3 kgN, P2O5
and K2O ha-1 respectively.
Biological properties of the sampled soil
revealed that the total heterotrophic bacteria
and
Azotobacter
population
of the
experimental site were 51 - 60 X104 and 21 –
24 X 104 CFU g-1 soil respectively. Soil
MBC, soil enzymes viz., dehydrogenase,
urease , acid and alkaline phosphatase were
87.60 – 91.89 µg C g-1 soil, 0.05 – 0.09 µg
TPF g-1 soil, 35.60 – 37.96 µg NH4N g-1 soil
2, 0.01 - 0.10 and 0.02 – 0.09 µM PNP g-1 dw
soil respectively.
Soil of the experimental site showed strongly
acidic reaction (pH) and medium in organic
carbon contents. With regard to plant
available nutrients, the experimental site was
low in available and medium in available K.
2172
Int.J.Curr.Microbiol.App.Sci (2018) 7(3): 2170-2178
The soil was low in microbial biomass and
enzyme activities (dehydrogenase, urease,
acid phosphatase and alkaline phosphatase).
Effect of bioinoculation and N sources on
biological properties of soil
Soil samples collected from the experimental
plots at initial, 45 DAT, 90 DAT and at
harvest were analyzed to record microbial
population (total heterotrophic bacteria,
Azotobacter), MBC and soil enzymatic
activities (dehydrogenase, urease, acid
phosphatase and alkaline phosphatases).
nitrogen so any addition of nitrogen enhanced
immobilization rate which resulted in
enhanced total heteroprophic bacterial
population which were similar in magnitude.
However, in all the treated plots the bacteria
population found to decline towards harvest
due to mortality of bacteria because of
senescence. At harvest total heterotrophic
bacteria in the plots inoculated with A.
vinelandii strain SRIAz3 and receiving
nitrogen @ 75% and 100% were found at par
and significantly higher over rest of the
treatments signifying that the recommended
dosage of nitrogen can be reduced under
fertilizer scarce conditions.
Total heterotrophic bacteria
Azotobacter population
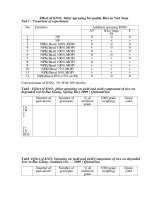
Soil samples collected at initial, 45 DAT, 90
DAT and at harvest were enumerated for
bacterial population (Table 3). The treatment
T8 (A. vinelandii strain SRIAz3 + 100%N)
recorded highest population of heterotrophic
bacteria at 45DAT (172.00X 10⁴ CFU g-1
soil) and at harvest (182.00 X 10⁴ CFU g-1
soil) but at 90 DAT, treatment T7 (A.
vinelandii strain SRIAz3 + 75% N) recorded
the highest population of heterotrophic
bacteria (194.00 X 10⁴ CFU g-1 soil). Least
population of heterotrophic bacteria was
recorded in the control plot throughout the
rice growth period (53 X 104to 129 X 104
CFU g-1 soil).
Initial population of total heterotrophic
bacteria in all the trial plots were
comparatively less than those obtained in
successive rice growth period. Further during
the active crop growth period i.e. at 45 DAT
and 90 DAT the heterotrophic bacteria
population in plots inoculated with the free
living N2 fixing bacterium (A. vinelandii
strain SRIAz3) failed to differ significantly
than the uninoculated plots except control.
Irrespective of nitrogen doses the inoculated
plots maintained total heterotrophic bacteria
population at par which may be attributed to
the fact that the soil was low in available
Soil samples collected at initial, 45 DAT, 90
DAT and at harvest were analyzed for
Azotobacter population (Table 4). The
treatment T7 (A. vinelandii strain SRIAz3 +
75% N) with initial population of 23.00 X 10⁴
CFU g-1 soil recorded the highest Azotobacter
population (111.67, 198.00and 178.33 X 10⁴
CFU g-1 soil) at 45DAT, 90 DAT and at
harvest, respectively.However, Azotobacter
population was least (53.00, 76.00 and 67.66
X 104 CFU g-1 soil) in the control plot
throughout the crop growth period.
Azotobacter population in all the plots at
initial stage was comparatively lower than the
successive growth stages. At 45 DAT, 90
DAT and at harvest plots inoculated with the
free living N2 fixing bacterium (A. vinelandii
strain SRIAz3) showed significantly higher
Azotobacter population over the uninoculated
plots and control. Uninoculated plots
receiving varying doses of nitrogen along
with control failed to influence the
Azotobacter population indicating poor
microbial activity due to low initial soil
microbial inoculum. Similar findings were
obtained by Babajide and Fagbola (2014).
Microbial Biomass Carbon (MBC)
2173
Int.J.Curr.Microbiol.App.Sci (2018) 7(3): 2170-2178
Soil microbial biomass, which can be
Soil samples collected periodically at initial,
reflected by MBC is an important index to
45 DAT, 90 DAT and at harvest were
assess ability of soil microorganism taking
analysed for MBC (Table 5). Highest MBC
part in the recycling of carbon and their
(198.23, 278.55 and 292.80 µg C g-1 soil) was
substances in soil (Zeng et al., 2005).
recorded in the treatment T7 (A. vinelandii
Recorded result revealed that initial soil MBC
strain SRIAz3 + 75% N) at 45 DAT, 90 DAT
increased with growth of rice till harvest. All
and at harvest respectively over the initial
throughout the rice growth period the plots
-1
value of 91.42 µg C g soil. MBC was lowest
receiving only mineral nitrogen maintained
with values of 137.80, 154.50 and 152.00µg
significantly poor population with marginal
-1
C g soil at all the sampled stages of the crop
differences among them. Kizilkaya (2009)
growth in the control plot.
reported an increase in soil MBC values with
increased Azotobacter population.
Table.1 Treatment details
T1
T2
T3
T4
T5
T6
T7
T8
Control
N1 (50% N)
N2 (75% N)
N3 (100% N)
A. vinelandii strain SRIAz3
A. vinelandii strain SRIAz3 + N1
A. vinelandii strain SRIAz3 + N2
A. vinelandii strain SRIAz3 + N3
Table.2 Initial chemical and microbial properties of soil
Soil chemical parameters
pH
Organic carbon [%]
Available N [kg ha-1]
Available P [kg ha-1]
Available K [kg ha-1]
Soil microbial parameters
Total heterotrophic Bacteria [CFU g-1 soil]
Azotobacter population [CFU g-1 soil]
Microbial biomass carbon [µg C g-1 soil]
Dehydrogenase Activity [µg TPF g-1 soil h-1]
Urease enzymes (µg NH4N g-1 dwt soil 2 h-1)
Acid Phosphatase enzymes (µM PNP g-1 dwt soil h-1)
Alkaline Phosphatase enzymes (µM PNP g-1 dwt soil h-1)
2174
4.53 – 4.57
0.62 - 0.68
143.0 - 179.6
7.14 - 9.59
139.2 - 153.3
51 - 60 X104
21 – 24 X 104
87.60 – 91.89
0.05 – 0.09
35.60 – 37.96
0.01 -0.10
0.02 – 0.09
Int.J.Curr.Microbiol.App.Sci (2018) 7(3): 2170-2178
Table.3 Effect of bioinoculation and N sources on total heterotrophic bacteria
(X 104 CFU g-1 soil)
Treatments
Control
N1 (50% N)
N2 (75% N)
N3 (100% N)
A. vinelandii strain SRIAz3
A. vinelandii strain SRIAz3 + N1
A. vinelandii strain SRIAz3 + N2
A. vinelandii strain SRIAz3 + N3
CV (%)
Initial
53.00a
51.00a
57.00a
54.00a
52.00a
54.00a
60.00a
58.00a
10.59
45 DAT
124.00b
147.00ab
144.00ab
156.00a
154.00a
169.00a
168.00a
172.00a
10.14
90 DAT
138.00b
165.00ab
167.00ab
170.00a
176.00a
182.00a
194.00a
192.00a
9.43
HARVEST
129.00c
153.00b
158.00b
154.00b
159.00b
165.00b
178.00a
182.00a
4.03
*Means averaged over three replicates represented by the same letter in columns are not significantly different
(p<0.05).
Table.4 Effect of bioinoculation and N sources on
population of Azotobacter(X 104 CFU g-1 soil)
Treatments
Control
N1 (50% N)
N2 (75% N)
N3 (100% N)
A. vinelandii strain SRIAz3
A. vinelandii strain SRIAz3 + N1
A. vinelandii strain SRIAz3 + N2
A. vinelandii strain SRIAz3 + N3
CV (%)
Initial
21.00a
22.00a
23.00a
22.00a
24.00a
22.00a
23.00a
22.00a
8.05
45 DAT
53.00b
60.67b
68.34b
67.00b
97.00a
104.00 a
111.67a
98.67a
10.89
90 DAT
76.00b
91.00b
101.34b
97.67b
173.00a
176.00a
198.00a
165.00a
15.82
HARVEST
67.66b
65.00b
73.00b
57.33b
154.33a
163.33a
178.33a
134.00a
26.39
*Means averaged over three replicates represented by the same letter in columns are not significantly different
(p<0.05).
Table.5 Effect of bioinoculation and N sources on Microbial Biomass Carbon
(µg C g-1 soil)
Treatments
Control
N1 (50% N)
N2 (75% N)
N3 (100% N)
A. vinelandii strain SRIAz3
A. vinelandii strain SRIAz3 + N1
A. vinelandii strain SRIAz3 + N2
A. vinelandii strain SRIAz3 + N3
CV (%)
Initial
87.60a
90.00a
90.00a
89.34a
89.84a
90.37a
91.42a
91.89a
2.71
45 DAT
137.80c
165.96b
170.54b
170.45b
185.77ab
197.60a
198.23a
190.50ab
7.93
90 DAT
154.50d
173.44cd
185.32cd
173.68cd
245.50ab
268.69ab
278.55a
221.36bc
12.94
HARVEST
152.00d
187.00cd
192.50c
183.23cd
254.94b
283.74ab
292.80a
274.94ab
9.00
*Means averaged over three replicates represented by the same letter in columns are not significantly different
(p<0.05).
2175
Int.J.Curr.Microbiol.App.Sci (2018) 7(3): 2170-2178
Table.6 Effect of bioinoculation and N sources on Dehydrogenase (µg TPF g-1 soil h-1)
Treatments
Control
N1 (50% N)
N2 (75% N)
N3 (100% N)
A. vinelandii strain SRIAz3
A. vinelandii strain SRIAz3 + N1
A. vinelandii strain SRIAz3 + N2
A. vinelandii strain SRIAz3 + N3
CV (%)
Initial
0.05a
0.05a
0.05a
0.07a
0.06a
0.07a
0.07a
0.05a
21.84
45 DAT
0.14d
0.23cd
0.29c
0.29c
0.38b
0.40b
0.62a
0.60a
13.82
90 DAT
0.25d
0.34cd
0.39c
0.42c
0.65b
0.70b
0.85a
0.68b
14.63
HARVEST
0.15e
0.21de
0.32cd
0.40c
0.58b
0.64b
0.80a
0.62b
17.58
*Means averaged over three replicates represented by the same letter in columns are not significantly different
(p<0.05).
Table.7 Effect of bioinoculation and N sources on Urease enzyme (µg NH4N g-1 dwt soil 2 h-1)
Treatments
Control
Initial
35.60a
45 DAT
42.30d
90 DAT
40.56e
HARVEST
38.90e
N1 (50% N)
N2 (75% N)
N3 (100% N)
A. vinelandii strain SRIAz3
A. vinelandii strain SRIAz3 + N1
A. vinelandii strain SRIAz3 + N2
A. vinelandii strain SRIAz3 + N3
CV (%)
35.99a
36.24a
36.95a
37.07a
37.24a
37.48a
37.96a
5.03
50.63d
62.39c
63.50c
67.50c
68.50c
89.56a
78.60b
8.88
48.72de
54.81cd
54.81cd
60.90bc
60.90bc
73.08a
66.99ab
8.42
43.63de
49.36cd
52.50bcd
59.60ab
53.50bc
66.35a
54.68bc
10.13
*Means averaged over three replicates represented by the same letter in columns are not significantly different
(p<0.05).
Table.8 Effect of bioinoculation and N sources on acid phosphatase enzymes
(µM PNP g-1 dwt soil h-1)
Treatments
Control
N1 (50% N)
N2 (75% N)
N3 (100% N)
A. vinelandii strain SRIAz3
A. vinelandii strain SRIAz3 + N1
A. vinelandii strain SRIAz3 + N2
A. vinelandii strain SRIAz3 + N3
CV (%)
Initial
0.06a
0.06a
0.06a
0.06a
0.06a
0.06a
0.06a
0.06a
13.60
45 DAT
0.08d
0.10d
0.10d
0.15c
0.20b
0.23b
0.30a
0.25b
16.34
90 DAT
0.10c
0.13bc
0.11c
0.19b
0.29a
0.30a
0.31a
0.30a
17.66
HARVEST
0.05c
0.05c
0.07bc
0.13b
0.22a
0.26a
0.27a
0.24a
22.66
*Means averaged over three replicates represented by the same letter in columns are not significantly different
(p<0.05).
2176
Int.J.Curr.Microbiol.App.Sci (2018) 7(3): 2170-2178
Table.9 Effect of bioinoculation and N sources on Alkaline phosphatase enzymes
(µM PNP g-1 dwt soil h-1)
Treatments
Control
N1 (50% N)
N2 (75% N)
N3 (100% N)
A. vinelandii strain SRIAz3
A. vinelandii strain SRIAz3 + N1
A. vinelandii strain SRIAz3 + N2
A. vinelandii strain SRIAz3 + N3
CV (%)
Initial
0.07a
0.06a
0.06a
0.07a
0.07a
0.08a
0.08a
0.07a
19.60
45 DAT
0.07e
0.08de
0.12cd
0.14bc
0.15bc
0.17b
0.25a
0.24a
16.55
90 DAT
0.08f
0.12e
0.14e
0.17d
0.19d
0.24c
0.28b
0.33a
8.90
HARVEST
0.05e
0.06de
0.09d
0.13c
0.16bc
0.19b
0.26a
0.23a
14.70
*Means averaged over three replicates represented by the same letter in columns are not significantly different
(p<0.05)
Soil enzyme activity
Soils sampled periodically at initial, 45 DAT,
90 DAT and at harvest were analysed for
Dehydrogenase
activity
(Table
6).
Dehydrogenase activity was highest in the
treatment T7 (A. vinelandii strain SRIAz3 + N2)
throughout the crop growth period i.e. 0.62,
0.85 and 0.80 µg TPF g-1 soil hr-1 at 45DAT, 90
DAT and at harvest, respectiviely. Least
dehydrogenase activity (0.14, 0.25 and 0.15 µg
TPF g-1 soil h-1) was recorded in the control (T1)
plot during the crop growth period. The initial
Dehydrogenase activity in all the plots ranged
between 0.05 -0.07 µg TPF g-1 soil h-1.
Soil samples collected at periodic interval (45
DAT and 90 DAT and at harvest) were
analyzed for Urease enzyme (Table 7).
Significantly higher urease activity (89.56,
73.08 and 66.35µg NH4N g-1 dwt soil 2 hr-1)
was recorded in treatment T7 (A. vinelandii
strain SRIAz3 + 75% N) at 45DAT, 90 DAT
and at harvest, respectively. Control plot
maintained lowest Urease activity of (42.30,
40.56 and 38.90 µg NH4N g-1 dw soil 2 hr-1)
during the crop growth period. The initial
urease activity in all the plots ranged between
35.60 – 37.96 µg NH4N g-1 dw soil 2 h-1.
Soils sampled periodically at initial, 45 DAT,
90 DAT and at harvest were analyzed for Acid
phosphatase activity (Table 8). Acid
phosphatase activity (0.30, 0.31 and 0.27 µM
PNP g-1 dwt soil h-1) was highest in the
treatment T7 (A. vinelandii strain SRIAz3 +
75% N) at 45DAT, 90 DAT and at harvest
respectively. Lowest acid phosphatase activity
(0.08, 0.10 and 0.05µM PNP g-1 dwt soil h-1)
was obtained in the control (T1) plot during the
crop growth period.
Alkaline phosphatase activity (0.25, 0.26 µM
PNP g-1 dwt soil h-1) was highest in the
treatment T7 (A. vinelandii strain SRIAz3 +
75% N) at 45 DAT and harvest respectively
where as at 90 DAT it was highest (0.33 µM
PNP g-1 dwt soil h-1) in T8 (A. vinelandii strain
SRIAz3 + 100% N). Lowest alkaline
phosphatase activity (0.07, 0.08 and 0.05µM
PNP g-1dwt soil h-1) was obtained in the control
plot during the crop growth period. The initial
alkaline phosphatase activity in all the plots
ranged between 0.06-0.08 µM PNP g-1 dwt soil
h-1 (Table 9).
Soil enzymes are soil active protein, and on the
other hand soil microbial exudation. At
45DAT,90DAT and at harvest significant
difference was observed between the
bioinoculated plots and uninoculated plots with
respect to dehydrogenase, urease, acid and
alkaline phosphatase. Furthermore, the above
enzymatic activities showed a declining trend
2177
Int.J.Curr.Microbiol.App.Sci (2018) 7(3): 2170-2178
towards harvest owing to less root activity.
When rice life activity was at strong stages, its
roots exudation and soil enzymatic activities
were increased up to certain extent. When rice
was at the maturity stage, its roots decrepitude
and its exudation reduced. As a result, soil
enzymatic activities and the restriction to soil
microbe activities were weakened. Therefore,
soil enzymatic activities as well as soil
microbial
biomass
were
reduced.
Dehydrogenase, produced by live organism,
promoting soil organic matter mineralization, is
also an important index to evaluate soil organic
matter
decomposing
anaerobically
(Brzezinaska, 1998). Consequently, more soil
microbial biomass and microbe exudation
resulted in higher soil enzymatic activities in
paddy soil (Zeng et al., 2005). Again higher
acid phosphatase values were obtained at the
initial crop growth period owing to acidic
reaction of the soil whereas higher alkaline
phosphatase values were obtained towards crop
maturity stage (at 90 DAT and harvest) as there
was appreciation in soil pH.
References
Agricultural statistics at glance 2014, 1st edition,
by Ministry of Agriculture, Oxford
University press
Babajideand, P.A., Fagbola, O. 2014. Growth,
Yield and Nutrient Uptakes of Sesame
(Sesamum indicum) as Influenced by
Biofertilizer Inoculants. International
Journal of Current Microbiology and
Applied Science, 3(8): 859-879.
Brzezinaska, M., Stepniewska, Z., Stepniewski,
W. 1998. Soil oxygen status and
dehydrogenase activity. Soil Biology
and Biochemistry, 30: 1783-1790.
Kizilkaya, R. 2009. Nitrogen fixation capacity
of Azotobacter spp. strains isolated from
soils in different ecosystems and
relationship between them and the
microbiological properties of soils.
Journal of Environmental Biology,
30(1): 73-82.
Page, A.L., Miller R.H., Keeny, D.R. 1982.
Methods of soil and plant analysis, part2, 2nd Edn. No (9) Part in the series,
American Society of Agronomy, Inc.
Soil Science Society of American
Journal. Madison, Wisconsin, U.S.A.
Tabatabai, M.A. 1982. Soil enzymes. Page,
A.L., Miller, R.H., Keeney, D.R. (Eds.),
Methods of Soil Analysis. Part 2.
Chemical
and
Microbiological
Properties. Agronomy No. 9. ASA and
SSSA, Madison, WI: 903-948.
Tabatabai, M.A. and Bremner, J.M. 1969. Use
of p-nitrophenyl phosphate for assay of
soil phosphatase activity. Soil Biology
and Biochemistry, 1: 301-307.
Tabatabai, M.A. and Bremner, J.M. 1972.
Assay of urease activity in soils. Soil
Biology and Biochemistry, 4: 479-487.
Vance, E.D., Brookes, P.C. and Jenkinson, D.S.
1987. An extraction method for
measuring soil microbial carbon. Soil
Biology and Biochemistry. 19: 703-706.
Zeng, L.S., Liao, M., Chen, C.L. and Huang, C.
2005. Growth Stages of Rice (Oryza
sativa) young. Rice Science, 12(4):
283-288.
How to cite this article:
Soumya Ranjan Dehury, Rajeswari Das, Pinki Seth, Madhusmita Pradhan and Santanu Mohanty.
2018. Effect of Azotobacter vinelandii strain SRIAz3 and N-source on Microbiological Properties
of Rice Grown Soil. Int.J.Curr.Microbiol.App.Sci. 7(03): 2170-2178.
doi: />
2178