Effect of periodicity of exercise on serum metabolites of stall housed competition horses under climatic conditions of Odisha, India
Bạn đang xem bản rút gọn của tài liệu. Xem và tải ngay bản đầy đủ của tài liệu tại đây (376.71 KB, 10 trang )
Int.J.Curr.Microbiol.App.Sci (2018) 7(3): 3338-3347
International Journal of Current Microbiology and Applied Sciences
ISSN: 2319-7706 Volume 7 Number 03 (2018)
Journal homepage:
Original Research Article
/>
Effect of Periodicity of Exercise on Serum Metabolites of Stall Housed
competition Horses under Climatic Conditions of Odisha, India
S. Kanungo1*, C.R. Pradhan1, L.K. Babu1, K. Behera1, A.K. Palei1,
B. Jena2 and D.P. Das3
1
3
Department of Livestock Production Management, 2Department of Argo,
Department of Pathology, C.V.Sc. and A. H., O.U.A.T., Bhubaneswar-751003, India
*Corresponding author
ABSTRACT
Keywords
Exercise,
Hematological, Serum
biochemical,
Parameters, Horses,
Hot climate
Article Info
Accepted:
26 February 2018
Available Online:
10 March 2018
The present study was carried out in the thoroughbred stall housed horses maintained at
College of Veterinary Science and Animal Husbandry, Bhubaneswar under hot and humid
climatic conditions of Odisha with an objective to determine the effect of exercise on
hematological and serum biochemical indices. Blood samples were drawn from jugular
veins of the animals in the morning and 30, 240 and 480 minutes after exercise and
subsequently assessed for haematological and serum biochemical parameters. It was
confirmed that the mean total erythrocyte and leucocyte, haemoglobin concentration,
Packed Cell Volume, total serum protein values increased immediately after the exercise,
whereas the ESR, whole blood glucose showed decreasing trends. Further, the serum
chloride level decreased significantly 4 hours after the exercise, but the values related to
serum Na, K, Mg, Ca and P levels were not statistically significant after exercise in the
horses. It can be concluded that the horses maintained under hot and humid climatic
conditions of Odisha exhibited similar changes in blood when given exercise and the
changes were of transitory nature. Further study is needed to be taken up to ascertain the
facts responsible for a low erythrocyte count in these horses.
Introduction
Variations in hematological parameters in
horses are associated with several factors such
as exercise and training, feeding, age, sex,
breed, diurnal and seasonal variation,
temperature and the physiological status etc.
Physical, hematological, and biochemical
changes associated with exercise have been
extensively analyzed in several types of horses
such as Thoroughbreds (Mukai et al., 2007),
endurance horses (Santos et al., 2001 and
Teixiera-Neto et al., 2008 and Munoz et al.,
2006), and show jumpers (Aguilera et al.,
2000). The performance of the athlete is
determined
by
many
complicated
interdependent
haematochemical
and
physiological processes (Warwick, 2004).
According to Lindinger and Heingenhauser
(2008), other parameters can be used to
determine the effect of exercise, such as
glucose, enzymatic and haematochemical
parameters, and electrolytes (Na+, K+ and Cl-)
with the purpose of defining reliable
3338
Int.J.Curr.Microbiol.App.Sci (2018) 7(3): 3338-3347
parameters for the horse’s performance
assessment. In the horse, electrolytes play an
important role in maintaining osmotic
pressure, fluid balance, and nerve and muscle
activity (Frape, 2010). So, it is important to
have some idea of the magnitude of loss of
electrolytes from a horse during exercise (Van
den berg, 2009). Since it is important to
analyse the modifications of these parameters
in the function of different systems and types
of energy utilized (De Miranda et al., 2009),
haematological, biochemical and electrolytic
parameters have largely been evaluated during
different kinds of physical effort, such as trot
races (Tateo et al., 2008 and Piccione et al.,
2009) and endurance training and racing
(Lindinger and Heingenhauser, 2008; Robert
et al., 2010; Munoz et al., 2010 The climatic
conditions of Odisha differ a lot from that of
other parts of country. There is more rain and
this causes increased humidity. A fair idea of
hematological changes in these animals is
necessary to show as to how they behave in
Odisha climate, after work stress, under
different climatic conditions. So, an effort was
made to study the haematological and serum
biochemical variations correlated with
performance in the Jumper horses before and
after exercise to know their athletic potentials
thus addressing a paucity of scientific data in
this area. Further, it was hoped that this work
would provide a foundation to develop a
regime that can be used for screening potential
of competition horses.
Materials and Methods
The present study was carried out in the
thoroughbred stall housed horses maintained
at College of Veterinary Science and Animal
Husbandry, Bhubaneswar under hot and
humid climatic conditions of Odisha with an
objective to determine the effect of exercise
on hematological and serum biochemical
indices. Four gelds and two mares within the
age group of five to fourteen years on
balanced diet were selected and were regularly
put to exercise six days per week. However,
before the animals were used for experiments,
routine checkup of faecal samples were done.
The horses were vaccinated against Anthrax
and Mallein test was conducted as a regular
routine. Four gelds and two mares were used
as the control group (Group-I) in order to
record the normal hematological and serum
biochemical parameters such as total
erythrocyte (RBC), total leucocytes (WBC),
Haemoglobin (Hb), Packed Cell volume
(PCV), Mean Corpuscular Volume (MCV),
Mean Corpuscular Hemoglobin (MCH), Mean
Corpuscular
Hemoglobin
Concentration
(MCHC), Erythrocyte Sedimentation Rate
(ESR), Serum total glucose, Whole blood
glucose, Serum Sodium, Potassium, Calcium,
Magnesium and Chloride levels were
estimated in the early morning at 06.30AM.
Subsequently, these parameters were recorded
in the same horses immediately after putting
them to exercise for 30 minutes (Group-II),
one hundred forty minutes (4 hours) after
exercise (Group-III) and four hundred eighty
minutes (8 hours) after the exercise (GroupIV) respectively.
Collection and preservation of blood and
serum
Five milliliters of blood were collected at
05.40. hrs by jugular venipuncture into
evacuated
collection
tubes.
For
haematological study blood was collected in
sterile vial using EDTA as anticoagulant @ 1
mg/ml of blood as recommended by Jain
(1986) and for collection and preservation of
serum 10 ml of blood was collected from
jugular vein of each horse in sterilized test
tubes. The tubes containing blood were kept in
slanting position and the blood was allowed to
clot. After the blood got clotted, the tubes
were transferred to refrigerator at 4 degree
centigrade for 12 hours to allow maximum
secretion of serum from the clot. Then the
3339
Int.J.Curr.Microbiol.App.Sci (2018) 7(3): 3338-3347
serum was pipetted out from the tubes and was
centrifuged at 2,500 rpm for 5 minutes to
separate unlysed cells and other darts. The
clear serum was collected carefully into
sterilized vials and stored in the frozen
chamber of the refrigerator. No preservatives
were added to the serum. Before using the
frozen serum for experiment, it was allowed to
defrost at room temperature.
Estimation haematological
biochemical parameters
and
All behavior and weather parameter data were
averaged to obtain values for statistical
analysis. Rectal temperature (RT), Respiration
Rate (RR) and Pulse Rate (PR) were measured
and analyzed. Different behavior of horse was
recorded for last 15 days in each month for
analysis. The results of the study were
recorded and statistically analyzed as per the
methods suggested by Snedecor Cochran and
(1989).
serum
Results and Discussion
Sahli’s acid hematin method was employed
for estimation of haemoglobin by using N/10
Hydrochloric acid (HCl) and expressed as g/dl
(Coles, 1986). The PCV (%) and TEC (no. of
erythrocytes × 106/μl of blood) were estimated
by Wintrob’s haematocrit method and
haemocytometer method respectively as
described by Coles (1986). Similarily, the
TLC (no.of leucocytes × 103/μl of blood) and
ESR (mm//hr fall) were estimated by
haemocytometer method and the procedure
described by Coles (1986) respectively. The
glucose levels [milligrams per decilitre
(mg/dL)/m(%)] and total serum protein [grams
per deciliter (g/dL)] were estimated by
Modified International Federation of Clinical
Chemistry and Laboratory Medicine (IFCC)
method (Burtis and Ashwood, 1999) and
Biuret method (Johnson et al., 1999).
respectively by using the diagnostic kits
supplied by M/s Crest Biosystem™, a division
of Coral clinical systems, Goa. Further, the
concentration of serum calcium (mg/dl),
phosphorous (mg/dl), magnesium (mg/dl),
sodium (mg/dl) and potassium (mg/dl) were
estimated
by
Modified
International
Federation of Clinical Chemistry and
Laboratory Medicine (IFCC) method as per
the procedure described by Burtis and
Ashwood (1999), using the reagent kit
supplied by Crest Biosystems™, a division of
Coral clinical systems, Goa.
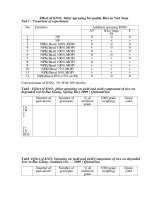
The mean values of the hematological
parameters of six horses before exercise have
been enlisted in Table 1 and values
immediately after exercise are shown in Table
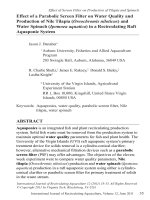
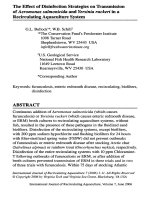
2. The respective values at 240 minutes and
480 minutes following exercise are given in
Table 3 and 4. The mean values of all the
parameters indicating degree of significance
have been shown in Table 5.
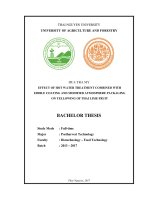
The mean total erythrocyte concentration in
the horses of Group I was estimated to be 5.28
± 0.44 x10⁶ cmm. Immediately after exercise
the value was 6.73 ± 0.43 x 10⁶ cmm.
Analysis of variance showed significant (P ≤
0.05)
Increase
in
total
erythrocyte
concentration immediately after exercise.
Critical difference also indicated a significant
(P ≤ 0.05) increase. Subsequent estimations of
total erythrocyte values at 240 minutes and
480 minutes after exercise were not found to
be significant.
The mean total leucocyte value of the
experimental animals at rest in Group I was
evaluated to be 9708.33 ± 352.40 cmm. There
was a rise in the leucocyte level in Group II
and III. However, this was not statistically
significant. The level of total leucocytes at 480
minutes after exercise was though less than
the control group and was not significant
(Table 5).
3340
Int.J.Curr.Microbiol.App.Sci (2018) 7(3): 3338-3347
The mean hemoglobin level of the
experimental horses in control group was
recorded to be 10.33 ± 0.63 gram Percent.
Analysis of variance showed significant (P ≤
0.01) increase just after exercise. Immediately
after exercise the horses (Group II) showed an
increase in hemoglobin level to 11.83 ± 0.54
g. percent and this was statistically
signification of hemoglobin level were found
to be not significant (Table 5).
The mean packed cell volume of the control
group of horses (Group I) was found to be
29.83 ± 1.19 percent. Analysis of variance
indicated significant (p ≤ 0.01) increase
immediately after exercise. The mean packed
cell volume immediately after exercise was
estimated to be 32.83 ± 1.35 percent. This was
significantly (p ≤ 0.05) high in comparison to
group I. The mean values of this parameter at
240 and 480 minutes after exercise were not
significant (Table 5).
The mean corpuscular volume of the horses in
group I was calculated to be 57.84 ± 3.61 cuµ.
Following exercise estimation of the mean
corpuscular volume at different intervals was
found to be not significant with regard to the
control group (Table 5).
The mean corpuscular hemoglobin level of the
horses in the control group was assessed to be
20.13 ± 1.66 µµg. Estimation of this
parameter at different intervals after exercise
was found to be not significant (Table 5).
The
mean
corpuscular
hemoglobin
concentration of the horses in Group I was
calculated to be 34.63 ± 1.54 percent. The
mean value of this parameter following
exercise at different interval of time was found
to be not significant (table 5).
The mean erythrocyte sedimentation rate of
the experimental horses in control group was
found to be 34.17 ±.0.75 millimeter. The
analysis of variance showed that following
exercise there was a significant (p ≤ 0.01)
decrease after exercise. The mean level of this
parameter immediately (Group II) after
exercise was recorded to be 10.33 ±1.2 and
25.67 ± 1.14 millimeter respectively. The
mean values of erythrocyte sedimentation rate
as stated above after exercise were not
significant within themselves and also in
comparison with the control group. However,
the mean level of the parameter 480 minutes
after exercise was not significant with regard
to the control group (Table 5).
The mean level of serum total protein in the
horses at rest was estimate to be 7.45 ± 0.14
gm%. Subsequent estimation after exercise
showed significant (p ≤ 0.01) increase.
Immediately following exercise the mean
level of serum total protein was recorded to be
8.45 ± 0.26 g. percent and was significantly (p
≤ 0.05) higher than the control group. Two
hundred and forty minutes (Group-III) after
exercise the mean level dropped to 7.87 ≤ 0.27
gram percent and was not significant in
comparison to the levels in the horses of group
I and Group II. However, the mean value of
this parameter in the horses, 480 minutes after
exercise (Group IV) was found to be less than
the values of Group II and Group III (Table 5).
The mean level of whole blood glucose in
group I (Control) was estimated to be 80.00
+±3.87 mg. percent. Subsequent estimations
after exercise was found to be significantly (P
≤ 0. 01) low. The mean level in group II was
71.67 ± 4.62 mg. percent and was significantly
(P≤0.05) low. The glucose level was found to
be 77.00 ≤ 4.09 mg. percent in the horse of
Group III and this was not significant with
regard to the values of Group I and Group II.
The mean glucose level of the horses in Group
II.
3341
Int.J.Curr.Microbiol.App.Sci (2018) 7(3): 3338-3347
Table.1 Hematological parameters of horse before exercise (Group I)
Hors
e No.
RBC
(Cmm)
WBC
(Cmm)
Hb
(g%
)
PCV
(%)
MCV
cuµ
MC
H
(ppg)
MCH
C
percen
t
ESR
mm/3
0
mins
Total
protei
n
(g%)
Glucos
e
(mg%)
Na
mEq/
L
K
mEq/
L
Ca
(mg%
)
Mg2
mEq/
L
Cl2
mEq/
L
1
2
6.29x10⁶
5.89x10⁶
8.250
10.050
8.5
13
28
32
44.51
54.30
30.35
40.62
36
35
7.50
7.75
80
75
144
156
4.571
4.428
12.00
11.30
2.80
2.80
102
82
3
4.12x10⁶
10.400
10
27
65.50
37.03
32
7.20
80
140
4.285
13.10
2.90
106
4
6.49x10
6
10.600
11
34
52.30
32.35
36
6.85
90
135
4.928
12.30
2.65
128
5
4.65x10
6
9.250
10
31
66.60
32.25
34
7.70
65
148
4.50
11.90
2.75
112
6
4.23x10⁶
9.700
9.5
27
63.80
35.18
32
7.70
90
142
4.571
12.00
2.80
102
Mea
n
±S.E.
5.28x10⁶
±0.44x10
9,708.3
3
±352.4
0
10.3
3
±0.6
3
29.8
3
±1.1
9
13.50
22.07
1
24.27
1
16.94
9
21.50
5
22.45
8
57.84
±3.61
20.13
±1.66
34.63
±1.54
34.17
±0.75
7.45
±0.147
80.00
±3.87
144.1
7
±2.95
4.547
±0.08
8
12.10
±0.24
1
2.78
±0.03
3
105.3
3
±6.12
6
Table.2 Hematological parameters of horse after exercise (Group II)
Horse RBC
No.
(Cmm)
1
2
3
4
5
6
Mean
±S.E.
7.89x10⁶
6.74x10⁶
5.56x10⁶
8.10x10⁶
6.13x10⁶
5.95x10⁶
6.73x 10⁶
±0.43x10⁶
WBC
(Cmm)
Hb
PCV
(g%) (%)
MCV MCH
cuµ
(ppg)
13,000
11,850
12,350
12,050
10,800
10,300
11.725.00
±409.54
10.00
14.00
11.50
12.50
11.50
11.50
11.83
±0.54
36.75
54.80
53.90
44.40
55.40
52.10
49.55
±3.04
29
37
30
36
34
31
32.82
±1.35
12.67
20.771
20.682
15.432
18.76
19.327
17.94
±1.32
MCHC ESR
percent mm/30
mins
34.48
11
37.83
9
38.33
7
34.72
12
33.82
15
37.09
8
36.05
10.33
±0.79
±1.20
Total
protein
(g%)
8
9.25
8.25
7.70
8.25
9.25
8.45±
0.265
Glucose Na
(mg%) mEq/L
K
Ca
Mg2
Cl2
mEq/L (mg%) mEq/L mEq/L
78
70
82
75
50
75
71.67±
4.62
5.00
4.928
3.285
4.857
4.50
4.50
4.51±
0.261
145
152
142
154
144
158
149.17±
2.61
11.9
11
13
12
11.6
13
12.08±
0.32
2.75
2.80
2.90
2.90
2.75
2.80
2.80±
0.02
116
74
100
125
98
100
102.17
±7.15
Table.3 Hematological parameters of horse 240 minutes (4 hours) after exercise (Group III)
Horse
No.
RBC
(Cmm)
WBC
(Cmm)
Hb
(g%)
PCV
(%)
MCV
cuµ
MCH
(ppg)
MCHC
percent
ESR
mm/30
mins
Total
protein
(g%)
Glucose
(mg%)
Na
mEq/L
K
mEq/L
Ca
(mg% )
Mg2
mEq/L
Cl2
mEq/L
1
2
3
4
5
6
Mean±
S.E.
5.44x10⁶
4.55x10⁶
5.58x10⁶
6.57x10⁶
8.03x10⁶
4.35x10⁶
5.75x10⁶
±0.56x10⁶
8.400
12.600
8.850
10.500
8.500
10.150
9.833.33
±658.10
8.50
13.00
10.00
11.5
11.00
9.5
10.58±
0.65
26
29
27
35
32
27
29.33±
1.43
47.70
63.70
48.30
53.20
39.80
62.06
52.46±
1.29
15.625
28.571
17.921
17.503
13.698
21.839
19.19±
2.18
32.69
44.82
37.03
32.85
34.37
35.18
36.16±
1.85
25
23
25
26
31
24
25.67±
1.14
7.70
8.25
7.20
9.00
7.33
7.70
7.87±
0.27
84
70
90
80
62
76
77±
4.09
144
160
142
150
130
130
142.67
±4.75
4.285
4.87
3.785
4.352
3.571
4.50
4.33±
0.196
10.40
12.70
11
13.70
13.20
14.30
12.55±
0.628
2.75
2.80
2.80
2.65
2.75
2.75
2.75±
0.02
92
80
94
118
95
102
96.83
±5.14
Table.4 Hematological parameters of horse 480 minutes (8 hours) after exercise (Group IV)
Horse RBC
No.
(Cmm)
1
2
3
4
5
6
Mean
±S.E.
5.65x10⁶
5.35x10⁶
4.33x10⁶
5.72x10⁶
675x106
4.05x10⁶
5.30x10⁶±
0.40x10⁶
WBC
(Cmm)
Hb
(g%)
PCV
(%)
MCV
cuµ
MCH
(ppg)
MCHC ESR
Total Glucose Na
percent mm/30 protein (mg%) mEq/L
mins
(g%)
K
Ca
Mg2
Cl2
mEq/L (mg%) mEq/L mEq/L
8.300
11.300
8.550
8.600
9.900
8.650
9.216.66±
475.76
9.00
13.00
10.00
11.00
10.00
9.5
10.42±
0.58
26
32
27
34
31
27
29.50±
3.55
46.00
59.70
62.30
59.50
45.90
66.60
56.66±
3.55
15.929
24.299
23.094
19.23
14.814
23.456
20.14±
1.67
34.69
40.62
37.03
32.35
32.23
35.18
35.35±
1.29
3.857
4.571
3.857
4.87
4.285
4.571
4.34±
0.167
34
34
32
37
36
31
55±
0.93
3342
7.65
7.80
7.20
6.15
7.20
7.50
7.25±
0.241
82
90
96
86
78
87
86.50±
2.55
130
142
125
156
148
144
140.83±
4.69
11.40
12.90
12.30
12.40
12.26
12.00
12.21±
0.20
2.75
2.80
2.80
2.65
2.75
2.75
2.75±
0.02
103
82
103
130
110
104
105.33±
6.29
Int.J.Curr.Microbiol.App.Sci (2018) 7(3): 3338-3347
Table.5 Hematological parameters of horse before and after exercise (Mean ± S.E)
Horse
Group
RBC (Cmm) WBC
(Cmm)
1.(before
exercise)
K
Ca
Mg2
Cl2
mEq/L (mg%) mEq/L mEq/L
3. (4 hrs)
after
exercise
Total
protein
(g%)
7.45
±0.147
ac
8.45±
0.265
b
7.87±
0.27
ab
Glucose Na
(mg%) mEq/L
5.28x10⁶
±0.44x10⁶
a
6.73x 10⁶
±0.43x10⁶
b
5.75x10⁶
±0.56x10⁶
a
MCHC ESR
percent mm/30
mins
9,708.33 10.33 29.83 57.84 20.13 34.63 34.17
±352.40 ±0.63 ±1.19 ±3.61 ±1.66 ±1.54 ±0.75
a
A
a
a
a
a
a
11.725.00 11.83 32.82 49.55 17.94 36.05 10.33
±409.54 ±0.54 ±1.35 ±3.04 ±1.32 ±0.79 ±1.20
a
B
b
a
a
a
b
9.833.33 10.58± 29.33± 52.46± 19.19± 36.16± 25.67±
±658.10 0.65
1.43
1.29
2.18
1.85
1.14
a
A
a
a
a
a
c
80.00
±3.87
ac
71.67±
4.62
b
77±
4.09
ab
144.17
±2.95
a
149.17±
2.61
a
142.67
±4.75
a
4.547
±0.088
a
4.51±
0.261
a
4.33±
0.196
a
4. (8 hrs)
after
exercise
5.30x10⁶±
0.40x10⁶
a
9.216.66± 10.42± 29.50± 56.66± 20.14± 35.35± 55±
475.76
0.58
3.55
3.55
1.67
1.29
0.93
a
A
a
a
a
a
a
7.25±
0.241
c
86.50±
2.55
c
140.83± 4.34±
4.69
0.167
a
a
2. (after
exercise)
Hb
(g%)
PCV
(%)
MCV
cuµ
MCH
(ppg)
The mean glucose level of the horses in
Group IV increased to 86.50 ± 2.55 mg.
percent and this was significantly (P ≤ 0.05)
higher than Group II and III (Table 5).
The mean values of serum sodium in Group I
was found to be 144.17 ± 2.95 mEq./L.
Analysis of variance Indicated that the values
after exercise at different intervals were not
statistically significant in comparison with the
control.
The mean serum potassium concentration in
horses at rest was recorded to be 4.54 ± 0.08
mEq./L. The potassium levels after exercise at
different intervals were not significant with
regard to normal value.
The mean serum calcium level of hours of
Group I was estimated to be 12.10 ± 0.24
milligram percent. The mean values after
exercise at different intervals of time were not
significantly different (Table 5).
The mean serum magnesium level in Group I
was recorded to be 2.78 ± 0.03 mEQ./L.
There was no significant change in the mean
value after exercise.
The mean serum chloride level of the
experimental animals in Group I was found to
12.10
±0.241
a
12.08±
0.32
a
12.55±
0.628
a
2.78
±0.033
a
2.80±
0.02
a
2.75±
0.02
a
12.21± 2.75±
0.20
0.02
a
a
105.33
±6.12
a
102.17
±7.15
a
96.83
±5.14
b
105.33±
6.29
a
be 105.33 ± 6.12 mEq./L. There was a
significant (p <0.05) decrease of chloride
level at 240 minutes after exercise (Table 5).
The normal mean whole blood glucose level
in the experimental horses was 80.00 + 3.87
m percent, whereas, Blood and Henderson
(1981) has mentioned the normal level to be
60-100 mg./dl. Immediately after exercise a
significant (P ≤ 0.05) fall in the glucose level
was observed which was in agreement with
the observation of Bhatti and Shaikh (2007).
The glucose level improved at 4 and 8 hours
after exercise. The low value immediately
following exercise was due to utilization of
glucose during exercise. The stress was
relieved after 4 and 8 hours of exercise and
the horses had their norm al food and water.
This caused a significant (P≤0.05) increase in
whole blood glucose at 8 hours after exercise
during which the horse had adequate rest.
The normal mean serum sodium and
potassium levels in the horses were found to
be within the ranges as stated by Blood and
Henderson (1981). An increased sodium level
immediately after exercise was recorded but
the increase was not statistically significant.
The levels after 4 hours and 8 hours of rest
were within normal range. The serum
potassium level showed a decrease after
3343
Int.J.Curr.Microbiol.App.Sci (2018) 7(3): 3338-3347
exercise at all the intervals of time but was
not significant at any stage. The findings were
not in agreement with Soliman and Nadim
(1967). These workers reported that a slight
decrease in sodium and a significant fall in
potassium level occurred after a strenuous
exercise. This might have a relation to the
timing of blood collection after exercise.
The average serum calcium and magnesium
levels in the horses were in the same range as
mentioned by Blood and Henderson (1981).
The levels in these electrolytes did not show
any deviation after exercise.
The estimation of serum chloride before and
soon after exercise did not show significant
change. However, the mean level was
significantly (P ≤ 0.05) low at 4 hours after
exercise. This could not be explained.
A complete study of the above said
parameters indicated that significant (P ≤
0.05) increase in total erythrocyte, total
hemoglobin, packed cell volume and total
protein and significant (P ≤0.05) fall in
erythrocyte sedimentation rate and whole
blood glucose occurred after exercise. There
was no change in blood electrolytes. It may be
concluded that analysis of blood for
hemoglobin, erythrocyte sedimentation rate,
total protein and whole blood glucose after
exercise are indicative of stress. In any
diseased condition the hemoglobin and
protein mainly, may not be in normal range.
The results obtained after estimation of
hematological parameters in horses after
exercise showed change in some of the
observations. Analysis of variance of the
results was first done to find out significance
of each parameter after exercise in
comparison to the values before exercise.
Critical differences of the parameters were
thereafter recorded (Table 5) to specifically
the significance of parameters at different
time intervals. This helped to compare the
values within the groups and at different time
intervals.
The mean level of total erythrocyte in
experimental horses during rest was
comparatively less than those reported by
Gupta et al., (2002). The low mean value was
probably due to inclusion of a few old
animals. Immediately following exercise there
was significant (P < 0.05) increase in the
mean level (Table 5). The finding agreed with
the observation of Andriichuk and Tkachenko
(2015). The effect of exercise at 4 and 8 hours
was not statistically significant, although it
was higher. The rise in total erythrocyte soon
after exercise might be due to more of cells in
circulation following splenic contraction.
Stimulation of hematopoietic system can lead
to an increase in total erythrocyte, but this
may happen due to exercise.
The average value of total leucocyte
concentration in the experimental horses was
within the range observed by Gopalakrishnan
et al., (1973) in the Indian race horses and
was comparatively less than those reported by
Gupta et al., (2002). The mean level of total
leucocyte showed an increase immediately
after exercise but was not statistically
significant. Similar results were reported by
Octura et al., (2014). The level dropped at 4
and 8 hours after exercise reaching the
reaching the range of the control group (Table
5). Increased blood cell number due to splenic
contraction might have attributed to increase
in total leucocyte level during exercise,
though it was not significant.
The mean hemoglobin level of the horses
during rest was less than that reported by
earlier workers by Octura et al., (2014) and
Andriichuk and Tkachenko (2015). Similar
low value was also obtained in total
erythrocyte level in these horses before
exercise. The reason for a low value may be
3344
Int.J.Curr.Microbiol.App.Sci (2018) 7(3): 3338-3347
the inclusion of more number of old horses,
which presented lot of variation in
confirmation and breed character. Low
hemoglobin was directly proportional to low
erythrocyte level. Immediately following
exercise there was an increase in hemoglobin
concentration. This was related to a similar
increase in erythrocyte count after exercise.
Four and eight hours after exercise the
hemoglobin dropped to normal range as was
in control group. Identical observation was
also noted in total erythrocyte level.
The average level of packed cell volume of
the horses was lower than the levels reported
by Gopalakrishnan et al., (1973) Fregin
(1980) and Blood and Hendersen (1981),
Such low value was evident as the total
erythrocyte level was also lower in the horses.
However, an increase (P<0.01) in level was
recorded in the horses after exercise. Similar
results were also obtained by Kosslla (1976)
and Fregin (1980). The significant increase in
the packed cell volume soon after exercise
was due to significant increase in erythrocyte
count (Table 5) and loss of fluid during
exercise through sweating. The average
values reached the control level at 4 and 8
hours after exercise. A significant increase in
packed cell volume in horses immediately
after exercise denoted hemoconcentration
during increased packed cell volume results
from hemoconcentration following exercise
and due to release of more number of
erythrocyte from spleen.
These parameters were calculated using the
erythrocyte and hemoglobin values. A
decrease in MCV and MCH and an increase
in MCHC has been observed immediately
after exercise but none of the values were
statistically significant. Reduced mean
corpuscular volume is probably the result of
shrinkage of red cell wall resulting from
changed osmotic pressure, thus, there were
more cells in a comparatively lesser PCV.
Low MCH was also related to the above
factor.
The
corpuscular
hemoglobin
concentration was higher than the control
level but was not significant though the whole
blood
hemoglobin
concentration
was
significantly (P<0.05) higher than the control
value immediately after exercise.
The normal erythrocyte sedimentation rate in
the horses was near the range reported by
Octura et al., (2014). The sedimentation rate
was significantly (P<0.05) low after exercise
(Table 5). Such condition was due to
increased muscular action and respiratory rate
during exercise leading to quicker movement
of circulating blood in the tissues. It was also
observed that though the sedimentation rate
increased after 4 hours of exercise, yet it was
significantly (P<0.05) lower than the control
level (Table 5). Further, it has also been
recorded that though the mean erythrocyte
level increased significantly (P<0.05) less at 4
hours after exercise. The sedimentation rate
reached the normal level after 8 hours of
exercise
In the present experiment the horses were
allowed to trot for 30 minutes and at the end
of exercise blood sample were collected to
estimate the erythrocyte sedimentation rate.
ESR during rest after exercise was 34.17 +
0.75 and 10.33 + 1.20 mn/30 minutes. Such a
low erythrocyte sedimentation rate was not
observed in this experiment even though the
horses were given 30 minutes of trotting.
The normal mean serum total protein value of
the experimental horses was higher than that
reported by Anderson et al., (1975)
significant (P<0.01) increase after exercise
was observed. Critical difference further
revealed that the total protein level was not
significantly high at 4 hours after exercise
than the control and was not significantly low
than the level immediately after exercise.
These changes in total protein indicated that
3345
Int.J.Curr.Microbiol.App.Sci (2018) 7(3): 3338-3347
exertion and less water intake might have
caused significantly (P<0.05) high total
protein level following exercise. Two hours
after exercise all the horses were supplied
with their normal ration.
It can be concluded that the horses maintained
under hot and humid climatic conditions of
Orissa exhibited similar changes in blood
when given exercise and the changes were of
transitory nature. Further study is needed to
be taken up to ascertain the facts responsible
for a low erythrocyte count in these horses.
Acknowledgements
The authors are grateful to the Dean, College
of Veterinary Science and Animal Husbandry,
OUAT, Bhubaneswar and Commandant, 1
(Orissa) R & V Sqn., N.C.C for providing
necessary facilities in the Department of
Livestock Production and Management and
N.C.C. division respectively for smooth
conduction and completion of the research
within the stipulated time.
References
Aguilera-Tejero, E., Estepa, J.C., Lopez, I., Bas,
S., Mayer-Valor, R. and Rodriguez, M.
(2000). Quantitative analysis of acid-base
balance in show jumpers before and after
exercise. Res Vet Sci., 68:103-8.
Anderson, M.G. (1975). The influence of
exercise on serum levels in the horse.
Equine Veterinary Journal., 7(3):160-5.
Andriichuk, A. and Tkachenko, H. (2015).
Seasonal variations of hematological
indices in equines involved in recreational
horse riding. Journal of Ecology and
Protection of the Coastline., 19: 11-12.
Barrey, E., Valette, J. P. (1993). Exerciserelated parameters of horses competing in
show jumping events ranging from a
regional to an international level. Annual
Zootech., 42: 89-98.
Bhatti, R. and Shaikh, D.M. (2007).The Effect
of Exercise on Blood Parameters.
Pakistan Journal of Physiology., 3(2): 4446.
Blood, D.C., and Hendersen, J.A. (1981).
Veterinary Medicine 5th ed., Williams and
Wilkin Company, Baltimore.
Burtis, C.A and Ashwood, E.R. (1999). eds.
Tietz Textbook of Clinical Chemistry.
WB Saunders, Philadelphia, PA, pp. 617–
721.
Coles, E.H. (1974). Veterinary Clinical
Pathology.
W.B.S.
Saunders
Co.
Philadelphia, P.A.
De Miranda, R. L., Mundim, A.V., Silveira
Saqui, A.C., Souza Costa, A., Guimaraes,
E. C. Goncalves, F. C., Ozanam Carneiro,
F. and Silva, E. (2009): Biochemical
serum profi le of equine subjected to team
penning. Vet. Clin. Pathol., 18: 313-319.
Frape, D. (2010). Water requirements and fl uid
losses. In: Equine Nutrition and Feeding,
Wiley Blackwell Publications, pp. 37-45.
Fregin, G.F. (1980). General discussion of
physiological observations recorded on
117 horses during 100 mile endurance
ride. In : Proceeding of the Annual
convention.
Gopalakrishnan, L.V., Viswanathan, S. and
Bhaskar, C.G. (1973). Plasma inorganic
Calcium and Phosphorus in Indian horses.
Indian Vet. J., 50: 308-311.
Gupta, A. K. Sanjay Kumar and Yash Pal.
(2012). Biochemical, Haematological and
Thyroid Hormone Profile in Healthy
Indian Kathiawari Horses. Asian-Aust. J.
Anim. Sci., 15(8): 1215-1221.
Jain, N. C. (1986). Schalm’s Veterinary
haematology, 4th edn. Lea and febiger,
Philadelphia.
Johnson, A.M., Rohlfs, E.M. and Silverman,
L.M. (1999). Proteins. In: C.A. Burtis and
E.R. Ashwood, editors. Tietz Textbook of
Clinic. Chem. 3rd ed. W.B. Saunders Co.
Philadelphia. pp. 477-540.
Kosslla, V., Tanhuanpaa, E., Peltonen, T. and
Vartanen, E. (1976). Effect of physical
stress on the pulse and respiration rate
and blood composition of riding horses
3346
Int.J.Curr.Microbiol.App.Sci (2018) 7(3): 3338-3347
and trotters. Annales Agricultura Fenniae,
15: 322-329. Quoted from Vet. Bull., 48:
1274.
Lindinger, M. I. and Heingenhauser, G. J. F.
(2008). Last word on point: counterpoint:
lactate is not the only physicochemical
contributor to the acidosis of exercise. J.
Appl. Physiol., 105: 369.
Mukai, K., Takahashi, T., Eto, D., Ohmura, H.,
Tsubone, H. and Hiraga, A. (2007). Heart
rates and blood lactate response in
Thoroughbreds horses during a race. J
Equine Sci., 18:153-60.
Munoz, A., C. Riber, P. Trigo, F. M. Castejón
(2010).
Dehydration,
electrolyte
imbalances
and
renin-angiotensinaldosterone-vasopressin axis in successful
and unsuccessful endurance horses.
Equine Vet. J. 42, 83-90.
Munoz, A., Cuesta, I., Riber, C., Gata, J., Trigo,
P. and Castejon, F.M. (2006). Trot
asymmetry in relation to physical
performance and metabolism in equine
endurance rides. Equine Vet J., 36:50-4.
Octura, J. E.R., Lee, K. J., Cho, H.W., Vega R.
S.A., Choi,J.Y., Jeong-Woong Park,
Teak-Soon Shin, Seong-Keun Cho,
Byeong- Wook Cho, W. and Byung.
(2014). Elevation of Blood Creatine
Kinase and Selected Blood Parameters
after
Exercise
in
Thoroughbred
Racehorses (Equus caballus L.). Journal
of Research in Agriculture and Animal
Science., 2(5):07-13.
Piccione, G., Casella, S. Giannetto, C.,
Monteverde, V. and Ferrantelli, V.
(2009). Exercise-induced modifications
on haematochemical and electrophoretic
parameters during 1600 and 2000 meters
trot races in standardbred horses. J. Appl.
Anim. Res., 35: 131-135.
Robert, C., Goachet, A., Fraipont, A., Votion,
D.M., Van Erck, E. and Leclerc, J.L.
(2010). Hydration and electrolyte balance
in horses during an endurance season.
Equine Vet.J., 42: 98-104.
Santos, S.A., Silva, R.A., Azevedo, J.R., Mello,
M.A., Soares, A.C. and Sibuya, C.Y.
(2001). Serum electrolyte and total
protein alterations in Pantaneiro horse
during long distance exercise. Arq Bras
Med Vet Zootec., 53:351-7.
Snedecor, G.W. and Cochran, W.G. (1989).
Statistical methods, 8th edition. Lowa
State University Press, Ames, Iowa.
Soliman, M.K. and Nadim, M.A. (1967).
Calcium Sodium and Potassium level in
the serum and sweat of healthy horses
after strenuous exercise. Zentbl. Vet.
Med., 14A: 53-56. Quoted from Vet.
Bull., 37: 2872.
Tateo, A., Valle, E., Padalino, B., Centoducati,
P. and Bergero, D. (2008). Change in
some physiologic variables induced by
Italian traditional conditioning in standard
bred yearling. J. Equine Vet. Sci., 28:
743-750.
Teixiera-Neto, A.R., Ferraz, G.C., Moscardini,
A.R., Balsamao, G.M., Souza, J.C. and
Queiroz-Neto, A. (2008). Alterations in
muscular enzymes of horses competing
long-distance endurance rides under
tropical climate. Arq Bras Med Vet
Zootec., 60:543-9.
Van den berg, M. (2009). Exercising horses in
summer time, sweating and electrolyte
losses. Horses and people, pp. 6-8.
Warwick, B. (2004). Foreword. In: Equine
Sports Medicine and Surgery. Basic and
Clinical Sciences of Equine Athlete.
(Hinchcliff, K. W., A. J. Kaneps, R. J.
Geor, Eds.), Sauders Press, China.
How to cite this article:
Kanungo, S., C.R. Pradhan, L.K. Babu, K. Behera, A.K. Palei, B. Jena and Das, D.P. 2018. Effect
of Periodicity of Exercise on Serum Metabolites of Stall Housed competition Horses under
Climatic Conditions of Odisha, India. Int.J.Curr.Microbiol.App.Sci. 7(03): 3338-3347.
doi: />
3347