Physico-chemical, functional and rheological properties of proteins from Pinkperch (Nemipterus japonicus) meat: Effect of freezing and frozen storage
Bạn đang xem bản rút gọn của tài liệu. Xem và tải ngay bản đầy đủ của tài liệu tại đây (484.99 KB, 22 trang )
Int.J.Curr.Microbiol.App.Sci (2018) 7(3): 3113-3135
International Journal of Current Microbiology and Applied Sciences
ISSN: 2319-7706 Volume 7 Number 03 (2018)
Journal homepage:
Original Research Article
/>
Physico-Chemical, Functional and Rheological Properties of
Proteins from Pinkperch (Nemipterus japonicus) Meat: Effect of
Freezing and Frozen Storage
K. Rathnakumar1, 2*
1
Department of Fish Processing Technology, University of Agricultural Sciences, College of
Fisheries, Mangalore - 575 002, India
2
Department of Fish Process Engineering, College of Fisheries Engineering, Tamil Nadu
Fisheries University, Nagapattinam – 611 001, India
*Corresponding author
ABSTRACT
Keywords
Pinkperch
(Nemipterus
japonicas), Frozen
storage
Article Info
Accepted:
26 February 2018
Available Online:
10 March 2018
The properties of total protein from whole pinkperch (Nemipterus japonicus) meat as
affected by freezing and frozen storage at -20°C have been assessed. Three major protein
components were indicated by gel filtration profile. The apparent reduced viscosity at zero
protein concentration was 0.109 ml/mg. The gel forming ability of the meat was high as
indicated by large strain and small strain test. Freezing and frozen storage of pinkperch
meat for 300 days reduced the protein solubility and Ca ++ ATPase activity significantly
(P<0.05). The aggregation reaction was more evident from reduced viscosity
measurements at different protein concentrations, gel filtration profile and SDS-PAGE
pattern. The emulsion capacity and stability was reduced to 58% and 38% respectively by
freezing and frozen storage. The gel forming ability decreased with increase in frozen
storage period. The dynamic viscoelastic behaviour as a function of frozen storage
revealed a loss in elastic structure build up reaction. Setting of pinkperch meat at 30°C for
1 hr increased the gel strength and altered the gelation profile.
Introduction
The most important criteria used to determine
the usefulness of a food protein is its
functional performance in food processing.
Apart from their high nutritive value, fish
proteins as a whole exhibit excellent
functional properties, as manifested by their
ability to form visco elastic gels, to bind
water, to emulsify fat and oil and to form
stable foams (Xiong 1997). For long term
preservation of fish and fishery products
freezing and frozen storage has been the
choice of the method of preservation (Sikorski
et al., 1976; Shenouda 1980; Matsumoto
1980). The rate of loss in eating quality is very
much dependent on species, method of
freezing, time and temperature of frozen
storage (Kinsella 1982). Textural properties of
fish meat are mainly attributed to major
protein components viz. myosin, and
actomyosin complex (Asghar et al., 1985;
Foegeding, 1987; Xiong, 1992). As a
consequence of freezing and frozen storage
3113
Int.J.Curr.Microbiol.App.Sci (2018) 7(3): 3113-3135
these proteins will undergo series of
alterations leading to changes in physico
chemical and functional properties (Sikorski et
al., 1976). It is well documented that
conformation of the protein molecules are key
to different functional and rheological
properties (Mac Donald and Lanier 1991;
Hamann 1992; Damodaran, 1994). Surimi is
primarily a concentrate of myofibrillar
proteins obtained from different fish species
after water washing the minced muscle, with
added cryoprotectants to ensure a good frozen
storage (Tejada 1994). Surimi has been used
as raw material for texturised and formulated
fish product like sea food analogue and fish
sausage. The ability of protein to bind fat is
important in sausages, meat replacers and
extenders, where the mouthfeel is an
important criteria. Textural analysis are
important for evaluating gels formed from
food materials and are usually used for quality
control, comparison purposes and food
product development (Ziegler and Foegeding
1990). Fundamental rheological tests provide
critical information on time dependent
viscoelastic behaviour and the molecular
mechanism surrounding the changes in
structure when a protein is undergoing
gelation (Kinsella 1982; Ziegler and
Foegeding 1990). Rheological study includes
“small-strain testing” and „large straintesting‟. Small strain rheological measurement
as a function of temperature is mainly studied
with reference to elastic and viscous
component. It is fairly well established that
large-strain instrumental testings required to
correlate with sensory texture which inturn
can determine the acceptability of a product
(Montejano et al., 1985).
Pinkperch fish a thread fin bream constitutes
5% of total marine landing in India. The
average marine landing of pinkperch fish is
around 90,000 MT (CMFRI 1995). The meat
of pinkperch has less of fat and high gel
forming ability (Holmes et al., 1992) and
forms a ideal raw material for the preparation
of surimi and gel products like fish sausage
and Kamaboko type products. In India few
surimi plants have been established recently
and using pinkperch fish as a raw material
extensively along with other species. Some of
the earlier works have been carried out on the
changes in the properties of proteins from
pinkperch mince during iced frozen storage
(Reddy and Srikar 1991; Srikar and Reddy
1991). In the present investigation an attempt
has been made to understand the changes in
the
physico-chemical,
functional
and
rheological behaviour of protein from the
whole pinkperch as affected by freezing and
frozen storage.
Materials and Methods
Sodium chloride, phosphate buffer salts
(monobasic and dibasic), acetic acid and
acetone were obtained from E.merck (India)
Ltd. Acrylamide, -Mercapto ethanol, bis(acrylamide), sodium dodecyl sulfate, bovine
serum albumin, Trizma base, ammonium
persulfate and Bromophenol blue were
procured from Sigma Chemical Co. Sepharose
6 B and Blue dextran were purchased from
Pharmacia fine chemicals. Refined sun flower
oil of sundrop brand was obtained from M/s
ITC-AgroTech, Secundrabad, India.
Pinkperch (Nemipterus japonicus) fish caught
off Mangalore, west coast of India were
brought to the laboratory in iced condition.
Fishes were thoroughly washed, packed in
polythene bag (4-5 fishes) and air blast frozen
at -35°C for 45 min using a blast freezer of
Armfield Ltd., Ringwood Hampshire,
England. Frozen samples were stored at -20°C
until further use. The frozen samples were
drawn at a periodic interval and thawed at
+4°C for overnight for further analysis.
Moisture, protein, fat and ash content of
pinkperch meat were estimated according to
the procedures of the AOAC (1984). All of the
3114
Int.J.Curr.Microbiol.App.Sci (2018) 7(3): 3113-3135
experiments were done in triplicate and the
mean values were reported. Non-protein
nitrogen (NPN) was determined by the method
of Velankar and Govindan (1958) using
trichloro-acetic acid precipitation.
Nitrogen solubility index (NSI)
NSI of fresh pinkperch was carried out with
distilled water as solvent. 3 g of meat
homogenised with 20 ml of distilled water at
3000 rpm using Ultratarrax, homogeniser for
30 sec. The pH of slurry was adjusted to
desired level (range 2-12) using 0.1 M HCl
/NaoH. The slurry was homogenised again for
15 sec and centrifuged at 10,000 g for 20 min
using IEC B-22 refrigerated centrifuge at 4°C.
Total nitrogen content in supernatant of each
sample was determined by Kjeldahl method.
The protein extracted (N 6.25) was expressed
as % total protein.
Nitrogen solubility as a function of sodium
chloride concentration
3 g of meat with 30 ml of phosphate buffer
(0.05 M, pH 7.5) containing, 0.3 M, 0.6 M, 0.8
M, 1.0 M, 1.5 M and 2.0 M sodium chloride
respectively was homogenised at 3000 rpm for
one min and centrifuged at 10,000 g for 20
min. Total nitrogen content in the supernatant
was determined by Kjeldahl method. The
protein solubilized (N 6.25) was expressed as
% total protein.
Solubility of pinkperch meat in extraction
buffer
Phosphate buffer (0.05 M, pH 7.5) containing 1
M NaCl herein after will be referred as
extraction buffer (EB). 3 g of meat was mixed
with 25 ml of EB and homogenised at 3000
rpm for 1 min using Ultra-tarrax homogeniser.
The slurry was centrifuged at 10,000 g for 15
min at 4°C. Nitrogen content in the supernatant
was estimated using Kjeldahl method.
Viscosity
Viscosity measurements of pinkperch protein
solution were made using an ostwald
viscometer at 25.0 1°C. The flow time for
double distilled water and EB were 85 and 90
sec respectively. Protein solutions of 10 ml
were equilibrated to the viscometer bath
temperature. The apparent reduced viscosity
(red) of the protein solutions were obtained
from its relative viscosity value according to
the procedures of Yang (1961) and Bradbury
(1970). The red values were obtained over the
range of protein concentration and a plot of
protein concentration (mg/ml) versus red were
obtained.
Ca2+ ATPase activity
Ca2+ ATPase activity was measured according
to the method of Noguchi and Matsumoto
(1970). About 1 g of meat was homogenised
in 10 ml of 50 mM Tris-HCl buffer (pH 8.0).
Homogenate was centrifuged at 8000 g for
15 min at 4°C. The supernatant thus obtained
was used as source of enzyme. 0.4 ml of
enzyme extract was added to the reaction
mixture consisting of 0.06 ml of ATP (50
mM) solution, 0.4 ml of CaCl2 (100 mM), 2.0
ml of Tris-HCl buffer (50 mM, pH 8.0) and
incubated for 5 min at 27°C. The reaction was
stopped by adding 2 ml of TCA. Liberated
inorganic phosphorus was determined by the
method of Taussky and Shorr (1952).
Gel filtration
Gel filtration of total protein extracted from
meat samples were carried out using
sepharose-6B gel packed in a column of 1.5
80 cm (dia height) using EB as eluant. The
total bed volume of the column was 135 ml
and void volume (Vo) determined using blue
dextran was found to be 44.0 ml. The protein
concentration used for loading the column was
17-18 mg. The flow rate was adjusted to 30
3115
Int.J.Curr.Microbiol.App.Sci (2018) 7(3): 3113-3135
ml/hr and fractions of 3 ml were collected
manually in tubes. The concentrations of the
fractions were measured at 280 nm using a
Bausch and Lomb, Spectronic -21,
Spectrophotometer. A plot of absorbance
versus elution volume was obtained for each
run.
was mixed well with 5 ml of water in a preweighed centrifugation tube and allowed to
stand for 30 min. Then centrifuged at 7000 g
for 10 min, the excess water released from
sample was decanted by inverting the tubes at
45° angle for 30 min at 50°C. The tubes were
weighed and WAC was expressed as grams of
water per grams of dried material.
Emulsion capacity (EC)
Preparation of gel
EC of total proteins from meat was
determined by the method of Swift et al.,
(1961). 25 g of meat was homogenised with
100 ml of chilled EB for 2 min. The slurry
was kept in refrigerator for 15 min to get
equilibrated. To 12.5 g of slurry 37.5 ml of
chilled EB and 50 ml of refined oil were
added. First it was homogenised at 9000 rpm
for 5-10 sec then homogenised at high speed
(23,000 rpm) with continuous addition of oil
at the rate of 0.5 to 0.6 ml/sec was carried out
until phase inversion occurred. The volume of
oil consumed till the collapse of emulsion was
recorded and the EC was expressed as milli
litres of oil per mg protein.
Emulsion stability (ES)
ES of meat was determined according to the
method of Paulson and Tung (1988). 10 g of
meat was homogenised with 100 ml of EB at
3000 rpm for 2 min and centrifuged at 8000
g for 15 min. To 10 ml of supernatant 10 ml of
oil was added and homogenised at 8000 rpm
for 1 min. 1 ml of homogenate was mixed
with 9 ml of EB containing 0.1% SDS and the
absorbance was measured at 500 nm. ES was
expressed as time taken to reach half of the
initial reading of absorbance at 500 nm.
Water absorption capacity (WAC)
Meat sample was freeze-dried using Edwards,
super modulyo, U.K. WAC of freeze-dried
material was determined by the method of
Sosulski (1962). 0.3 g of freeze dried sample
About 400 g of separated meat was ground
with 2.5% NaCl using pre-chilled pestle and
mortar for 10 min at 4°- 5°C. The viscous
paste thus obtained was stuffed into Krehlon
casings (40 mm thickness) of 3.020 cm
(dialength) using hand stuffer and sealed
with aluminum wire. One batch of stuffed
casings were subjected to heat processing
immediately at 90°C 2°C for 45 min and
then cooled in chilled water for 15 min. The
other batch of stuffed casings were incubated
at room temperature (28° 2°C) for 1 hr to
allow for setting process and then heat
processed as in the case of unset meat. The
gels obtained from both set and unset meat
were kept at 5°C overnight and then used for
gel strength measurements.
Gel strength
Gel strength of the gel prepared as above was
measured using Okado gellometer by the
method as described by Suzuki (1981). A 25
mm thick piece of gel was placed in under the
plunger of gellometer. The pressure on the gel
piece was applied by continuous running
water collected into a graduated beaker placed
over the plunger. The flow rate of water was
adjusted to a constant volume. The movement
of stylus on the kymograph was recorded and
the gel strength was measured by calculating
the area of triangle under the graph. The gel
strength was measured in triplicate. F factor
was calculated by measuring the volume of
water collected for a known time and the
3116
Int.J.Curr.Microbiol.App.Sci (2018) 7(3): 3113-3135
distance (cm) moved by the needle in
Kymograph. F factor is calculated as Vol. of water run down in unit time (ml)
F=
Distance
moved
by down in unit time (cm)
The following formula was used to calculate
the strength of the gel (G.S).
GS = ½ F A B g.cm.
A = The base of triangle in cm.
B = Height of the triangle in cm.
Dynamic visco - elasticity measurement
The visco-elastic properties of meat in the
range of temperature 30°-90°C was carried out
using Carri Med Controlled Stress Rheometer
(CSR) (Surrey, U.K.) under Oscillation mode.
The measuring geometry used was 4 cm
parallel plate and the gap between the peltier
plate and measuring system was set at 2000
m. The amplitude of the stress wave was
0.0005 rad with the frequency of 1 Hz. The
"In" phase component being storage modulus
or elastic component (G‟) and the 'out' phase
component is viscous or loss modulus (G”).
These two values along with sol-gel transition
phase (tan = G"/G') were recorded
continuously by the instrument.
About 4 g meat was macerated with 2.5%
NaCl (w/w) using pestle and mortar for a
constant time and then placed on to peltier
plate for measurement of viscoelastic
properties. The rate of heating was 1°C per
min achieved through the peltier system of the
instrument.
Sodium Dodecyl Sulfate Polyacrylamide
Gel Electrophoresis: (SDS - PAGE)
SDS-PAGE was carried out using a slab gel of
10 8 cm (length width) in a slab gel
apparatus of Hoofer Pharmacia Biotech. USA.
A discontinuous
gel
of acrylamide
concentration 10% (T) and 6.5% (T) was used
along with TEMED and ammonium persulfate
(0.1%). A constant current of 2 mA per well
of the gel was supplied using Hoofer
Pharmacia Biotech. USA power pack (PS 3000, DC powder supply). The running buffer
contained 1.5 M Tris-HCl buffer and 10%
SDS. After each run, gels were stained in
Coomassie blue and destained using 7% acetic
acid (Laemmli, 1970). 2 g of meat was ground
well with 2 ml of treatment buffer (10 ml of
treatment buffer contains, 2.5 ml of 4x trisHCl, 4 ml 10% SDS, 2.0 ml glycerol, 0.2 ml
mercapto ethanol, 0.2 mg bromophenol blue
and 1.3 ml DDW) and the content was heated
in boiling water bath at 100°C for 2 min. It
was cooled, centrifuged to get a clear
supernatant and stored in vials at -20°C for
future study. 5 l of clear solution (5 - 8 g)
was loaded onto the gel.
Statistical analysis
The data obtained were statistically analysed
using Karl pearsons linear correlation coefficient (Yamane 1967).
Results and Discussion
The composition of pinkperch meat indicated
a moisture content of 73.84% and a total
protein content of 18.9% (Table 1). The NPN
content of the meat constituted 10% of total
nitrogen. The bottom dwelling fishes like
pinkperch are known to have less of NPN
content compared to pelagic and shell fishes
(Tarr 1958). The fat content of the fish is less
than three percent, which can be taken as lean
variety fish. The variation in fat content with
season of Indian marine fishes is well
documented (Sen and Revanker 1972;
Gopakumar 1992).
The protein extractability in phosphate buffer,
pH 7.5, 50 mM containing 1 M NaCl was
3117
Int.J.Curr.Microbiol.App.Sci (2018) 7(3): 3113-3135
91.2% (Table 1). The extractability of protein
from different fresh fish in high ionic strength
buffer varies from 85-95% of total proteins
(Shamasundar and Prakash, 1994a). The
extractability in high ionic strength buffer is
generally taken as index of denaturation of
myofibrillar protein and is monitored during
different processing. The high extractability
value in the present study indicates the fresh
quality of pinkperch. The assay of Ca2+
ATPase activity of fresh meat was 0.684 g
Pi/mg protein/min. In the present study the
assay was carried out in the total protein
extract, the involvement of sarcoplasmic
ATPase cannot be ruled out. However the
ATPase enzyme activity of fresh fish of many
species is in the range of 0.182 to 1.8 g
Pi/mg protein/min (Suzuki 1981; Numakura et
al., 1989; Chan et al., 1995). Some of the
properties of total protein obtained from fresh
pinkperch are also given in Table 1. The
results will be discussed along with storage
behaviour pattern.
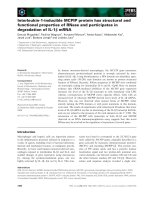
The NSI of fresh pinkperch meat is given in
Figure 1A. The NSI was carried out in the pH
range of 2.5 to 11.0. The minimum solubility
was recorded in the region of pH 5.0 to 6.0.
The solubility was high in alkaline pH range
than that of acidic range. As the pH
approaches the isoelectric point, the negative
and positive charges among protein molecules
are equal. Therefore, protein molecules are
strongly associated with each other through
ionic linkages (Kinsella 1984). Protein has
reduced solubility at that pH because protein
water-interaction is replaced by proteinprotein interaction. The usefulness of NSI
profile is helpful in deciding the optimum pH
for protein solubility in different processing.
Figure 1B depicts the solubility profile of
proteins from pinkperch as a function of NaCl
concentration. With an increase in molar
concentration more protein could be
solublized and a maximum extractability of
91.2% was recorded at 1 M concentration. At
1.5 and 2.0 M concentration a reduction in
solubility was observed mainly due to salting
out phenomenon. As the maximum solubility
obtained at 1 M NaCl the same concentration
was used for all further studies.
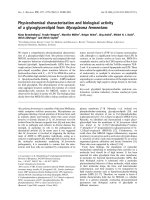
Solublization of myofibrillar proteins is prerequisite for many functional properties.
Figure 2A gives the percentage of protein
extracted as a function of frozen storage
period. The process of freezing reduced the
extractable protein from 91.20%-57.29%.
Subsequent storage at -20°C showed a gradual
decrease and reached the value of 41.62% at
the end of 300 days storage. Similarly the Ca2+
ATPase activity showed a steep fall due to the
freezing process and the values increased upto
60 days of storage (Fig. 2B). The rate of
decrease in the ATPase activity was gradual
upto 270 days of storage and reached a value
of 0.109 g Pi/mg protein/min at the end of
300 days. Both protein extractability and
measurement of Ca2+ ATPase activity
indicates alteration in the myofibrillar protein
as induced by freezing and frozen storage. The
alteration in the conformational status in major
protein fraction, myosin is by aggregation
(Tsuchiya et al., 1980). Such a process of
aggregation is mediated by hydrophobic,
disulfide and other covalent linkages
(Colmenero and Borderias 1983; Matsumoto
1979; Xiong 1997). The increase in ATPase
enzyme activity during the initial phase of
frozen storage period was attributed to
modification of the natural barrier between
enzyme and substrate or activator (Briskey
and Fukazawa 1971).
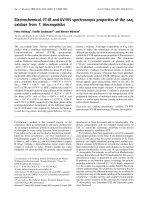
The apparent reduced viscosity of total
proteins from pinkperch stored for different
duration at -20°C is given in Figure 3A. The
apparent reduced viscosity as a function of
protein concentration changed with storage
period indicating an alteration in the shape of
the protein molecule. This was also evident
from the slope of the curve obtained for
3118
Int.J.Curr.Microbiol.App.Sci (2018) 7(3): 3113-3135
different storage period. A derivative graph
was obtained by plotting storage period versus
red at 10 mg/ml protein concentration (Fig.
3B). There is a progressive reduction in
reduced viscosity with increase in storage
period. The rate of decrease was maximum in
first 100 days of storage, presumably due to
formation of aggregates which was further
supported by solubility profile as a function of
frozen storage period. The decrease in
viscosity could be due to protein alterations
with the subsequent formation of small size
aggregates, which corresponds to proteinprotein interactions (Hermansson, 1979). The
formation of aggregates increased in size with
increase in frozen storage period and giving
rise to a greater loss of extractable protein and
a drastic decrease in viscosity (Borderias et
al., 1985). The decrease in reduced viscosity
with increase in frozen storage period has
been reported (Pastoriza et al., 1994;
Montecchia et al., 1997).
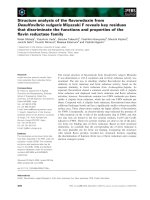
The gel filtration profile of total protein from
fresh pinkperch meat and frozen stored for
different duration are given in Figure 4. Total
protein from fresh pinkperch had 3 fractions,
two major and one minor. Among two major
fractions one is high molecular weight
component eluting at an elution volume 61.2
ml and a low molecular weight component
eluting at an elution volume of 135.5. The
minor peak eluted at 109.7 ml and is
intermediary in molecular weight between the
two major components. With freezing and
frozen storage for different periods, elution
pattern of the 3 peaks varied considerably
indicating association - dissociation reaction.
The dissociative process was more evident in
peak II (minor fraction) component where at
the end of 300 days of storage, the fraction
eluted at the volume of 119.9 ml. The
concentration of peak I reduced progressively
with increase in frozen storage period which
was evident from gel filtration profile and
SDS-PAGE pattern of the fraction collected
(Fig. 5). Gel filtration profile of proteins from
fish carried out by using different gels has been
reported (Umemoto and Kanna, 1970; Seki and
Arai, 1974; Ohnishi and Rodger, 1980). The
elution profile compares well with the present
study. Ohnishi and Rodger (1980) obtained the
elution sequence of myosin heavy chain, actin
and tropomyosin. The results obtained in the
present study agree with the above observation.
Elution sequence in gel filtration has direct
bearing on type of buffer pH salt concentration
used. The gel filtration date suggests the
molecular association - dissociation reaction.
The order to understand the association dissociation phenomenon further, SDS-PAGE
of total protein from pinkperch stored at -20°C
for different duration were carried out. The
SDS-PAGE pattern of fresh pinkperch suggests
the presence of multiple bands with clear
myosin heavy chain at top (Fig. 6).
With increase in frozen storage period there
was a progressive reduction in MHC
concentration which could be due to the
aggregation process. This result corroborates
well with the gelfiltration profile wherein the
concentration of peak I is reduced. The SDSPAGE pattern of total proteins obtained from
the latter parts of the storage period indicates
the dissociative process by increasing number
of low molecular weight bands (Fig Lane I).
This association - dissociation process of the
total protein of pinkperch during storage period
may have a bearing on the functional
properties.
The EC of total proteins from pinkperch
registered a decrease of 53% from its original
value at the end of 300 days of frozen storage
(Fig. 7) the reduction in EC value could be
attributed to the formation of aggregates during
storage. The ES value registered a steep fall in
first 30 days of frozen storage and reached the
values of 3.35 min at the end of 300 days of
storage (Fig. 7).
3119
Int.J.Curr.Microbiol.App.Sci (2018) 7(3): 3113-3135
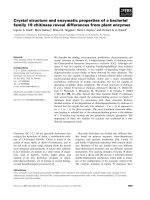
Fig.1A Nitrogen solubility Index of total proteins from fresh pinkperch meat with distilled water
as solvent
Fig.1B Protein solubility of fresh pinkperch meat as a function of molar concentration of sodium
chloride in phosphate buffer (50mM; pH 7.5)
Fig.2A Effect of freezing and frozen storage at –20°C, of pinkperch meat on the solubility of
total proteins. The solvent used was EB and soluble protein was expressed as % solubilized of
total protein content of meat
3120
Int.J.Curr.Microbiol.App.Sci (2018) 7(3): 3113-3135
Fig.2B Effect of freezing and frozen storage at –20°C, of pinkperch meat on calcium ATPase
activity of muscle extract in Tris-HCl buffer, pH 8.0, 50mM
Days
Fig.3A Changes in Non-protein nitrogen content of pinkperch meat as affected by freezing and
frozen storage at –20°C
Apparent reduced viscosity of Total Protein form meat at 10 mg/ml protein concentration as a function of frozen
storage period at –20°C
3121
Int.J.Curr.Microbiol.App.Sci (2018) 7(3): 3113-3135
Fig.4 Changes in gelfiltration profile of total protein from pinkperch meat on sepharose 6B gel,
as a function of freezing and frozen storage at –20°C. The eluant used was extraction buffer
(phosphate buffer, 50mM, pH 7.5; containing 1M NaCl)
3122
Int.J.Curr.Microbiol.App.Sci (2018) 7(3): 3113-3135
Fig.5 Changes in sol-gel transition (tan ) during dynamic viscoelastic measurement of
pinkperch meat as a function of freezing and frozen storage at –20°C. A) fresh pinkperch B)
immediately after freezing C) 30 days D) 90 days E) 120 days F) 150 days G) 240 days H) 300
days
3123
Int.J.Curr.Microbiol.App.Sci (2018) 7(3): 3113-3135
Fig.6 Changes in sol-gel transition (tan ) of set pinkperch meat during dynamic viscoelastic
measurement as a function of freezing and frozen storage at –20°C. The meat set at 30°C for 1
hr. A) fresh pinkperch B) immediately after freezing C) 30 days D) 90 days E) 120 days F) 150
days G) 240 days H) 300 days
3124
Int.J.Curr.Microbiol.App.Sci (2018) 7(3): 3113-3135
Fig.S1 Changes in EC&ES of total proteins from pink perch meat as a function of freezing and
frozen storage at –20°C
Fig.S2 Changes in gel strength of set and unset meat of pinkperch as a function of freezing and
frozen storage at –20°C
3125
Int.J.Curr.Microbiol.App.Sci (2018) 7(3): 3113-3135
Fig.S3 Changes in dynamic viscoelastic behaviour of pinkperch meat in the temperature range of
30-90°C, as affected by freezing and frozen storage at –20°C. DVB was carried out under
oscillatory mode. A) fresh pinkperch B) immediately after freezing C) 30 days D) 90 days E)
120 days F) 150 days G) 240 days H) 300 days
3126
Int.J.Curr.Microbiol.App.Sci (2018) 7(3): 3113-3135
Fig.S4 Changes in the dynamic viscoelastic behaviour of set pinkperch meat, in the temperature
range of 30-90°C as a function of freezing and frozen storage at -20°C. The meat set at 30°C for
1 hr. A) fresh pinkperch B) immediately after freezing C) 30 days D) 90 days E) 120 days
F) 210 days G)240 days H) 300 days
3127
Int.J.Curr.Microbiol.App.Sci (2018) 7(3): 3113-3135
Table.1 Physico-chemical and functional properties of protein from fresh pinkperch meat
Moisture %
Protein %
Fat %
Ash %
NPN (mg/100 g of meat)
Solubility in EB (% total protein)
Ca++ ATPase activity
(g Pi/mg protein/min)
Reduced viscosity at 10 mg/ml
Water absorption capacity
(g water/g dried material)
Emulsion capacity (ml oil/mg protein)
Emulsion stability (min)
Gel strength g.cm
Unset meat
Set meat
73.84 ( 0.28)
18.90 ( 0.33)
2.98 ( 0.18)
4.28 ( 0.02)
298.7 ( 0.18)
91.2 ( 0.34)
0.684 ( 0.08)
2.9
3.7 ( 0.447)
0.811 ( 0.45)
9.56
820.5 ( 2.13)
1844.13 ( 4.56)
Table.2 Changes in water absorption capacity of pink perch meat as a effects of freezing and
frozen storage
Age of Fish (days)
Water absorption capacity
(g water/ g dried material)
3.70
3.56
3.46
3.17
2.89
2.78
2.56
Fresh
Immediately after freezing
30
60
150
240
300
Table.3 Correlation matrix of results of physico-chemical tests on whole pinkperch stored at 20°C for 10 months
Parameters
Extractability
Ca2+ ATPase activity
Viscosity
Gel strength
set meat
Unset meat
Storage time
Extractability
Ca2+ ATPase
activity
0.9324a
0.9046a
0.9497a
0.8673a
0.8281a
0.7923a
0.78.46a
0.9483a
0.8329a
0.8633a
0.7033a
0.1944
a = P < 0.05
3128
Viscosity
0.6056
0.8703a
Int.J.Curr.Microbiol.App.Sci (2018) 7(3): 3113-3135
Table.4 The temperature at which maximum G‟ values recorded in set and unset meat
Storage period
(days)
Fresh
Immediately frozen
30
90
120
150
210
240
300
G’ maxima (dynes/cm2 1000)
Set
Unset
Temperature
G‟
Temperature
°C
°C
56.6
5984.0
70.0
56.6
4108.0
76.7
63.5
664.3
83.5
56.8
1305.0
83.3
63.5
981.2
83.3
63.5
3219.0
70.0
63.3
2039.0
70.0
70.0
1131.0
83.3
70.0
1037.0
76.7
G‟
4243.0
3366.0
1079.0
872.0
1618.0
2062.0
2437.0
837.2
1836.0
Table.5 Temperature at which maximum rate of increase in G‟ value recorded in unset and set
meat
Sample (days)
Fresh
Imm. Frozen
30
90
120
150
210
240
300
Temperature range
43.3 - 50.0
43.4 - 50.1
43.4 - 50.1
50.0 - 56.7
43.4 - 50.1
43.4 - 50.1
43.4 - 50.1
43.4 - 50.1
43.4 - 50.1
The denatured protein will not be able to
reduce the interfacial tension between oil and
water phase. However, in some of the protein
system, the stability of the emulsion form will
improve upon denaturation of protein
molecule (Aoki et al., 1980).
The WAC of the fresh pinkperch meat was
3.7 g water /g dried material. WAC value
decreased to 2.55 at the end of 60 days of
storage and a slight increase was observed
after 300 days of storage (Table 2). The
ability of the protein molecules to adsorb the
added water will decrease with alteration of
native structure (Hermansson, 1972). As the
Unset
5.0
4.19
2.02
1.89
2.95
4.70
3.24
2.23
4.02
Set
1.1
1.2
1.93
1.62
1.17
2.0
1.4
1.7
1.2
WAC was estimated in the freeze-dried
material the effect of freeze drying itself
cannot be ruled out. The presence of other
non-protein components in the meat may also
influence the WAC.
The gel forming ability of pinkperch meat
was evaluated by large strain test - Okado
gellometer and small strain test - Controlled
Stress Rheometer under Oscillatory mode in
the temperature range of 30°C - 90°C. The
strength of the gel obtained from the fresh
unset pinkperch meat was 820 g cm. The
setting of pinkperch meat at 30°C for 1 hr and
further heat processing increased the gel
3129
Int.J.Curr.Microbiol.App.Sci (2018) 7(3): 3113-3135
strength by 2.2 fold (Table 1). The effect of
freezing and frozen storage on the gel strength
of the gel obtained from pinkperch fish (both
unset and set) were given in Figure 8. The
progressive reduction in gel strength values of
both set and unset values demonstrates the
inability of myofibrillar proteins to orient
itself for proper network formation. This is
mainly due to loss in solubility (Fig. 2A)
because of formation of insoluble aggregate.
However, pinkperch meat could retain the
setting ability even after 300 days of frozen
storage as revealed by the gel strength values.
There was a significant correlation between
the frozen storage period and the gel strength
values of set and unset meat (Table 3). The
effect of freeze denaturation of protein from
herring surimi (Chan et al., 1995) and on
Alaska pollock surimi (Numakura et al.,
1989) on the final gel quality revealed similar
observation.
Dynamic viscoelastic behaviour
The gelation process in the given temperature
range can be monitored continuously by small
strain test using Controlled Stress Rheometer
(CSR). In the present study the dynamic
viscoelastic behaviour of pinkperch meat in
the temperature range of 30°-90°C was
monitored. Figure 9A-H represents dynamic
viscoelastic behaviour of unset pinkperch
meat as a function of frozen storage period.
The fresh pinkperch meat showed a structure
build up reaction between 50° - 70°C, due to
increase in elastic component as revealed by
storage modulus (G‟) values. The maximum
G‟ value was observed at 70.1°C and there
after a decrease in value was observed. The
building up of elastic component in the
temperature range of 50 to 70°C is mainly due
to hydrophobic interaction and disulfide
bonds (Chan et al., 1992; Niwa et al., 1992).
The addition of salt to the fish mince and
grinding will establish a sol state and further
heating will give rise to gel state, which has
well defined three dimensional network. The
temperature at which transition occur from sol
to gel state can be obtained by measuring tan
values which is a ratio of G”/G‟. The sol gel
transition of fresh unset pinkperch meat
occurred at 2 temperature viz. 36.7°C and
50°C (Fig. 10A). The storage modulus (G‟)
values decreased with increase in storage
period upto 90 days of storage (Fig. 9A-D).
There was a slight increase in the G‟ values in
the samples stored at 120, 150 and 300 days
in comparison to samples stored for 90 days.
However, there was drastic reduction in the
G‟ values at any given temperature from fresh
to 300 days of storage. It is not clear as to
how the storage modulus values could
increase in samples stored for 120, 150 and
300 days. The storage modulus (G‟) values
decreased at any given temperature with
increase in frozen storage period. The failure
to build up the elastic component during
heating can be attributed to the inability of the
molecules to form network. This inability
could arise because of aggregation, that had
occurred during frozen storage (Wu et al.,
1985). The temperature at which the sol-gel
transition occurred was unaltered during the
initial storage period (Fig. 10A-C). There was
no shift in the first transition temperature
(36.7°C) as a function of frozen storage
period. It was found that there was a slight
shift in the second transition temperature to
70 - 77°C in the later part of the storage
period (Fig. 10 G-H). This indicates frozen
storage had a effect on gelling process of
pinkperch meat. This was also confirmed by
large strain test conducted by Okado
gellometer.
The dynamic viscoelastic behaviour of the set
pinkperch meat in the temperature range of
30°-90°C is given in the Figure 11A-H. The
absolute G‟ value of the set meat had a higher
reading between 50 and 70°C compared to the
unset meat. The frozen storage period
significantly altered the structure build up
3130
Int.J.Curr.Microbiol.App.Sci (2018) 7(3): 3113-3135
reaction (G‟) of set pinkperch meat. The
temperature at which maximum G‟ value was
obtained both in unset and set at 30°C for 1 hr
is given in Table 4. The higher G‟ values
could be achieved in set meat at a lower
temperature than in that of unset meat. For
instance in fresh condition, the maximum G‟
values was achieved at 56.6° and at 70°C in
the set and unset meat respectively. The
frozen storage period did have influence on
the ability to achieve elastic component in set
meat also. The temperature at which
maximum G‟ values were obtained increased
with increase in frozen storage period. This
result was observed both in set and unset
meat.
The freezing and frozen storage of whole
pinkperch meat for a period of 300 days
revealed an aggregation process of proteins as
indicated by the protein solubility, reduction
in ATPase enzyme activity, decrease in
apparent reduced viscosity (10 mg/ml protein
concentration), gel filtration profile and SDSPAGE pattern. This aggregation process
altered surface active property and gel
forming ability. The gellation profile revealed
the structure build up reaction was decreased
with increase in frozen storage period. The
setting of pinkperch meat at 30°C for 1 hr
could increase the final strength of the gel.
The temperature at which maximum rate of
increase in G‟ values of unset and set meat as
a function of frozen storage period is given in
Table 5. It was found that the maximum rate
of increase in G‟ value was observed in the
temperature range of 43°-50°C. Though
gelling ability has been altered by freezing
and frozen storage the rate of structure built
up was constant at the temperature range of
43°-50°C. Comparatively the rate of structure
built up was maximum in unset meat. This
could be partly due to the nature of interaction
that had occurred during setting process.
However, the absolute G‟ values were higher
in case of set meat. During the cooking of
unset sol, a different gel structure could
results due to the rapid unfolding of proteins
forming hydrophobic and disulfide bonds
(Tejada, 1994).
AOAC, 1984. Official method of Analysis,
13th edition (W. Horowtiz, Ed.).
Association of Official Analytical
Chemists, Washington DC.
Aoki, H. Taneyama, O. and Orimo, N. 1980.
Emulsifying properties of soy protein:
Characteristics of 7S and 11S proteins.
J. Food Sci. 45, 534-538.
Asghar, A., Samejima, A. and Yasui. T. 1985.
Functionality of muscle protein in
gelation mechanisms of structured meat
products CRC Crit. Rev. Food Sci.
Nutr. 22, 27.
Borderias, A.J., Colmenero, J.F. and Tejada,
M. 1985. Viscosity and emulsifying of
fish and chicken muscle protein. J. Food
Technol. 20, 31-42.
Bradbury, J.H. 1970. Viscosity. In: Physical
principles and techniques in protein
chemistry, Part B (S.J. Leach, Ed.). pp
99-145, Academic Press, New York.
Briskey, E.J. and Fukazawa, T. 1971.
Myofibrillar proteins of skeletal muscle.
In Advances in Food Research (C.O.
Chichester, E.M. Mark, G.F. Stewart,
eds.) pp. 273-349. Academic press,
New York.
Chan, J.K. Gill, T.A. and Paulson, A.T. 1992.
Cross-linking ability of myosin heavy
The sol-gel transition in fresh set meat
occurred at 50.1°C (Fig. 12A). The
temperature at which the sol-gel transition
occurs did not follow any particular pattern
with reference to frozen storage period.
However, the setting experiments carried out
from meat stored at different period occurred
between 43.0 and 83.0°C being first and
second transition (Fig. 12 A-H).
References
3131
Int.J.Curr.Microbiol.App.Sci (2018) 7(3): 3113-3135
chains from cod, herring and silver lake
during thermal setting, J. Food Sci. 57,
906-912.
Chan, J.K., Gill, T.A., Thompson, J.N. and
Singer, D.S. 1995. Herring surimi
during low temperature setting, physico
chemical and textural properties. J.
Food Sci. 60, 1248-1253.
CMFRI, 1995. Marine Fisheries Information
service, 136 pp. 3-18, CMFRI, Cochin,
India.
Colemenero, F.J. and Borderias, A.. 1983. A
study of effects of frozen storage on
certain functional properties of meat
and fish protein. J. Food Technol. 18,
731-737.
Damodaran, S. 1994. Structure - function
relationship of food proteins. In protein
functionality in food systems (N.S.
Hettiarachchy, and G.R. Ziegler, eds.)
pp. 1-38. IFT basic symposium series,
9. Marcel Dekker Inc. New York.
Foedgeding, E.A. 1987. Functional properties
of turkey salt - soluble proteins. J. Food
Sci. 52, 1495-1499.
Gopakumar, K. 1992. Indian food fishes.
Biochemical
composition,
CIFT
Publication, CIFT - Cochin. p. 28.
Hamann, D.D. 1992. Rheological studies of
fish
proteins.
In
international
conference and Industrial exhibition on
food hydrocolloids. Tsukuba, Japan,
Nov, 16-20. pp. 4-49.
Hermansson, A. 1979. Aggregation and
denaturation involved in gel formation.
In. Functionality and protein structure.
(A. Pour-el ed.) p 81, American
chemical society, washington.
Hermansson,
A.M.
1972.
Functional
properties of proteins for foods. Labens
smith - Wiss Technol. 5, 24.
Holmes, K.L. Noguchi, S.F. and Mac Donald,
G.A. 1992. The Alaska pollack resource
and other species used for surimi. In
surimi technology (T.C. Lanier and
C.M. Lee, eds) pp. 41-75. Marcel
Dekker Inc. New York.
Kinsella, J.E. 1982. Relation between
structural and functional properties of
food protein. In: Food proteins (R.F.
Fox, and J.J. Condon, eds.) pp. 51-103,
Applied science publishers, New York.
Kinsella, J.E. 1984. Functional properties in
food proteins. Thermal modification
involving denaturation and gelation. In.
Research in Food Science and nutrition
(J. McLonghlin, ed.) p. 226, Book press,
Dublin.
Laemmlli, U.K. 1970. Cleavage of structural
protein during assembly of the head
bacteriophage T4. Nature (London).
227, 680-685.
Mac Donald, G.A. and Lanier, T.C. 1991.
Carbohydrates as cryoprotectants for
meats and surimi. Food Technol. 45,
150-159.
Matsumoto, J.J. 1979. Denaturation of muscle
proteins during frozen storage. In
proteins at low temperature (O.
Fennema, ed.) pp. 205-224. ACS
symposium
series
180,
ACS,
washington, DC.
Matsumoto, J.J. 1980. Chemical deterioration
of fish muscle proteins during frozen
storage. In. Chemical deterioration of
protein. (J.R. Whitaker, and M.
Fujimaki, eds.) pp. 95-124. American
Chemical Society, Washington DC.
Montecchia, C.L., Roura, S.I., Roladan, H.,
Perejborla, O. and Crupkin, M. 1997.
Biochemical and physico-chemical
properties of actomyosin from frozen
pre-and post-spawned hake. J. Food
Sci., 62, 491-495.
Montejano, J.G., Hamann, D.D. and Lanier,
T.C. 1985. Comparison of two
instrumental methods with senssory
texture of protein gels. J. Texture stud.
16, 403.
Niwa, E. 1992. Chemistry of surimi gelation.
In surimi technology (T.C. Lanier, and
3132
Int.J.Curr.Microbiol.App.Sci (2018) 7(3): 3113-3135
C.M. Lee, eds) p. 389. Marcel Dekker
Inc. New York.
Noguchi, S. and Matsumoto, J.J. 1970.
Studies on the control of denaturation of
the fish muscle proteins during the
frozen storage 1. Preventive effect of
Na-glutamase. Bull. Jap. Soc. Sci. Fish.,
36, 1078-1087.
Numakura, T., Mizoguchi, R., Kimura, I.,
Toyoda, K., Fujita, T., Seki, N. and
Arai, K. 1989. Changes in gel forming
ability and croos-linking ability of
myosin chain of Alaska pollack surimi
denatured by heat treatment. Nippon
suisan Gakkaishi, 55, 1083-1090.
Ohnishi, M. and Rodger, G.M. 1980. Analysis
of the salt soluble protein fraction of
cod muscle by gel filtration. In
Advances in Fish Science and
Technology. (J. J. Connell, ed.) pp. 420428, Fishing News Books Ltd., Surrey,
U.K.
Pastoriza, L., Sampedro, G. and Herera, J.J.
1994. Effects of mincing and frozen
storage on functional properties of Ray
muscle (Raja clavata). J. Sci. Food
Agric. 66, 35-44.
Paulson, A.T. and Tung, M.A. 1988.
Emulsification
properties
of
succinglated Gnome protein isolate. J.
Food Sci., 53, 817-820.
Reddy, G.V.S. and Srikar, L.N. 1991.
Preprocessing ice storage effects on
functional properties of fish mince
protein. J. Food Sci. 56, 965-968.
Seki, N. and Arai, K. 1974. Gel filtration and
electrophoresis of fish myofibrillar
proteins in the presence of sodium
dodecyle sulphate. Bull. Jap. Soc. Sci.
Fish. 40, 1187-1194.
Sen, D.P. and Revanker, G.D. 1972. Seasonal
variation in the amount of oil of oil
sardine fish. J. Food Sci. Tech. 9, 93.
Shamasundar, B.A. and Prakash, V. 1994a.
Physico-chemical
and
functional
properties of protein from prawns
(Metapenacus dobsoni). J. Agric. Food
Chem. 42, 169-174.
Shenouda, S.Y.K. 1980. Theories of protein
denaturation during frozen storage of
fish flesh. Adv. Food Res., 26, 275-311.
Sikorski, Z., Olley, J. and Kostuch, S. 1976.
Protein changes in frozen fish. Crit.
Rev. Food Sci. Nutr. 8, 97.
Sousulski, F.W. 1962. The centrifuge method
for determining water absorption in
hard red spring wheats. Cereal che., 39,
344-350.
Srikar, L.N. and Reddy, G.V.S. 1991. Protein
solubility and emulsifying capacity in
frozen stored fish mince. J. Sci. Food
Agric. 55, 447-453.
Suzuki. T. 1981. Frozen minced meat
(surimi). In. Fish and krill protein
processing Technology. pp. 115-147.
Applied science publishers. London.
Swift, C.E., Lockett, C. and Fryer, A.J. 1961.
Communated meat emissions the capacity
of meats for emulsifying fat. Food
Technol., 15, 468.
Tarr, H.L.A. 1958. Biochemistry of fishes.
Am. Rev. Biochem. 27, 223-224.
Taussky, H.H. and Shorr, E. 1952. A
microcolorimetric method for the
determination of inorganic phosphorus.
J. Bio. Chem., 202, 675-685.
Tejada, M. 1994. Gelation of myofibrillar fish
proteins. Rev. Esp. Cienc. Technol.
Aliment. 34, 257-273.
Tsuchiya, Y., Tsuchiya, T. and Matsumoto,
J.J. 1980. The nature of the cross-bridge
constituting aggregates of frozen stored
carp myosin and actomyosin. In
Advances in Fish Sciences and
Technology (J.J. Connell, ed.) pp. 434438, Fishing News (Books) Ltd.
London.
Umemoto, S. and Kanna, K. 1970. Studies on
gel filtration on fish muscle protein IV.
Changes in elution patterns by gel
filtration of extractable protein of fish
and rabbit muscle during cold storage at
3133
Int.J.Curr.Microbiol.App.Sci (2018) 7(3): 3113-3135
-20°C. Bull. Jap. Soc. Sci. Fish. 36,
798-805.
Velankar, N.L. and Govindan, J.K. 1958. A
preliminary study of the distribution of
non-protein nitrogen in some marine
fishes and invertebrates. Proc. Indian
Acad. Sci., 47, 202-209.
Wu, M.C., Akahane, T., Lanier, T.C. and
Hamann, D.D. 1985. Thermal transition
of actomyosin and surimi prepared from
Atlantic croaker as studied by
differential scanning calorimetry. J.
Food Sci. 50, 10-13.
Xiong, L.Y. 1997. Structure function
relationships of muscle proteins. In
Food proteins and their applications (S.
Damodaran, and A. Paraf, eds.) pp. 341386, Marcel Dekker. Inc. New York.
Xiong, Y.L. 1992. Thermally induced
interactions and gelation of combined
myofibrillar protein from white and red
boiler muscles. J. Food Sci. 57, 581-585.
Yamane, T. 1967. Statistics, an introductory
analysis. Harper and row (eds.) New
York.
Yang, J.T. 1961. The viscosity of
macromolecular relation to molecular
conformation. Adv. Protein Chem., 16,
323-400.
Ziegler, G.R. and Foregeding, A.E., 1990.
The gelation of proteins. Adv. Food
Nutr. Res. 34, 203-298.
How to cite this article:
Rathnakumar, K. 2018. Physico-Chemical, Functional and Rheological Properties of Proteins
from Pinkperch (Nemipterus japonicus) Meat: Effect of Freezing and Frozen Storage.
Int.J.Curr.Microbiol.App.Sci. 7(03): 3113-3135. doi: />
3134