Bài giảng Máy học nâng cao: Dimension reduction and feature selection - Trịnh Tấn Đạt
Bạn đang xem bản rút gọn của tài liệu. Xem và tải ngay bản đầy đủ của tài liệu tại đây (5.18 MB, 81 trang )
Trịnh Tấn Đạt
Khoa CNTT – Đại Học Sài Gòn
Email:
Website: />
Contents
Introduction: dimensionality reduction and feature selection
Dimensionality Reduction
Principal Component Analysis (PCA)
Fisher’s linear discriminant analysis (LDA)
Example: Eigenface
Feature Selection
Homework
Introduction
High-dimensional data often contain redundant features
reduce the accuracy of data classification algorithms
slow down the classification process
be a problem in storage and retrieval
hard to interpret (visualize)
Why we need dimensionality reduction???
To avoid “curse of dimensionality” /> To reduce feature measurement cost
To reduce computational cost
Introduction
Dimensionality reduction is one of the most popular techniques to remove noisy (i.e., irrelevant)
and redundant features.
Dimensionality reduction techniques: feature extraction v.s feature selection
feature extraction: given N features (set X), extract M new features (set Y) by linear or nonlinear combination of all the N features (i.e. PCA, LDA)
feature selection: choose a best subset of highly discriminant features of size M from the
available N features (i.e. Information Gain, ReliefF, Fisher Score)
Dimensionality Reduction
Principal component analysis (PCA)
❖ Variance v.s. Covariance
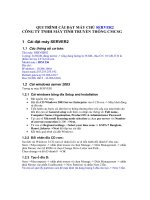
Variance : phương sai của một biến ngẫu nhiên là thước đo sự phân tán thống kê của
biến đó, nó hàm ý các giá trị của biến đó thường ở cách giá trị kỳ vọng bao xa.
Low variance
High variance
Covariance: hiệp phương sai là độ đo sự biến thiên cùng nhau của hai biến ngẫu nhiên
(phân biệt với phương sai - đo mức độ biến thiên của một biến)
N
Cov( X , Y ) =
( x − x )(y − y )
i =1
i
i
(N − 1)
Principal component analysis (PCA)
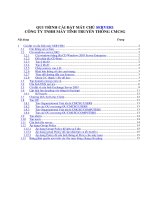
Mean (expected value): giá trị “mong muốn”,
biểu diễn giá trị trung bình của một biến.
Standard Deviation: Độ lệch chuẩn đo tính
biến động của giá trị mang tính thống kê. Nó
cho thấy sự chênh lệch về giá trị của từng thời
điểm đánh giá so với giá trị trung bình.
Principal component analysis (PCA)
Representing Covariance between dimensions as a matrix e.g. for 3 dimensions:
cov(x,y) = cov(y,x) hence matrix is symmetrical about the diagonal
N-dimensional data will result in NxN covariance matrix
Principal component analysis (PCA)
What is the interpretation of covariance calculations?
e.g.: dữ liệu 2 chiều
x: số lượng giờ học một môn học
y: điểm số của một môn học
covariance value ~ 104.53
what does this value mean?
-> số lượng giờ học tăng , điểm số
Principal component analysis (PCA)
Exact value is not as important as it’s sign.
A positive value of covariance indicates both dimensions increase or
decrease together (e.g. as the number of hours studied increases, the marks
in that subject increase.)
A negative value indicates while one increases the other decreases, or
vice-versa (e.g. active social life v.s performance in class.)
If covariance is zero: the two dimensions are independent of each other
(e.g. heights of students vs the marks obtained in a subject.)
Principal component analysis (PCA)
Principal component analysis (PCA)
Principal components analysis (PCA) là một phương pháp để đơn giản hóa một tập dữ liệu
(simplify a dataset) , chằng hạn giảm số chiều của dữ liệu.
“It is a linear transformation that chooses a new coordinate system for the data set such that
the greatest variance by any projection of the data set comes to lie on the first axis
(then called the first principal component),
the second greatest variance on the second axis
and so on. ”
PCA có thể được dùng để giảm số chiều bằng cách loại bỏ những thành phần chính không
quan trọng.
Principal component analysis (PCA)
Ví dụ:
loại bỏ sự tương quan này bằng cách xoay trục (cơ sở)
dữ liệu trên trục mới đã giảm
sự tương quan đáng kể
(biến Y1 và Y2 gần như không
tương quan)
sự thay đổi của dữ liệu phụ
thuộc phần lớn vào biến Y1
khi thực hiện các phân tích đa biến mà
trong đó các biến có tương quan với nhau
gây nhiều khó khăn
giảm số chiều dữ liệu mà
không làm giàm quá nhiều
“phương sai” của dữ liệu
Principal component analysis (PCA)
Note:
Giúp giảm số chiều của dữ liệu;
Thay vì giữ lại các trục tọa độ của không gian cũ, PCA xây dựng một không gian
mới ít chiều hơn, nhưng lại có khả năng biểu diễn dữ liệu tốt tương đương không
gian cũ.
Principal component analysis (PCA)
Ví dụ:
Khám phá liên kết tiềm ẩn nhờ đổi hệ trục tọa độ, cách nhìn khác nhau về cùng một dữ liệu.
Principal component analysis (PCA)
Ví dụ:
Notice that "the maximum variance" and "the minimum
error" are reached at the same time, namely when the line
points to the magenta ticks
Principal component analysis (PCA)
How to find the optimal linear transformation A ( where y = Ax)
-1. Origin of PCA coordinate mean of samples
-2. Maximize projected variance
min x − y
-3. Minimize projection cost
Principal component analysis (PCA)
/>
Principal component analysis (PCA)
Note:
The eigenvectors of the covariance matrix define a new coordinate system
Eigenvector with largest eigenvalue captures the most variation among
training vectors x
eigenvector with smallest eigenvalue has least variation
The eigenvectors are known as principal components
/>
Principal component analysis (PCA)
Algorithm: 7 steps
Input : N mẫu input
1. Tính vector trung bình của toàn bộ dữ liệu:
2. Trừ mỗi điểm dữ liệu đi vector trung bình của toàn bộ dữ liệu:
Note: subtracting the mean is equivalent to translating the coordinate system to the location of the mean
Principal component analysis (PCA)
3. Tính covaricance matrix
4. Perform the eigendecomposition : tìm eigenvectors và eigenvalues của S và sắp xếp
theo thứ từ giảm dần của eigenvalues .
5. Chọn K eigenvectors với K trị riêng lớn nhất để xây dựng ma trận UK (projection
matrix) có các cột tạo thành một hệ trực giao.
K vectors này, còn được gọi là các thành phần chính, tạo thành một không gian
con gần với phân bố của dữ liệu ban đầu đã chuẩn hoá.
Principal component analysis (PCA)
6. Chiếu dữ liệu ban đầu đã chuẩn hoá
xuống không gian con tìm được.
7. Dữ liệu mới chính là toạ độ của các điểm dữ liệu trên không gian mới.
Dữ liệu ban đầu có thể tính được xấp xỉ theo dữ liệu mới như sau:
PCA
Principal component analysis (PCA)