Treatment of ammonium in slaughterhouse wastewater by UASB technology combined with EGSB using anammox and PVA gel
Bạn đang xem bản rút gọn của tài liệu. Xem và tải ngay bản đầy đủ của tài liệu tại đây (786.26 KB, 5 trang )
Environmental Sciences | Ecology
Doi: 10.31276/VJSTE.62(1).85-89
Treatment of ammonium in slaughterhouse
wastewater by UASB technology combined
with EGSB using anammox and PVA gel
Minh Nhat Phan1, Nguyen Van Nhi Tran2, Jimmy Yu2, Tan Phong Nguyen1*
Faculty of Environment and Natural Resources, University of Technology, Vietnam National University, Ho Chi Minh city
2
Civil and Environmental Engineering, School of Engineering and Built Environment, Griffith University, Australia
1
Received 22 January 2020; accepted 10 March 2020
Abstract:
Introduction
Slaughterhouse wastewater (SWW) possesses very high
organic and nutrient concentrations and its residues
are moderately solubilized, which leads to pollution
affecting the environment and human health. The
objective of this study was to investigate the effective
removal of ammonium in slaughter wastewater by
up flow anaerobic sludge blanket (UASB) technology
combined with an expanded granular sludge bed
(EGSB) using anammox and PVA gel as the biomass
carrier. Ammonium loading rates (NLRs) increased
from 0.25 kg N-NH4+/m3.d to 0.75 kg N-NH4+/m3.d with
hydraulic retention times (HRTs) of 12, 6, and 4 h.
The system was operated in 2 phases. In phase 1, the
removal of ammonium by employing the combination
of UASB technology and EGSB using anammox was
examined. The removal efficiencies of nitrite were
52% (NLRs=0.25 kg N-NH4+/m3.d), 69% (NLRs=0.5
kg N-NH4+/m3.d) and 64% (NLRs=0.75 kg
N-NH4+/m3.d). On the other hand, the removal
efficiencies of ammonium were about 37% (NLRs=0.25
kg N-NH4+/m3.d), 64% (NLRs=0.5 kg N-NH4+/m3.d)
and 55% (NLRs=0.75 kg N-NH4+/m3.d). In phase 2,
a PVA gel was supplied to the EGSB as the biomass
carrier for growing the anammox sludge. The result
showed that the removal efficiencies of nitrite were
about 55% (NLRs=0.25 kg N-NH4+/m3.d), 77%
(NLRs=0.5 kg N-NH4+/m3.d), and 73% (NLRs=0.75
kg N-NH4+/m3.d). In addition, the removal efficiencies
of ammonium were about 56% (NLRs=0.25 kg
N-NH4+/m3.d), 68% (NLRs=0.5 kg N-NH4+/m3.d), and
60% (NLRs=0.75 kg N-NH4+/m3.d).
The main pollutant sources of wastewater from the
slaughtering process are paunch, faeces, fat and lard,
grease, undigested food, blood, suspended material, urine,
loose meat, soluble proteins, excrement, manure, grit,
and colloidal particles. SWW contains large amounts of
biochemical oxygen demand (BOD), chemical oxygen
demand (COD), total organic carbon (TOC), total nitrogen
(TN), total phosphorus (TP), and total suspended solids
(TSS). The treatment of SWW has been achieved by
traditional methods such as aerobic and anaerobic biological
systems.
Keywords: ammonium removal, anammox, EGSB, PVA
gel.
Classification number: 5.1
*Corresponding author: Email:
Anammox (anaerobic ammonium oxidation) is a
globally important
microbial
of the
cycle
suspended
solids (TSS).
Theprocess
treatment
of nitrogen
SWW has
been achieved b
that
takes
place
in
many
natural
processes.
Anammox
is
methods such as aerobic and anaerobic biological systems. a
reaction that ammonium oxidation to dinitrogen gas using
Anammox
(anaerobic
ammonium
oxidation)
is a [1].
globally importa
nitrite
as the electron
acceptor
under anoxic
conditions
process
of
the
nitrogen
cycle
that
takes
place
in
many
natural
Since its discovery two decades of ago, anammox-related processes. A
reaction
oxidationhave
to dinitrogen
gas using
nitrite as the elec
research that
andammonium
its applications
experienced
strong
under
anoxic
conditions
[1].
Since
its
discovery
two
decades
growth. Researchers have considered the anammox process of ago, ana
research
and of
its treating
applications
have experienced
strong growth. Rese
as a method
the high-nutrient
concentrations
considered
the
anammox
process
as
a
method
of
treating
the high-nutrient c
of wastewater. Based on mass balance from culture
of
wastewater.
Based
on mass batch
balance
from(SBR)
culturetoexperiments
using
experiments
using
a sequencing
reactor
take
batch
reactor
to take
account
of the biomass
growth,
account
of the(SBR)
biomass
growth,
the anammox
reaction
has the anammox
the following
following scaling
scalingcoefficients
coefficients[2,
[2,3].
3].
(1)
(1)
In comparison
comparison with traditional
In
traditional technologies,
technologies,anammox
anammoxhas many advan
high
nitrogen
removal, such
low as
operational
costs, removal,
and small space requ
has many
advantages
high nitrogen
Anammox
has been
successfully
treatment of[4].
wastewater on t
low operational
costs,
and smallapplied
space to
requirement
scale,
pilot has
scale,
andsuccessfully
full scale. Many
types
of wastewater
Anammox
been
applied
to treatment
of have been s
positive
results.
anammox
has been
wastewater
on For
the example,
laboratorythescale,
pilot process
scale, and
full applied to the
scale.
Many
types
of
wastewater
have
been
surveyed
with
landfill leachate. This research showed that ammonium removal effici
positiveand
results.
example,
the anammox
process
been
88.1%
TNFor
removal
efficiency
reached
80%has
[2].
However, in th
applied to process
the treatment
of landfill
leachate. with
This PVA
research
anammox
is applied
in combination
gel for the treatm
The purpose of the study is to assess slaughter wastewater treated by
combined with EGSB technologies as well as to evaluate the factors th
treatment efficiency of these processes.
Material and methods
Feed SWW
March 2020 • Vol.62 Number 1
Vietnam Journal of Science,
Technology and Engineering
85
SWW was taken from the VISSAN Company's wastewater treatme
characteristic of the SWW is shown in Table 1.
batch
batch reactor
reactor (SBR)
(SBR) to
to take
take account
account of
of the
the biomass
biomass
growth, the
the
anammox reaction
reaction
has
batch
reactor
(SBR)
to
take
account
of
the
biomass growth,
growth,
the anammox
anammox
reaction has
has
the
following
scaling
coefficients
[2,
3].
the
following
scaling
coefficients
[2,
3].
the following scaling coefficients [2, 3].
(1)
(1)
(1)
In
comparison
with
technologies,
anammox
has
many
advantages
such
as
In
traditional
In comparison
comparison with
with traditional
traditional technologies,
technologies, anammox
anammox has
has many
many advantages
advantages such
such as
as
high
nitrogen
removal,
low
operational
costs,
and
small
space
requirement
[4].
high nitrogen
nitrogen removal,
removal, low
low operational
operational costs,
costs, and
and small
small space
space requirement
requirement [4].
[4].
high
Anammox
has
been
successfully
applied
to
treatment
of
wastewater
on
the
laboratory
Anammox
been
applied
treatment
on
showed thathas
ammonium
removal efficiency
reached
88.1%of
The wastewater
pumped to the UASB was stored in a
Anammox
has
been successfully
successfully
applied to
to
treatment
of wastewater
wastewater
on the
the laboratory
laboratory
scale,
pilot
scale,
and
full
scale.
Many
types
of
wastewater
have
been
surveyed
scale,
pilot
scale,efficiency
and full
full reached
scale. Many
Many
types
of wastewater
wastewater
have
been
surveyed
with
and TN
removal
80% [2].
However,
in tank
withbeen
volume
of 90 l. with
The UASB is an acrylic tube with
scale,
pilot
scale,
and
scale.
types
of
have
surveyed
with
positive
results.
For
example,
the
anammox
process
has
been
applied
to
the
treatment
of
this
study,
the
anammox
process
is
applied
in
combination
a
working
volume
of
10
l
positive
results.
For
example,
the
anammox
process
has
been
applied
to
the
treatment
of
positive results. For example, the anammox process has been applied to the treatmentwith
of a height of 1.2 and 0.09 m
landfill
leachate.
This
research
showed
that
ammonium
removal
efficiency
reached
with
PVA
gel
for
the
treatment
of
SWW.
The
purpose
of
internal
diameter.
On
the
column,
there are 3 inspection
landfill leachate.
leachate. This
This research
research showed
showed that
that ammonium
ammonium removal
removal efficiency
efficiency reached
reached
landfill
the
study
is
to
assess
slaughter
wastewater
treated
by
using
valves.
Each
of
these
are
30
cm
apart
to collect wastewater
88.1%
and
TN
removal
efficiency
reached
80%
[2].
However,
in
this
study,
the
88.1%
88.1% and
and TN
TN removal
removal efficiency
efficiency reached
reached 80%
80% [2].
[2]. However,
However, in
in this
this study,
study, the
the
UASB
combined
with
EGSB
technologies
as
well
as
to
sludge
samples.
PN also an acrylic tube. The
anammox
for
treatment
of
SWW.
anammox process
process is
is applied
applied in
in combination
combination with
with PVA
PVA gel
gel and
for the
the
treatment
of The
SWW.
anammox
process
is
applied
in
combination
with
PVA
gel
for
the
treatment
of
SWW.
evaluate
the
factors
that
affect
the
treatment
efficiency
of
working
volume
is
12.4
l
with
0.78 m height and 0.14 m
The
purpose of
of
the
study
is
to
assess
slaughter
wastewater
treated
by
using
UASB
The
purpose
treated
by
using
UASB
The
of the
the study
study is
is to
to assess
assess slaughter
slaughter wastewater
wastewater
treated
bycentral
usingpipe
UASB
thesepurpose
processes.
diameter.
The
is
made
of PVC and is composed
combined
combined with
with EGSB
EGSB technologies
technologies as
as well
well as
as to
to evaluate
evaluate the
the factors
factors that
that affect
affect the
the
combined
with
EGSB
technologies
as
well
as
to
evaluate
that
affect
ofthe
a 40factors
cm long
section
of the
pipe connected to a cone with a
treatment
efficiency
of
these
processes.
Material efficiency
and methods
treatment
of
treatment
efficiency
of these
these processes.
processes.
chisel around it. Air flow was supplied from the bottom of
Material
and
methods
the tank through an air pump and adjusted through a valve.
Feed SWW
Material
and
Material
and methods
methods
After passing the UASB-PN, wastewater will be stored
SWWSWW
was taken from the VISSAN Company’s
Feed
Feed
Feed SWW
SWW
in tanks with volume of 90 l and pumped into the EGSB
wastewater treatment plant. The characteristic of the SWW
SWW
was
taken
from
the
VISSAN
Company's
wastewater
treatment
plant.
The
tank. The
EGSB tank
an acrylic tube with a working
SWW
was
taken
from
the
VISSAN
Company's
wastewater
treatment
plant.
SWWinwas
treatment
plant.is The
The
is shown
Tabletaken
1. from the VISSAN Company's wastewater
volume
of
10
l,
1.2
m
high
and 0.09 m internal diameter.
characteristic
of
the
SWW
is
shown
in
Table
1.
characteristic
of
is
characteristic
of the
the SWW
SWW
is shown
shown in
in Table
Table 1.
1.
Table 1. Characteristics
of SWW.
Water circulation in the tank is done through a circulating
Table
1.
of
SWW.
Table
1. Characteristics
Characteristics
of
SWW.
Table
of Unit
SWW.
pump. The treatment efficiency of the system is analysed
Parameter
Value
Serial 1. Characteristics
Serial
Parameter
Unit
Value
Serial
Parameter
Unit
Value
and evaluated.
Serial
Parameter
Unit
Value
1
pH
6.6-7.9
Environmental Sciences | Ecology
1
1
1
2
2
2
23
3
3
3
44
4
4
5
5
5
5
pH
pH
pH
COD
COD
COD
COD
-N
-N
-N
TKN
TKN
TKN
TKN
__N
_N
N
__
_N
N
N
Alkalinity
Alkalinity
Alkalinity
Alkalinity
TP
TP
TP
6
6
66
7
7
77
8
8
8
9
9
9
8
9
TP
Temperature
Temperature
Temperature
Temperature
mg/l
mg/l
mg/l
mg/lmg/l
mg/l
mg/l
mg/l
mg/lmg/l
mg/l
mg/l
mg/lmg/l
mg/l
mg/l
mg/l
mg/lmg/l
mg/l
mg CaCO3/l
6.6-7.9
6.6-7.9
1,000-1,400
1,000-1,400
1,000-1,400
90-140
90-140
90-140
90-140
130-170
130-170
130-170
130-170
0-1.58
0-1.58
0-1.58
0-1.58
6.6-7.9
1,000-1,400
0-2.50
0-2.50
0-2.50
0-2.50
600-1,200
mg
CaCO
/l
CaCO
/l 33/l
mg mg
CaCO
3
600-1,200
600-1,200
600-1,200
mg/lo
15-35
C
28-31
mg/l
mg/l
mg/l
o
oC
oC
C
15-35
15-35
15-35
28-31
28-31
28-31
Set-up
Set-up of
of experiment
experiment and
and operational
operational conditions
conditions
Set-up
of
experiment
and
operational
conditions
Set-up of experiment and operational conditions
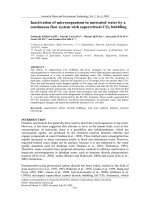
The lab-scale system has three reaction tanks including
the UASB, partial nitrification (PN), and EGSB is shown
in Fig. 1.
Enrichment of sludge and PVA gel
Enrichment of sludge: anaerobic sludge is taken from
the anaerobic tankand ammonia-oxidizing bacteria (AOB)
sludge is taken from the aeration tank of the VISSAN
wastewater treatment system. The anammox sludge is taken
from the Institute of Tropical Biology, Ho Chi Minh city.
PVA gel: the PVA gel was provided by KURARAY
AQUA CO., LTD. The PVA (Polyvinyl alcohol) gel is
comprised of 4 mm spherical beads having a specific
gravity of 1.025. One PVA-gel bead can hold up to 1 billion
microorganisms depending on operating conditions [5].
2
2
2
Operational conditions (Table
2)
Table 2. Operational conditions.
Input flow
(l/h)
HRT (h)
Ammonium loading rate
(kg NH4+-N/m3.d)
DO PN
(mg/l)
Operating time
(d)
0.5
12
0.25
0.8-1.0
1-20
1
6
0.5
0.8-1.0
21-40
1.5
4
0.75
1-1.2
41-60
Wastewater was brought from the wastewater tank to
the UASB through a pumping system. The reactor was
operated in dark conditions by using a black plastic sheet
fully covering the body to prevent the growth of algae. The
mixed liquor suspended solids (MLSS) concentration of the
reactor was maintained within 15,000 mg/l. The purpose of
the UASB is to treat large quantities of organic matter in
wastewater by converting organic nitrogen into ammonia to
facilitate subsequent processing.
Fig. 1. Schematic diagram of the lab-scale system. (1) Influent
tank, (2) Influent pump, (3) Air pump, (4) Air valve, (5) Pump, (6)
Circulating pump, (7) pH probe, (8) Biogas collection.
86
Vietnam Journal of Science,
Technology and Engineering
Water self-flowed from the UASB to the PN tank. The
MLSS in the PN was kept in the range of 4,000-5,000 mg/l,
the DO was adjusted from 0.8 to 1.2 mg O2/l, and the pH
March 2020 • Vol.62 Number 1
Environmental Sciences | Ecology
The EGSB tank contains the activity of anammox
microorganisms in anaerobic conditions. In addition, there
is a water circulation pump that create a disturbance in the
tank to increase the contact between the wastewater and
microorganisms. The biological processes that take place in
the tank will reduce the nitrogen content in the wastewater.
The model is split into two stages. During stage one, the
UASB/EGSB-anammox alone treated the SWW. In stage
2, the PVA gel was introduced into the model as a biomass
carrier.
+
alkalinity parameters in the operation were adjusted to quickly improve the ratio. In the
After the first 10 days the loading
rate of ammonium
+
proceeding days, the ratio of +NO2--N/NH
4 -N increased gradually day by day Until the
3
+ 4
thcorresponding to- HRT of
-N/m
.d,
was
up
to
0.75
kg
NH
ratio reached its highest value
4 on the 27 day, with an of NO2 -N/NH4 -N of 1.4 and
th
h,
and theefficiency
resultsofshowed
thatOnthe
conversion
efficiency
of 4+-N was
day, the ratio
of NO2--N/NH
conversion
nearly 57%.
the 30
+
1.31, which is similar
to the theoretical
and theof
ammonium
conversion
ammonium
decreased
to 44%, ratio,
the ratio
NO2 -N/NH
-Nefficiency
4
+
the range
of 1.22±0.2 is
reached 60%.in
In general,
an average
NO2--N/NHand
4 -N ratio
fluctuated
the range
of 0.9-0.93,
the inlowest
ratio,
suitable for the anammox process inth the EGSB tank.
0.79, was found on the 44 day. This proves that changing
firsta10great
days the
loadingon
ratethe
of ammonium
was Increased
up to 0.75 kg NH4+the After
loadthehas
impact
processes.
N/m3.d, corresponding to HRT of 4 h, and the results showed that the conversion
load
makes AOB sludge not able to adapt to the new living
efficiency of ammonium decreased to 44%, the ratio of NO2--N/NH4+-N fluctuated in the
environment
other
processes
become
This proves that
range of 0.9-0.93,and
and the
lowestbiological
ratio, 0.79, was
found on thealso
44th day.
unstable.
process
gradually
in theload
following
changing theThe
load has
a great impact
on the stabilized
processes. Increased
makes AOB sludge
+
not ableThen
to adapt
the new
living
and other
biological
processes also
days.
10 todays
later,
theenvironment
ratio of NO
-N/NH
-N was
2
4
The
process
gradually
stabilized
in
the
following
days. Then 10 days
become
unstable.
1.1±0.04 and relatively
stable.
On
day
59,
the
ammonium
later, the ratio of NO2--N/NH4+-N was 1.1±0.04 and relatively stable. On day 59, the
conversion
efficiency reached 59%.
ammonium conversion efficiency reached 59%.
After the loading rate of ammonium was increased to
0.5 kg NH4+-N/m3.d, the input wastewater had a relatively
stable ammonium content (123±8.8 mg/l). The ammonium
concentration after passing through UASB tank increased
to 130±8 mg/l. During the first few days during the loading
process, the ratio of NO2--N/NH4+-N was about 1.06 and the
conversion rate was only about 51%. Because this value
was quite low, the DO, pH and alkalinity parameters in the
operation were adjusted to quickly improve the ratio. In
the proceeding days, the ratio of NO2--N/NH4+-N increased
gradually day by day until the ratio reached its highest
value on the 27th day, with an of NO2--N/NH4+-N of 1.4 and
conversion efficiency of nearly 57%. On the 30th day, the
ratio of NO2--N/NH4+-N was 1.31, which is similar to the
-
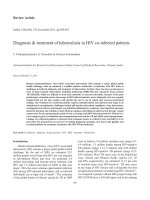
Partial nitritation (PN): figs. 2 and 3 show the loading
rate of ammonium to be 0.25 kg NH4+-N/m3.d corresponding
to an ammonium concentration of 120±7.5 mg/l. After the
SWW passed through the UASB tank, the ammonium
content increased to 134±7.5 mg/l. Nitrification process
took place in the PN tank and the ammonium conversion
efficiency was about 57%. The NO2--N/NH4+-N ratio was
about 1.27±0.3 and the highest ratio was 1.53 on the 20th
day with an ammonium conversion efficiency of 63%. The
DO in the PN tank at this stage was only about 0.8-1.0 mg/l,
and the pH was in the range of 7.4-8.2 after long retention
times to create conditions for AOB growth. The NO3--N
concentration of the effluent from the PN tank was very
low (5±1.2 mg/l). This proved that the process in the PN
tank was indeed the nitrification process, and the nitritation
process was almost non-existent.
NO2 /NH4+ ratio
Results and discussion
The UASB/EGSB-anammox
3
After the loading
ammonium
was increased
to 0.5 kg NH
4 -N/m .d, the input
theoretical
ratio, rate
andofthe
ammonium
conversion
efficiency
wastewater
had
a
relatively
stable
ammonium
content
(123±8.8
mg/l).
The ammonium
+
reached 60%. In general, an average NO2 -N/NH4 -N ratio
concentration after passing through UASB tank increased to 130±8 mg/l. During the first
in
the range of 1.22±0.2 is suitable for the anammox process
few days during the loading process, the ratio of NO2--N/NH4+-N was about 1.06 and the
in
the EGSB
tank.
conversion
rate was
only about 51%. Because this value was quite low, the DO, pH and
1.8
100
1.6
90
1.4
80
70
1.2
60
1
50
0.8
40
0.6
30
0.4
20
0.2
0
Efficiency (%)
was adjusted automatically through a pH controller and
chemical pump. NaHCO3 salt was added to the PN tank to
adjust the pH in the range of 7.5-8.5. The goal of the PN tank
is to convert a part of NH4+ into NO2- to a NH4+/NO2- ratio
of 1/1.32 and to prevent the formation of NO3-, creating the
most favourable conditions for the anammox process in the
EGSB tank to take place.
10
1 4 6 10 12 14 18 20 23 25 27 31 33 37 39 41 44 46 50 52 54 58 60
0
Time course (day)
NO2-/NH4+ ratio
Efficiency (%)
+ + ratio in the survey process.
Fig.
NO2-2/NH
/NH
in the survey process.
Fig. 2.
2. NO
4
4 ratio
Nitrogen removal
efficiency:
the concentration
of input and
output nitrogen
Nitrogen
removal
efficiency:
the concentration
of input
compounds
of
the
EGSB
tank
is
shown
in
Fig.
3.
Over
the
first
20
days,
the model was
and output nitrogen compounds of the
EGSB tank is shown
operated at a low loading rate of 0.25 kg NH4+-N/m3.d in order to allow the anammox
in
Fig. 3. Over the first 20 days, the model was operated at
bacteria to gradually adapt to SWW. The removal efficiency of NO2--N increased with
3
aoperation
low loading
rate
kgremoval
NH4+-N/m
.d was
in order
toonallow
time, from
theof
first0.25
day the
efficiency
22% and
the 20th day the
the
anammox
to 41.78
gradually
to
SWW.
The NH4+-N
-N/l
removed.
The
average
removal
efficiency bacteria
was 52% with
mg NOadapt
2
removal efficiency of NO2--N increased with operation time,
from the first day the removal efficiency was 22% and on
the 20th day the removal efficiency was 52% with 41.78 mg
NO2--N/l removed. The average NH4+-N removal efficiency
was 37% after 20 days of operation with 18 mg NH4+-N/l
removed. At the same time, the amount of nitrate produced
was 1.8 mg NO3--N. This shows that the anammox bacteria
began to adapt to the wastewater.
When the loading rate of ammonium was increased
0.5 kg NH4+-N/m3.d on the 21st day, the NH4+ removal
efficiency was 25% and the NO2--N removal efficiency
was 27%. This indicated that the anammox bacteria cannot
adapt to new loads yet. After the loading rate increaset, the
processing efficiency increased markedly in the following
days shown by an adjustment of the NO2--N/NH4+-N ratio
March 2020 • Vol.62 Number 1
Vietnam Journal of Science,
Technology and Engineering
87
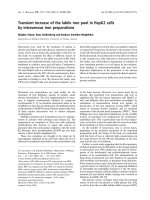
5
Fig. 3. Concentration of input and output nitrogen compounds of the EGSB tank.
The UASB/EGSB-anammox combined with PVA gel
Environmental Sciences | Ecology
in the range of 1.0-1.4 which created favourable conditions
for the anammox bacteria. After 20 days of operation at
an ammonium loading rate of 0.5 kg NH4+-N/m3.d, the
NH4+ removal efficiency was 64% and the NO2--N removal
efficiency was 70%. The amount of NO3--N generated was
about 8.8% compared to the amount of NH4+-N consumed,
which proves that the nitrate reduction process coexisted
with anammox process.
1.6
+
3
NO2 -/NH4+ ratio
removal efficiency was 37% after 20 days of operation with 18 mg NH4+-N/l removed.
thetheloading
ammonium
was
0.75
At the When
same time,
amount ofrate
nitrateofproduced
was 1.8 mg
NOincreased
that
3 -N. This shows
+ bacteria3 began to adapt to the wastewater.
thekg
anammox
NH -N/m .d, the treatment efficiency had a sharp decline
4
100
90
80
70
60
50
40
30
20
10
0
1.4
st
When the loading rate of ammonium was increased
0.5 kg NH4 -N/m .d on the 21
efficiency was
over
the first few days. The NH + removal
day, the NH4+ removal efficiency was 25% and the4 NO2--N removal efficiency was 27%.
-N
removal
efficiency
was
18%.
mainthe
39%
and
the
NO
This indicated that the anammox
bacteria cannot adapt to new loads The
yet. After
2
loading
the processing
efficiency
increased markedly
incould
the following
causerateofincreaset,
this situation
is that
the
annamox
bacteria
not
days shown by an adjustment of the NO2--N/NH4+-N ratio in the range of 1.0-1.4 which
adapt
to theconditions
suddenforchange
in load.
InAfter
the20following
days,
created
favourable
the anammox
bacteria.
days of operation
at an
+
3
thesteady
NH4+ removal
wasthe
64%
ammonium
loading rate
of 0.5 kg NHreached
the operating
conditions
state efficiency
whereby
4 -N/m .d, a
and the NO2--N removal efficiency was 70%. The amount of NO3--N generated was
removal
efficiency
increased
gradually.
On
the
last
day,
the
about 8.8% compared to the amount of NH4+-N consumed, which proves that the nitrate
performance
reached
57 andprocess.
69%, with 26 mg NH4+-N/l
reduction
process coexisted
with anammox
removed.
The 0.75
average
and
mg rate
NOof2--N/l
-N/m3.d, the
When30.5
the loading
ammonium
was increased
kg NH4+removal
+ The NH4+ removal
treatment
efficiency
had
a
sharp
decline
over
the
first
few
days.
performance at this load was 55% (NH4 -N) and 64%
was 18%. The main cause of this
efficiency- was 39% and the NO2--N removal efficiency
The
amount
of could
NO3not
-Nadapt
generated
was
about
5%In
(NO
situation2is-N).
that the
annamox
bacteria
to the sudden
change
in load.
+
thecompared
following days,
conditions
aconsumed.
steady state whereby the removal
-N
to the
theoperating
amount
of NHreached
4
efficiency increased gradually. On the last day, the performance reached 57% and 69%,
+
with 26In
mggeneral,
NH4+-N/l and
mg NONH
The average removal
2 -N/l removed.
-N concentration
was performance
134±5,
the30.5input
4
at this load was 55% (NH4+-N) and 64% (NO2--N). The amount of NO3-N generated was
130±8,
and
110±10
mg/l
for
ammonium
loading
rate of
+
about 5% compared to the amount of NH4 -N consumed.
1.2
1
0.8
0.6
0.4
0.2
0
Transformation (%)
PN: from Figs. 4 and 5 show that the 0.25 kg NH4+-N/m3.d loading rate of
ammonium, the input ammonium concentration was 126±10 mg/l. The ammonium
conversion efficiency was about 58%, and the NO2--N/NH4+-N ratio was 1.16±0.29. On
+
+ problems
day, the NOAfter
ratio decreased
to 0.75 because
the system
the 7threquired.
/NHhad
ratio
than
the problem,
the NO
2 /NH4 fixing
2
4
during
operation
making
the
conversion
rate
thfrom ammonium to
- nitrite+ lower than
increased gradually, and on the 14
day
the
NO
/NH
ratio
4
and on the
required. After fixing the problem, the NO2-/NH4+ ratio increased 2gradually,
was
ammonium
conversion
efficiency
of
64%.
+
th 1.32 with
14 day the NO2 /NH4 ratio was 1.32 with ammonium conversion efficiency of 64%.
Time course (day)
NO2-/NH4+ratio
Transformation performance (%)
+
Fig. 4. NO- 2-/NH
ratio in the survey process.
+ 4
Fig. 4. NO2 /NH4 ratio in the survey process.
After
increasing
the rate
loading
rate ofup ammonium
up 3to
.d, the
After increasing
the loading
of ammonium
to 0.5 kg NH4+-N/m
3
+
ammonium
conversion
efficiency
decreased
to 51%.conversion
The input ammonium
was 133±6
0.5
kg NH
-N/m
.d,
the
ammonium
efficiency
4
mg/l and the average
NO2-The
/NH4+ input
ratio wasammonium
about 1.25±0.12.was
On the
32nd day,
the ratio
decreased
to 51%.
133±6
mg/l
was 1.32. This ratio is the ideal
ratio. While the ratio in this period was
- theoretical
+
and
the average NO /NH4 inratio
was about 1.25±0.12.
relatively unstable most of the 2ratios were
the range of 1.0-1.4 which meant they were
nd
On
the
32
day,
the
ratio
was
1.32.
This ratio is the ideal
still suitable for the next process.
theoretical
therate
ratio
in this period
was relatively
On days 41ratio.
to 44, While
the loading
of ammonium
was increased
to 0.75 kg NH4+3
unstable
most oftothe
ratios
the showed
range that
of the
1.0-1.4
an HRT
of 4were
h. Theinresults
conversion
N/m .d corresponding
+
efficiencymeant
of ammonium
decreased
51%. Thefor
ratio
NO2-/NH
4 decreased to
which
they were
stilltosuitable
theof next
process.
0.9±0.07 because the sludge did not adapt to the change in loading rate. In the following
Efficiency (%)
Concentration(mg/l)
+
44,
the loading
rate
wasratio
days,On
the days
ratio of41
NOto
gradually.
On of
the ammonium
58th day, the highest
3
2 /NH
4 increased
.d, respectively,
the
0.25,
0.5,theand
NH4+-N/m
In general,
input0.75
NH4+-Nkg
concentration
was 134±5
mg/l, 130±8 mg/l,and
and 110±10
3 efficiency of 65%. The average ammonium
+
reached
1.34
with
an
ammonium
conversion
+
3
increased
to
0.75
kg
NH
-N/m
.d
corresponding
to
an
HRT
.d, respectively,
mg/l
for ammoniumtreatment
loading rate efficiency
of 0.25, 0.5, and
NH4 -N/m
4
ammonium
of0.75
thekgmodel
reached
37,
conversion efficiency was 58%.
and the ammonium treatment efficiency of the model reached 37%, 64%, and 55% of 4 h. The results showed that the conversion efficiency
64,
and
55%
respectively.
Nitrogen removal
efficiency: to
the 51%.
concentration
of inputofand
respectively.
+
of ammonium
decreased
The ratio
NOoutput
/NHnitrogen
2
compounds from the EGSB tank is shown in Fig. 5. Over the first 20 days,
the 4model
decreased
because
adapt
to
100
90
-N/m3not
.d, and
the removal
was operated to
with0.9±0.07
a low loading
rate of the
0.25sludge
kg NH4+did
+
90
80
the
change
in2 loading
rate. Inwith
theoperation
following
days,
theday,
ratio
of
efficiency
of NO
and NH4 increased
time. On
the first
the removal
80
70
th of NH + was about 42%.
35% and the removal
efficiency
efficiency
of +NO
2 was about gradually.
4
NO
/NH
increased
On
the
58
day,
the
highest
70
2
4
60
60
ratio reached 1.34 with an ammonium conversion efficiency 7
50
50
of 65%. The average ammonium conversion efficiency was
40
40
30
58%.
30
20
20
10
10
0
0
1
4
6 10 12 14 18 20 23 25 27 31 33 37 39 41 44 46 50 52 54 58 60
Time course (day)
Eff NH4+ (PN)
Eff NH4+ (EGSB)
Eff NO2- (PN)
Eff NO2- (EGSB)
Eff NO3-(PN)
Eff NO3- (EGSB)
%NH4+
%NO2-
Fig. 3. Concentration of input and output nitrogen compounds 6
of the EGSB tank.
The UASB/EGSB-anammox combined with PVA gel
PN: from Figs. 4 and 5 show that the 0.25 kg NH4+-N/m3.d
loading rate of ammonium, the input ammonium
concentration was 126±10 mg/l. The ammonium conversion
efficiency was about 58%, and the NO2--N/NH4+-N ratio was
1.16±0.29. On the 7th day, the NO2-/NH4+ ratio decreased to
0.75 because the system had problems during operation
making the conversion rate from ammonium to nitrite lower
88
Vietnam Journal of Science,
Technology and Engineering
Nitrogen removal efficiency: the concentration of input
and output nitrogen compounds from the EGSB tank is shown
in Fig. 5. Over the first 20 days, the model was operated with
a low loading rate of 0.25 kg NH4+-N/m3.d, and the removal
efficiency of NO2- and NH4+ increased with operation time.
On the first day, the removal efficiency of NO2- was about
35% and the removal efficiency of NH4+ was about 42%.
On the 6th day, the removal efficiency of NO2- increased to
51% and the removal efficiency of NH4+ increased to 56%.
On the 7th day, the removal efficiency of NO2- unexpectedly
dropped to 32.6% and the removal efficiency of NH4+ was
about 35% because the NO2-/NH4+ ratio was 0.75. After
fixing a problem in the PN tank, the NH4+ and NO2- treatment
efficiency increased gradually and became relatively stable.
The average processing efficiency was about 55% for NH4+
and 55% for NO2-. At the same time, the production of NO3was about 6.4% of the influent NH4+.
March 2020 • Vol.62 Number 1
Concentration (mg/l)
On the 6th day, the removal efficiency of NO2- increased to 51% and the removal
efficiency of NH4+ increased to 56%. On the 7th day, the removal efficiency of NO2unexpectedly dropped to 32.6% and the removal efficiency of NH4+ was about 35%
because the NO2-/NH4+ ratio was 0.75. After fixing a problem in the PN tank, the NH4+
and NO2- treatment efficiency increased gradually and became relatively stable. The
average processing efficiency was about 55% for NH4+ and 55% for NO2-. At the same
time, the production of NO3- was about 6.4% of the influent NH4+.
90
100
80
90
Environmental Sciences | Ecology
mg NO2--N/l removed.
Conclusion
80
70
60
+
4
+
4
3
3
+
4
2
Efficiency (%)
The UASB/EGSB-anammox system was applied
to treat SWW. HRTs were surveyed from 12, 6, and 4 h,
60
50
and the ammonium removal efficiencies were 37, 64, and
50
40
55%, respectively. The nitrite removal efficiencies were 52,
40
30
30
69, and 64%, respectively. The PVA gel added during the
20
20
second phase of the model showed an increase in pollution
10
10
handling and model stability when operating at high loading
0
0
rates. The ammonium removal efficiencies were 56, 68, and
1 4 6 10 12 14 18 20 23 25 27 31 33 37 39 41 44 46 50 52 54 58 60
Time course (day)
60% for HRTs of 12, 6, and 4 h, respectively, and nitrite
Eff NH (PN)
Eff NH (EGSB)
Eff NO - (PN)
Eff NO - (EGSB)
removal efficiencies were 55, 77, and 73%, respectively.
Eff NO - (PN)
Eff NO - (EGSB)
%NH removed
%NO - removed
This research model can be adapted to higher loads in order
Fig. 5.
of input
output
nitrogen
compounds
EGSB tank.
Fig.
5.Concentration
Concentration
of and
input
and
output
nitrogenof compounds
of EGSB
tank. the loading rate of ammonium to 0.5 kg NH +-N/m3.d, the removal to assess its ability to handle critical conditions.
When increasing
70
2
2
4
efficiency of NO2- and NH4+ was relatively stable. After 20 days of operation, the highest
The authors declare that there is no
When
increasing
loading
of ammonium
to 0.5
removal
efficiency
value was the
reached
on day17,rate
with 73%
for NH4+-N removal
and 81%
3 The average NH +-N removal efficiency was -about 68% and
+ removal.
+ the regarding the publication of this article.
-N
for
NO
kg NH2 4 -N/m .d, the removal
efficiency of NO2 and NH4
4
efficiency
the last 5 the
days highest
of this period,
average
NO2--N removal
was
relatively
stable.
Afterwas
20about
days77%.
of Over
operation,
the output of ammonium nitrogen was approximately 14±0.56 mg/l. The amount of NO3- REFERENCES
+
removal
value
wasNH
reached
on day17, with 73%
N produced efficiency
was about 5% of
the influent
4 .
conflict of interest
+
+
3
for The
NHloading
-N rate
removal
andwas
81%
for toNO
removal.
The
[1] P.K. Lieu, et al. (2005), “Single-stage nitrogen removal using
of ammonium
increased
0.752 -N
kg NH
4
4 -N/m .d. On the first
+
+
was 62% andwas
the removal
of NH
was
day, the removal
of NO2efficiency
average
NH4 efficiency
-N removal
aboutefficiency
68% and
the
anammox and partial nitriteation (SNAP) for treatment of synthetic
4
- following days, the removal performance increased slowly. On the
40%. Then,NO
over the
average
-N removal efficiency was
about 77%. Over landfill leachate”, Japanese Journal of Water Treatment Biology,
+
2
54th day, the effect reached a steady state, and the NH4 -N removal efficiency was about
the
5 days
this efficiency
period, was
the about
output
removal
74%.ofOnammonium
the last day, the 41(2), pp.103-112.
61% last
and the
NO2--Nof
performancewas
reached
63% NH4+-N removal
and 75%
NO2-NThe
removal,
with 24.0
nitrogen
approximately
14±0.56
mg/l.
amount
of mg
[2] M. Strous, et al. (1997), “Ammonium removal from
+
and
46 mg NO2was
-N/l removed.
NH4+-N/l
NO
-N
produced
about
5%
of
the
influent
NH
.
3
4
concentrated waste steams with anaerobic ammonium oxidation
The loading rate of ammonium was increased to 0.75
kg NH4+-N/m3.d. On the first day, the removal efficiency of
NO2- was 62% and the removal efficiency of NH4+ was 40%.
Then, over the following days, the removal performance
increased slowly. On the 54th day, the effect reached a
steady state, and the NH4+-N removal efficiency was about
61% and the NO2--N removal efficiency was about 74%. On
the last day, the performance reached 63% NH4+-N removal
and 75% NO2--N removal, with 24.0 mg NH4+-N/l and 46
8 (annamox)
process in different reactor configurations”, Water Res.,
31(8), pp.1955-1962.
[3] M.C. Schmid, et al. (2007), “Anaerobic ammonium-oxidizing
bacteria in marine environments: widespread occurrence but low
diversity”, Environ. Microbiol., 9(6), pp.1476-1484.
[4] A.O. Sliekers, et al. (2003), “Canon and anammox in a gas-lift
reactor”, FEMS Microbiology letters, 218(2), pp.339-344.
[5] />
March 2020 • Vol.62 Number 1
Vietnam Journal of Science,
Technology and Engineering
89