Transciptome profiling at early infection of Elaeis guineensis by Ganoderma boninense provides novel insights on fungal transition from biotrophic to necrotrophic phase
Bạn đang xem bản rút gọn của tài liệu. Xem và tải ngay bản đầy đủ của tài liệu tại đây (8.83 MB, 25 trang )
Bahari et al. BMC Plant Biology
(2018) 18:377
/>
RESEARCH ARTICLE
Open Access
Transciptome profiling at early infection of
Elaeis guineensis by Ganoderma boninense
provides novel insights on fungal transition
from biotrophic to necrotrophic phase
Mohammad Nazri Abdul Bahari1†, Nurshafika Mohd Sakeh1†, Siti Nor Akmar Abdullah1,2* ,
Redzyque Ramza Ramli1 and Saied Kadkhodaei3
Abstract
Background: Basal stem rot (BSR) caused by hemibiotroph Ganoderma boninense is a devastating disease resulting
in a major loss to the oil palm industry. Since there is no physical symptom in oil palm at the early stage of G.
boninense infection, characterisation of molecular defense responses in oil palm during early interaction with the
fungus is of the utmost importance. Oil palm (Elaeis guineensis) seedlings were artificially infected with G. boninense
inoculums and root samples were obtained following a time-course of 0, 3, 7, and 11 days-post-inoculation (d.p.i)
for RNA sequencing (RNA-seq) and identification of differentially expressed genes (DEGs).
Results: The host counter-attack was evidenced based on fungal hyphae and Ganoderma DNA observed at 3 d.p.i
which became significantly reduced at 7 and 11 d.p.i. DEGs revealed upregulation of multifaceted defense related
genes such as PR-protein (EgPR-1), protease inhibitor (EgBGIA), PRR protein (EgLYK3) chitinase (EgCht) and expansin
(EgEXPB18) at 3 d.p.i and 7 d.p.i which dropped at 11 d.p.i. Later stage involved highly expressed transcription
factors EgERF113 and EgMYC2 as potential regulators of necrotrophic defense at 11 d.p.i. The reactive oxygen
species (ROS) elicitor: peroxidase (EgPER) and NADPH oxidase (EgRBOH) were upregulated and maintained
throughout the treatment period. Growth and nutrient distribution were probably compromised through
suppression of auxin signalling and iron uptake genes.
Conclusions: Based on the analysis of oil palm gene expression, it was deduced that the biotrophic phase of
Ganoderma had possibly occurred at the early phase (3 until 7 d.p.i) before being challenged by the fungus via
switching its lifestyle into the necrotrophic phase at later stage (11 d.p.i) and finally succumbed the host. Together,
the findings suggest the dynamic defense process in oil palm and potential candidates that can serve as phasespecific biomarkers at the early stages of oil palm-G. boninense interaction.
Keywords: Early defense, Elaeis guineensis, Ganoderma boninense, Necrotrophic, Pathogenesis-related protein,
Transcription factor
* Correspondence:
†
Mohammad Nazri Abdul Bahari and Nurshafika Mohd Sakeh contributed
equally to this work.
1
Institute of Plantation Studies, Universiti Putra Malaysia, 43400 UPM,
Serdang, Selangor, Malaysia
2
Faculty of Agriculture, Universiti Putra Malaysia, 43400 UPM, Serdang,
Selangor, Malaysia
Full list of author information is available at the end of the article
© The Author(s). 2018 Open Access This article is distributed under the terms of the Creative Commons Attribution 4.0
International License ( which permits unrestricted use, distribution, and
reproduction in any medium, provided you give appropriate credit to the original author(s) and the source, provide a link to
the Creative Commons license, and indicate if changes were made. The Creative Commons Public Domain Dedication waiver
( applies to the data made available in this article, unless otherwise stated.
Bahari et al. BMC Plant Biology
(2018) 18:377
Background
Oil palm (Elaeis guineensis Jacq. Dura x Pisifera) is one
of the main plantation crops in Malaysia and Indonesia
and together these two countries contribute about 85 to
90% of global export [1, 2]. Palm oil which is recognised
as one of the major sources of edible oil also serves as
feedstock for oleochemicals and precursor for biodiesel
fuel [3, 4]. The total export earnings from palm oil and
palm oil products in Malaysia was reported at nearly
USD18.5 billion [5]. Despite the huge export revenue
from this commodity, oil palm plantation is facing major
predicament due to basal stem rot (BSR) disease which
hampers the oil palm production massively. BSR has
been reported as a major threat in oil palm industry for
over eight decades. It was estimated that in 2020, a total
area of 443,430 ha or 65.6 millions of palm trees will be
affected [6]. BSR is mainly caused by fungal infection on
intact oil palm roots wherein the most prevalent species
discovered was Ganoderma boninense [7–9]. BSR infects
not only mature oil palm trees but also seedlings and
younger plants where manifestation of the disease occurs
earlier and more severe [8]. BSR is manifested by progressive decay of roots that disrupts water and nutrient
transport to the upper part of mature oil palm trees
which concomitantly will bring about frond wilting, yellowing of frond, un-opening of spear leaves and eventually resulting in stand collapse [10]. Regrettably,
BSR-infected oil palms are symptomless during early
stage of infection with the earliest symptom often observed on foliage when infection has progressed by 60–
70% [11]. Once young oil palm plants show symptom of
the disease they usually die within 1 or 2 years, while
mature trees can survive for only another 3 or so years
[12]. Thus, studies on early defense response are not just
time and cost effective but provide insightful information on initiation of defense signaling networks upon
recognition of pathogen.
Ganoderma spp. has been categorised as hemibiotrophs, with intermediate lifestyle of biotrophs and
necrotrophs. Early stage of infection is the biotrophic
phase whereby colonization of fungal on intact host
plant cells takes place before initiating necrotrophic
phase that involves extensive cell wall degradation [11].
Biotrophs survive by maintaining intact host cells for
nutrient uptake, whilst necrotrophs involve killing of
plant cells to infect and survive saprotrophically. Biotrophic infection is common during early interaction
with pathogens whereby plant counteracts by enhancing
production of reactive oxygen species (ROS) through an
oxidative burst [13]. Consequently, plant executes programmed cell death (PCD) to restrict pathogen growth.
This phenomenon is a form of hypersensitive response
(HR) in which plant promotes cell death at and around
the infection site [14]. Biotrophs utilize small amounts
Page 2 of 25
of cell wall degrading enzymes (CWDEs) to allow softening and loosening of cell wall without causing lethal effect to host cells [15]. Early defense response is also
highly related to enhanced lignification of cell walls by
plant to combat localized and controlled degradation of
the cell wall by biotrophic fungi [16]. It is one of the
strategies that plants employ to prevent penetration of
pathogen’s toxins through cell wall degradation by
CWDEs [17].
Regrettably, HR only induces transition of biotrophic
to necrotrophic stage. Necrotrophs invade host tissues
by extensively secreting CWDEs. The accessibility of
CWDEs on cell wall is achieved by perception of necrotrophs to subvert host cell wall modification [18]. For instance, coactions of expansin and polygalacturonase
which facilitate cell wall loosening were induced upon
successful infection of necrotrophic pathogen Botrytis
cinerea on Solanum lycopersicum [19]. Necrotroph also
produces expansin-like protein to mediate penetration of
hyphae [20]. Expansin-like protein provides protection
for the hemibiotrophs, Fusarium graminearum from
plant enzymatic degradation [21]. It has been postulated
that biotrophic colonization is obligatory for hemibiotrophs to mediate successful infection while the
time-period for switching from biotrophy to necrotrophy
varies between pathogenic species [22]. Having intermediate lifestyle, hemibiotrophs may first overcome
plant defense response during early colonization and
subsequently deploy a more aggressive mode of attack
for successful infection [23].
Studies on early interactions of plant-pathogens are
crucial to allow screening for detection of potential
threat of BSR especially on young palms. The present
study attempts to investigate gene expression patterns in
susceptible progeny of commercial oil palm (Dura x
Pisifera) at early stages of G. boninense infection using
high-throughput bioinformatics data (RNA-seq) via next
generation sequencing (NGS) method. Despite the existence of a resistant variety (Zaire x Cameroon) [24], we
decided to use the commercialized susceptible variety as
it is vastly planted in oil palm plantations because this
hybrid produces better yield performance compared to
their parents [25, 26]. Previous study from our laboratory [27] using similar method and condition of treatment reported induced production of metabolites with
anti-fungal properties in oil palm seedlings during early
interaction (within a week of infection) with G. boninense suggesting activation of early defense responses in
the host plant. Based on marker genes reported on biotrophs and necrotrophs, our study was able to differentiate the biotrophic stage before switching to necrotrophic
phase which occurs later. The present work differs from
previous reported studies which covered the later stages
at three weeks post inoculation onwards [28, 29]. This
Bahari et al. BMC Plant Biology
(2018) 18:377
work will enable a more complete understanding of oil
palm defence response and is important for potentially
early intervening strategies to protect the plant from severe infection.
Results
Preliminary screening of early defense response in G.
boninense-infected oil palm roots
Eighty-four of 4-month-old oil palm seedlings were divided into two treatments which were inoculation with
bare RWB (no fungal inoculum) as mock treatment (T0)
and inoculation with RWB fully colonised with G. boninense (T1). Artificial infection of oil palm seedlings with
G. boninense was performed via sitting-technique to
mimic the mode of Ganoderma spp. infection through
root contact with fungal mycelia [27]. T0 and T1 samples
were harvested at 3, 7 and 11 d.p.i. while untreated seedlings were used as control. Our preliminary screening via
real-time quantitative PCR (qPCR) of transcriptional regulation in oil palm-G. boninense interaction showed two
distinct phases of fungal attack suggesting early (3 d.p.i)
and later (11 d.p.i) defense mechanisms (Fig. 1). The expression of pathogenesis-related protein 1 (PR-1) and
transcription factor MYC2 (MYC2) genes, which are common genetic biomarkers for biotic stress were analysed
[30–34]. EgPR1 was highly expressed during the early
phase of infection at 3 and 7 d.p.i before subsequently reduced at 11 d.p.i. Whereas EgMYC2 showed highest gene
expression during later phase of infection at 11 d.p.i.
Based on the preliminary screening, we suggested that
there are two plausible phases of defense response primed
by oil palm expressing at very early (3 d.p.i) and later (11
d.p.i) interaction with G. boninense. Hence, the same
batch of root samples harvested at the time points (3, 7
and 11 d.p.i) were used for further transcriptomic analysis
through high throughput NGS.
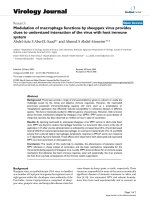
Scanning electron microscopy and PCR using Ganodermaspecific primers performed on artificially infected oil palm
roots
Scanning electron microscopy on the outer layer of oil
palm roots revealed differences in morphology between
control and T1 samples. The superficial layer of control
samples was intact and healthy, whilst the cell walls of
Ganoderma-treated (T1 samples) were observed to be
shrunken with uneven shape that showed symptoms of
necrosis or apoptosis as early as 3 d.p.i (Fig. 2). The fungal
hyphae network was undetected on control samples while
surprisingly thick multilayers of fungal hyphae was present
on the surface of 3 d.p.i roots but significantly reduced on
root samples harvested at 7 and 11 d.p.i.
The presence of G. boninense DNA in oil palm roots at 3,
7 and 11 d.p.i of T1 samples was further validated by PCR
using Ganoderma-specific PCR primers. Primers of G.
Page 3 of 25
boninense DNA were retrieved from Genebank (accession
number KM015454.1) from sequence of G. boninense strain
PER71 internal transcribed spacer 1 (ITS1), partial sequence; 5.8S ribosomal RNA gene, complete sequence; and
internal transcribed spacer 2 (ITS2), partial sequence with
the expected product length of 223 bp size. The gel electrophoresis image in Fig. 3 shows concentrated and clear band
on lane T1D3 (normal PCR for 3 d.p.i root sample). Bands
of amplicons were not detected on normal PCR for 7 and
11 d.p.i. root samples. Hence, nested PCR was performed
using both 7 and 11 d.p.i samples to validate any trace
amount of Ganoderma sp. DNA. Nested primers were generated from sequenced PCR product of 3 d.p.i sample and
the resulting amplicon length was decreased to 102 bp.
Nested PCR (Fig. 3) resulted in faint bands for both root
samples of 7 d.p.i (lane T1D7n) and 11 d.p.i (T1D11n). No
band was detected from untreated control (lane C) sample.
The alignment of original G. boninense ITS1/2 sequence
with sequenced amplicon of normal and nested PCR
showed conserved sequence which confirmed that G.
boninense fungal hyphae was present in all T1 samples
(Additional file 1). Furthermore, homology searches of the
sequenced amplicon with biological sequences in GenBank
matched only with Ganoderma sp. sequences with ≥95%
identity. Consistent with the microscopic data, it was confirmed that G. boninense hyphae at 3 d.p.i was abundant
whilst much reduced in 7 and 11 d.p.i.
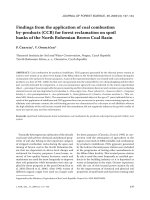
Observation on extended period of infection resulted in
wilted leaves and emergence of fruiting body (basidiomata) at the bole of the T1 samples at the 24th week post
inoculation, indicating a well-established necrotrophic infection (Fig. 4). An excised bole of the plant showed a
decayed region indicating symptoms of necrosis while uninfected plant was healthy without G. boninense mass or
necrotic lesions. Based on the observation of fungal hyphae on the outer layer of infected oil palm roots, the
thick hyphae multilayers on 3 d.p.i which significantly
dropped at 7 and 11 d.p.i raised possibilities that the fungus had been weakened by the plant. However, emergence
of basidiomata at chronic infection proved that the plant
finally succumbed to the disease, thus it shows that the
drop of fungal hyphae at early interaction (within the
treatment period) is not an indicator that the plant had
overcome the fungal threats. We hypothesize that the
switching to a more aggressive mode of attack by the fungus plays a critical role. Hence, we profiled transcriptomes
of oil palm roots during interactions with G. boninense at
3, 7, and 11 d.p.i. to test the hypothesis.
Transcriptomes of oil palm root during interactions with
G. boninense at 3, 7, and 11 d.p.i
Biologically averaged samples are commonly practised in
RNA-seq where pooled RNA samples, like in the present
study from six oil palm seedlings were sequenced instead
Bahari et al. BMC Plant Biology
(2018) 18:377
Page 4 of 25
Fig. 1 Preliminary screening of EgPR1 and EgMYC2 gene expression in G. boninense-infected oil palm roots. Histogram shows relative expressions
of a pathogenesis-related protein 1 (EgPR1) and b transcription factor MYC2 (EgMYC2) genes at 3, 7, and 11 days-post-inoculation (d.p.i) compared
to untreated control (c). The expressions of each gene were normalized by reference genes; GAPDH 2, NADH 5 and ß-actin expression levels. Data
are expressed as the mean ± SEM of three individual technical replicates of each sample. Preliminary screening by qPCR was carried out on
control and treated (T0 and T1) samples in two biological replicates (1 and 2). Each replicate consisted of pooled root from six plants. * P < 0.01 is
significantly differed compared to corresponding control as assessed by one-way ANOVA analysis followed by Tukey’s test. ns is not significant.
Different superscript letters between samples (within replicate) indicate significant different (P < 0.01) in mean values. RWB: Rubber wood block
of individual samples. Biological averaging is not only
cost efficient compared to mathematical averaging, but
this method also could reduce the high biological variability which may be present among individual samples
and raise the capability to detect differential gene expression between groups [35, 36].
The RNA-seq generated 227,658,752 paired-end reads
from the pooled two biological replicates of control, whilst
the pooled biological replicates from 3, 7, and 11 d.p.i produced 227,400,216, 207,826,416 and 191,359,826 paired-end
reads, respectively (Table 1) denoting that the pool of
mRNAs in T1 samples decreased over time. Quality of the
Bahari et al. BMC Plant Biology
(2018) 18:377
Page 5 of 25
A
B
C
D
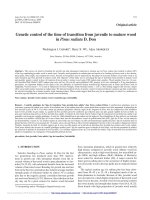
Fig. 2 Scanning electron microscopy (SEM) of control and T1 oil palm roots with Ganoderma boninense. Root of samples were imaged at
different days of post inoculation (d.p.i): (a) 0 d.p.i, (b) 3 d.p.i, (c) 7 d.p.i and (d) 11 d.p.i
mRNA fragments from both biological replicates was measured using FastQC (Fig. 5a and b). An overview of quality
values across all bases showed that the mean quality (blue
line) for each base position lies in very good quality calls
(green) region within the range of 28–38 quality scores. Furthermore, the quality score distribution graph showed that
the highest number of sequences had mean sequence quality
of 37. These paired-end reads were mapped to E. guineensis
reference genome using Geneious for RNA-seq tool in the
Geneious package. The percentages of mapped reads from
samples were in the range of 54.14–60.21% with an average
of 57.4%.
Gene expression levels were calculated for each sample
using transcript counts and presented in TPM unit [37].
Transcript counts is recommended in calculating the expression level of genes instead of reads or fragment counts since
Fig. 3 PCR amplification of Ganoderma species DNA using specific primer pairs of Ganoderma species. Lane C: uninoculated control; Lane T1D3:
normal PCR for 3 d.p.i; Lane T1D7n: nested PCR for 7 d.p.i; lane T1D11n: nested PCR for 11 d.p.i; +VE: normal PCR for pure Ganoderma culture. The
amplicon size for T1D3 and + VE are 223 bp whilst T1D7n and T1D11n amplicon size are 102 bp
Bahari et al. BMC Plant Biology
(2018) 18:377
Page 6 of 25
Fig. 4 Signs and symptoms of Ganoderma boninense infection on oil palm seedlings. (a) healthy plant (uninfected) at 24 weeks after inoculation.
(b) Appearance of G. boninense basidiomata on T1 oil palm stem base at 24 weeks after inoculation. (c) Stem base section of untreated control
and (d) necrotic lesion (black arrows) in stem base of T1 oil palm at 24 weeks after inoculation
a single transcript can consists of multiple reads or fragments
and yet they are not independent. Hence the accuracy of significance values is questionable. Normalization of transcript
counts were performed using ‘Median of Gene Expression
Ratios’ procedure which is identical to DESeq method [38].
Difference in transcriptomic expression of individual
sequences between control and T1 samples at different
time frames was searched via comparing their transcripts
expression level to identify DEGs. A given gene is considered as DEGs if its expression difference complies to
Table 1 Summary of NGS data of T1 samples
Replicate
Sample
1
Control
115,806,338
47,978,266 (41.50%)
67,828,072 (58.50%)
68,042,571
50.4
3 d.p.i
116,036,532
48,074,890 (43.17%)
63,288,794 (56.83%)
63,473,939
50.3
7 d.p.i
99,856,770
45,959,348 (46.03%)
62,010,298 (53.97%)
62,204,733
49.0
11 d.p.i
96,334,214
39,143,968 (40.63%)
55,881,644 (59.37%)
56,049,226
49.9
2
Paired-end clean reads (fwd + rev)
Unmapped reads (%)
Mapped reads (%)
Contigs
GC (%)
Control
111,852,414
47,513,392 (42.48%)
64,339,022 (57.52%)
64,545,409
50.1
3 d.p.i
111,363,684
50,771,616 (45.59%)
65,264,916 (54.41%)
65,460,036
49.6
7 d.p.i
107,969,646
42,963,067 (39.79%)
56,893,703 (60.21%)
57,072,615
48.8
11 d.p.i
95,025,612
39,734,017 (41.81%)
56,600,197 (58.19%)
56,777,437
49.3
Bahari et al. BMC Plant Biology
(2018) 18:377
Page 7 of 25
A
B
Fig. 5 Per base sequence quality of samples generated by FASTQC. Yellow boxes demonstrated base-calling quality scores across all (a) replicate
1; and (b) replicate 2 sequencing reads
the cut-off values of log2 FC ≥ |1.0| and P-value < 0.01.
All DEGs were clustered into upregulated and downregulated based on positive and negative values of log2 FC
respectively. As depicted in Fig. 6, the number of unigenes of downregulated genes (4754 DEGs) was
1.25-fold higher than upregulated genes (3802 DEGs).
Among the upregulated genes, the highest number of
DEGs was from 3 d.p.i. whereas the highest number of
DEGs in downregulated genes was from 7 d.p.i. Based
on observations for genes in common (overlapped region), both groups showed that the overlapping region
between 3 d.p.i and 7 d.p.i had the highest number of
DEG unigenes, followed by the overlapping between 7
d.p.i and 11 d.p.i. The lowest number of genes found in
common was between 11 d.p.i and 3 d.p.i.
The upregulated and downregulated gene sequences
were used to align with similar biological sequences
using Basic Local Alignment Search Tool (BLAST) in
database via the CloudBlast tools in Blast2GO. Top-hit
species distribution revealed the best-aligned gene
annotations of related plants with highest percentage of
similarity and lowest e-value. With restriction to 20 blast
hits and e-value cut-off of 1.0 × 10− 3, the most top-hit
species was Elaeis guineensis with close to 9000 top-hits
for upregulated genes and 15,000 top-hits for downregulated genes (Additional file 2). Phoenix dactylifera (date
palm), and Elaeis oleifera (American oil palm) appeared
as the second and third highest homolgy with maximum
of ~ 150 top-hits. P. dactylifera is a close relative to E.
guineensis, while E. oleifera is under the same genus
Elaeis (tribe Cocoseae) in the family Arecaceae. The
DEGs were annotated for Gene Ontology (GO) terms
using Blast2Go Pro software. Fig. 7a and b show top 20
GO distribution (by level 3) by number of sequences of
upregulated and downregulated DEGs respectively,
which were categorized into biological process, molecular function, and cellular component. A single sequence
could be present in more than one GO terms. Supplementary data showing statistics generated from blast and
annotation method via Blast2Go Pro for quality control
Bahari et al. BMC Plant Biology
(2018) 18:377
Page 8 of 25
Fig. 6 Venn Diagram of differentially-expressed genes in root of inoculated samples compared to uninoculated control samples. Genes were considered
significantly upregulated or downregulated when their expression differences meet the cut-off values of fold change log2 ≥ |1.0| and P-value < 0.01
are available in Additional files 3 and 4 including annotation distribution, E-value distribution, sequence similarity distribution, and number of sequences with length.
The list of the top 20 GO of all categories was similar between upregulated and downregulated DEGs with exceptions
for several terms. Furthermore, it was unsurprising to note
that the number of downregulated DEGs were higher than
the number of upregulated DEGs. However, ‘protein complex’, ‘non-membrane-bounded organelle’, and ‘external encapsulating structure’ from cellular component category
have higher number of sequences in upregulated than downregulated DEGs. The majority of biological process GO
terms either from upregulated or downregulated DEGs were
related to various metabolic processes, while other possible
defense-related GO terms include ‘response to stress’, ‘cell
wall organization or biogenesis’, ‘biosynthetic process’, and
‘signal transduction’. Besides, molecular function GO terms
exhibited multiple binding functions towards cyclic compounds, ions, proteins, enzymes, and metabolic substances.
Different types of enzyme activities like transferase, hydrolase, oxidoreductase, lyase, isomerase, and ligase were also
observed under this category. ‘Peroxidase activity’ from upregulated DEGs was not listed under downregulated DEGs
for the top 20 GO terms, thus it showed that there was significant difference in the number of sequences from this enzyme function between upregulated and downregulated
genes. The top 20 GO terms from cellular component category were related to intracellular parts, membranes and its
components, spatially distinct organelles, ‘external encapsulating structure’, and ‘protein complex.
Enriched GO terms of upregulated and downregulated
DEGs at 3, 7, and 11 d.p.i
Subsequently, Gene Set Enrichment Analysis (GSEA) was
performed using Blast2GO Pro to discover enriched GO
terms in biological systems of oil palm during G. boninense
colonization represented by DEGs. The P-values of differential gene expression between T1 and control samples
were adopted as numerical values for each functionally annotated DEGs to create a ranked list for enrichment analysis with cut-off value of 0.01. GSEA was performed at 3,
7, and 11 d.p.i in order to deduce oil palm defense management strategies at different time intervals during early interaction with the hemibiotroph. Regardless of GO category,
analysis on upregulated and downregulated DEGs at 3, 7,
and 11 d.p.i showed 23, 27, and 33 (upregulated) while 94,
96 and 77 (downregulated) enriched GO terms, respectively. Significant changes in gene expression in the host
plant were observed at different time intervals of early interactions. Despite susceptible-type of oil palm seedlings
were used, enormous genes involved in defense-related processes were upregulated and downregulated during interaction with G. boninense. The selected enriched GO terms
of upregulated and downregulated genes were listed in
Table 2 and Table 3 respectively. Seventy-two hours (3
d.p.i) of interactions between the host and hemibiotroph revealed enriched GO terms involved in response to stress,
hormone-mediated signaling pathway, auxin-signaling and
cation binding. Response to stress was also enriched in upregulated genes at 7 d.p.i, beside other terms such as mitotic cell cycle process, O-acyltransferase activity, kinesin
complex and cytoplasmic vesicle. Whereas after 11 days of
inoculation, significant upregulation of genes involved in
oxidation-reduction process, acyl transferase activity, movement of cell or subcellular component was observed. Besides the upregulated genes, the oil palm orchestrated
significant attenuation of gene expression in response to
fungal threat. In downregulated genes, ion transport, autophagy, signalling receptor activity and regulation of
localization GO terms were enriched throughout the time
Bahari et al. BMC Plant Biology
(2018) 18:377
Page 9 of 25
A
B
Fig. 7 Gene Ontology (GO) functional categorization of differentially-expressed genes (DEGs). The bar charts represent top 20 GO distribution by
number of sequences of (a) upregulated and (b) downregulated DEGs in T1 samples of oil palm roots during early interaction (3, 7, and 11 d.p.i)
with Ganoderma boninense compared to untreated control
points. Transcription factors activity for sequence-specific
DNA binding and response to chemical were significantly
affected at 7 and 11 d.p.i. Carbohydrate transport, oxidoreductase activity, organelle fusion, monooxygenase activity
and symporter activity were enriched at 3 d.p.i. Catabolic
process, vesicle-mediated transport, integral component of
plasma membrane were enriched at 7 d.p.i. Whereas, regulation of metabolic process, aromatic compound biosynthetic process and developmental process were enriched at
11 d.p.i.
Significant changes of gene expressions involved in
defense response, cell wall modification, growth, and
metabolism in the host plant
Analysis on differential expression of individual genes subset to the enriched GO terms has paved the way to observation of clusters of defense-related oil palm genes which
either been activated or attenuated during interaction with
G. boninense. Fold change of gene expression in T1 samples compared to control was applied to compute heatmap of selected significantly-expressed (P-value < 0.01)
Bahari et al. BMC Plant Biology
(2018) 18:377
Page 10 of 25
Table 2 Enriched GO terms of upregulated DEG unigenes of T1 samples compared to untreated control
3 d.p.i
7 d.p.i
11 d.p.i
Biological Process
GO:0006950
response to stress
GO:0006950
response to stress
GO:0055114
oxidation-reduction process
GO:0009755
hormone-mediated signaling
pathway
GO:0030243
cellulose metabolic process
GO:0009888
tissue development
GO:0060918
auxin transport
GO:1903047
mitotic cell cycle process
GO:0006811
ion transport
GO:0010817
regulation of hormone levels
GO:0030154
cell differentiation
GO:0051704
multi-organism process
GO:0030001
metal ion transport
GO:0051704
multi-organism process
GO:0007010
cytoskeleton organization
GO:0048646
anatomical structure formation
involved in morphogenesis
Molecular Function
GO:0016651
Oxidoreductase activity,
acting on NAD(P)H
GO:0046872
metal ion binding
GO:0046872
metal ion binding
GO:0010487
thermospermine synthase
activity
GO:0008374
O-acyltransferase activity
GO:0043169
cation binding
GO:0048037
cofactor binding
GO:0010487
thermospermine synthase activity
GO:0043169
cation binding
GO:0050662
coenzyme binding
GO:0016746
transferase activity, transferring
acyl groups
GO:0006928
movement of cell or subcellular
component
GO:0044446
intracellular organelle part
Cellular Component
GO:0005829
cytosol
GO:0005871
kinesin complex
GO:0031410
cytoplasmic vesicle
genes as shown in Fig. 8. Defense-related genes were the
most affected by the host-fungus interaction whereby
pathogenesis-related protein 1-like (EgPR-1), Glu S.griseus
protease inhibitor-like (EgBGIA) and chitinases (EgCht)
were significantly upregulated at 3 and 7 d.p.i and showed
decreased in upregulation at 11 d.p.i compared to control.
Other PR genes like germin-like proteins (EgGLP) and peroxidases (EgPER, an ROS scavenger) were both significantly upregulated and downregulated throughout the
time points. Components of pattern-triggered immunity
(PTI) signalling were shown to be significantly adjusted
whereby lysM domain receptor-like kinase 3 (EgLYK3),
pattern recognition receptor (PRR) protein which is involved in perception of fungal-derived chitin molecule
also known as pathogen- or damage-associated molecular
patterns (PAMP or DAMP), was found to be both upregulated and downregulated, but upregulated genes were
higher in term of fold-change compared to downregulated
genes. Other receptor-like kinases (RLKs) or receptor-like
proteins were involved either in surveillance of bacterial
PAMP or related to growth, reproduction, differentiation
and homeostasis processes. Another member of PTI signalling, calcium-dependent protein kinase 28 (EgCPK28)
was elevated at all time points.
As a mechanism to fortify the frontline barrier of defense
in oil palm, genes associated with formation of primary and
secondary cell wall and its modification were distinctively
regulated in oil palm during interaction with G. boninense.
The secondary cell wall biosynthetic genes, cellulose synthase
A catalytic subunits (EgCESA) and cellulose synthase-like
proteins (EgCSL) were only found in upregulated genes
throughout all time points. Expansins are protein that regulate loosening and extension of cell wall. It was observed that
both expansin A-like and expansin B-like were significantly
upregulated in this study. Interestingly, expansin-B18-like
(EgEXPB18) was outstandingly upregulated by 90- and
137-fold at 3 and 7 d.p.i respectively compared to the
control. Expression of a gene involved in cutin, suberin, and
wax biosynthesis, omega-hydroxypalmitate O-feruloyl
transferase-like was elevated at later stage (7 and 11 d.p.i).
Several genes involved in lipid metabolism were significantly downregulated. A gene encoding a lipolytic enzyme,
GDSL esterase/lipases 5 (EgGLIP5) showed the highest fold
downregulation (745-fold compared to control) at 3 d.p.i
and only slightly decreased from 7 to 11 d.p.i. Monogalactosyldiacylglycerol synthase 1 (EgMGD1) that catalyzes the
synthesis of a galactolipid, monogalactosyldiacylglycerol
(MGDG) was significantly downregulated by 3-fold. Auxin
cellular level, signalling and movement are critical for root
and shoot architecture, organ patterning and tissue differentiation. In our data, auxin-responsive proteins (EgIAA),
repressor proteins in auxin signalling were upregulated
Bahari et al. BMC Plant Biology
(2018) 18:377
Page 11 of 25
Table 3 Enriched GO terms of downregulated DEG unigenes of T1 samples compared to untreated control
3 d.p.i
7 d.p.i
11 d.p.i
Biological Process
GO:0008643
carbohydrate transport
GO:0006811
ion transport
GO:0006811
ion transport
GO:0016491
oxidoreductase activity
GO:0005984
disaccharide
metabolic process
GO:0019222
regulation of metabolic
process
GO:0006914
autophagy
GO:0006914
autophagy
GO:0009059
macromolecule biosynthetic
process
GO:0048284
organelle fusion
GO:0016192
vesicle-mediated
transport
GO:0006914
autophagy
GO:0016071
mRNA metabolic process
GO:0008380
RNA splicing
GO:1902589
single-organism organelle
organization
GO:0032879
regulation of localization
GO:0032879
regulation of localization
GO:0019438
aromatic compound
biosynthetic process
GO:0006887
Exocytosis
GO:1902456
regulation of stomatal
opening
GO:0032879
regulation of localization
GO:0006811
ion transport
GO:0042221
response to chemical
GO:0032502
developmental process
GO:0009056
catabolic process
GO:0042221
response to chemical
GO:0010817
regulation of
hormone levels
Molecular Function
GO:0022804
active transmembrane
transporter activity
GO:0038023
signaling receptor activity
GO:0010857
calcium-dependent
protein kinase activity
GO:0004497
monooxygenase activity
GO:0003700
transcription factor activity,
sequence-specific DNA binding
GO:0004872
receptor activity
GO:0038023
signaling receptor
activity
GO:0005516
calmodulin binding
GO:0003700
transcription factor activity,
sequence-specific DNA
binding
GO:0016705
oxidoreductase activity, acting on
paired donors, with incorporation
or reduction of molecular oxygen
GO:0051119
sugar transmembrane
transporter activity
GO:0005887
integral component of
plasma membrane
Cellular Component
GO:0044459
plasma membrane
part
whilst auxin response factor (EgARF), which mediates
auxin-dependent transcriptional activation was downregulated at all time points. Furthermore, positive regulators of
polar auxin efflux: putative auxin efflux carrier protein
(EgPIN) and protein kinase PINOID (EgPID) were both upregulated thus may cause low cellular auxin level in the infected oil palm roots.
Genes involved in biosynthesis of secondary metabolites
including flavonols, anthocyanidins, catechins and
proanthocyanidins were upregulated but genes that confer
biosynthesis of anthocyanins and fatty acid-derived secondary metabolites such as terpenes, terpenoids, and sphingolipids were downregulated. Furthermore, genes involved in
biosynthesis of phytohormones like ethylene, jasmonate,
L-ascorbate and gibberellin as well as their signalling
pathway were downregulated at all time points. However,
the downregulation was reduced at latter stage (11 d.p.i) for
most of their biosynthetic genes such as jasmonate allene
oxide cyclase 1, chloroplastic-like (EgAOC1) and
12-oxophytodienoate reductase 1-like (EgOPR1); ethylene
1-aminocyclopropane-1-carboxylate oxidase-like (EgACO);
L-ascorbate L-gulonolactone oxidase-like (EgGULO); and
ABA zeaxanthin epoxidase, chloroplastic-like (EgZEP).
Ion channels, multiple transport and carrier proteins for
water, sugar, heavy-metal, drugs, ATP and ADP were downregulated throughout the experiments signifying transport
of water and nutrients in oil palm was compromised during
G. boninense attack. Nevertheless, a bHLH transcription
factor FER-LIKE IRON DEFICIENCY-INDUCED TRANSCRIPTION FACTOR (EgFIT) was significantly upregulated
at 11 d.p.i rather than 3 and 7 d.p.i. It is an integral regulator in response to iron deficiency which upon activation
will trigger downstream iron uptake genes, like ferric reduction oxidase 2 (FRO2) and ATPase AHA2 [39]. In our
RNA-seq data, ferric reduction oxidase 2-like (EgFRO2) was
not expressed in control samples but was induced in T1
samples. Genes related to vesicle trafficking, autophagy,
and pre-mRNA splicing activity were downregulated.
Bahari et al. BMC Plant Biology
(2018) 18:377
Page 12 of 25
Fig. 8 Expression pattern of selected upregulated and downregulated differentially-expressed genes (DEGs) of enriched GO terms. The colour
intensity of each gene is based on Log2 [fold change] values of DEGs in T1 samples of oil palm roots during early interaction (3, 7, and 11 d.p.i)
with Ganoderma boninense compared to untreated control
The expression pattern of DEGs was validated through
qPCR using the same samples that have been sequenced
for RNA-seq data. Several genes mentioned earlier particularly that played crucial roles in defense response were
analyzed and demonstrated consistent expression pattern
with RNA-seq data (Table 4). The expression profiles (upand down-regulation between time-points) were largely
identical. Besides, 5 out of 8 samples tested showed that
all T0 samples were not affected by the treatment and
their expression levels were significantly different compared to the corresponding T1 samples. This is crucial for
minimizing the abiotic stress effect on the T1 samples.
Discussion
Cell wall modification and production of antimicrobial
compounds in plants are the non-specific preformed
11 d.p.i
Replicate 2
2.60*b
9.40*a
2.50a
2.20a
5.50a
2.60a
2.30a
EgFIT
EgMTP10
EgPIN8
13.64d
3.00*a
8.30a
7.80*b
5.60b
5.40*b
ND
22.20*b 11.20*c ND
13.30*b 3.65c
10.70*c 3.80*d
11.31 ±
0.44*e
41.80*c 75.66 ±
11.13a
35.50*c 8.18 ±
0.73a
76.50*d 8.40 ±
0.40*b
45.30*e 6.30 ±
0.20*b
3.90*d
140.66 ±
30.61*b
7.44 ±
2.00a
7.81 ±
0.96a
2.90 ±
0.12a
8.95 ±
0.50*c
4.84 ±
0.48*a,b
1557.48 ±
33.63*b
172.68 ±
10.14*b
48.73 ±
2.12*c
21.04 ±
0.58*d
3.70 ±
0.08*b,c
3.90 ±
1.17a
5.52 ±
0.79a,b
62.21 ±
2.44*c
27.48 ±
3.21d,e
3.31 ±
0.56c
4.72 ±
0.54*e
12.95 ±
0.85*f
27.26 ±
1.80*j
147.81 ±
9.69*f
21.51 ±
2.19*d
119.44 ±
4.46*d,e
3 d.p.i
7 d.p.i
11 d.p.i
57.97 ±
10.70*e
3.23 ±
2.71c
4.89 ±
0.34*e
7.35 ±
0.27*f
9.12 ±
0.31*g,h
16.34 ±
3.73d,e
18.76 ±
2.06*d
120.39 ±
4.70*e
165.38 ±
14.24*f
25.03 ±
1.56*d
18.32 ±
0.45*f
31.97 ±
2.26*g
4.79 ±
0.11h,i
6.08 ±
0.66d
8.76 ±
1.27c
10.36 ±
0.82d
ND
ND
0.12 ±
0.02a
0.20 ±
0.01a
5.62 ±
0.33*a
23.81 ±
3.56a
9.62 ±
1.53*a
13.31 ±
1.42a
3 d.p.i
ND
1.74 ±
0.10a
0.55 ±
0.03a
0.06 ±
0.01a
2.13 ±
0.09c,d
33.43 ±
2.21a
2.52 ±
0.33b
11.08 ±
0.93a
7 d.p.i
ND
0.45 ±
0.02a
0.32 ±
0.05a
0.13 ±
0.01a
0.45 ±
0.02d
0.30 ±
0.03a
2.31 ±
0.51b
3.40 ±
0.53a
11 d.p.i
Replicate 2
0.61 ±
0.05c
1.22 ±
0.08c
1.28 ±
0.13d
1.37 ±
0.30e
45.12 ±
1.69*f
52.79 ±
5.05*c
8.67 ±
1.40c
14.97 ±
0.82d,e
3 d.p.i
ND
2.47 ±
0.07c
3.17 ±
0.13*d,e
0.79 ±
0.07e
11.00 ±
0.81*g
43.20 ±
4.04*c,e
2.43 ±
0.32c
6.76 ±
0.65d
7 d.p.i
ND
1.75 ±
0.22c
2.55 ±
0.47d
0.70 ±
0.22e
2.11 ±
0.16i
0.19 ±
0.05d
2.25 ±
0.48c
2.88 ±
0.18d
11 d.p.i
EgEXP18: E. guineensis expansin-B18-like; EgPG: E. guineensis polygalacturonase-like; EgBGIA: E. guineensis glu S.griseus protease inhibitor-like; EgCht1: E. guineensis chitinase 1-like; EgERF113: E. guineensis ethylene-responsive
transcription factor 113; EgMTP10: E. guineensis metal tolerance protein 10-like; EgPIN8: E. guineensis putative auxin efflux carrier component 8; EgFIT: E. guineensis FER-LIKE IRON DEFICIENCY-INDUCED TRANSCRIPTION FACTOR-like
qPCREach replicate consisted of pooled root from six plants. Pairwise comparison of RNA-seq data was evaluated according to cut-off values of log2 fold change (FC) ≥ |1.0| and P-value < 0.01. Data of qPCR are expressed as
fold change mean ± SEM of three individual technical replicates of T0 and T1 samples compared to untreated control. The fold expressions of each gene were normalized by three reference genes; GAPDH 2, NADH 5 and ßactin expression levels. Significant differences between qPCR groups were determined using one-way ANOVA analysis followed by Tukey’s test. * indicate significant different compared to corresponding control at: P < 0.01
and log2 FC ≥ |1.0| for RNA-seq; and P < 0.01 for qPCR. Different superscript letters (a-j) between samples (within replicate) indicate significant different at: P < 0.01 and log2 FC ≥ |1.0| for RNA-seq; and P < 0.01 in mean values
for qPCR. ND: not detected
7.52a
EgERF113 2.05*a
10.40*a
13.33*a
EgCht1
78.79*d 24.25*e ND
29.46 ±
1.26a
5.28c
12.20 ±
1.22*a
168.90*a 29.86*b
ND
EgBGIA
4.92*c
11.68 ±
1.24*a
6.50*c
3.03b
10.56*a
7 d.p.i
9.19*a
11 d.p.i 3 d.p.i
EgPG
7 d.p.i
105.28 ±
3.58*b
11 d.p.i 3 d.p.i
157.59*a 337.79*b 25.99*c 51.98*d 55.72*d 21.11*e 112.05 ±
2.68*b
7 d.p.i
Replicate 1
3 d.p.i
Replicate 1
in mock (T0 samples) compared to untreated control
Replicate 2
Replicate 1
qPCR
in Ganoderma boninense-treated (T1 samples) compared to untreated control
RNA-seq data
Fold change of expression of
EgEXP18
Genes
Table 4 Validation of RNA-Seq data using
Bahari et al. BMC Plant Biology
(2018) 18:377
Page 13 of 25
Bahari et al. BMC Plant Biology
(2018) 18:377
defense responses which act as the first barrier against
pathogen [40]. Induced defense system for PTI in plant
is initiated with the detection of DAMP or PAMP such
as fungal chitin by PRR of the host [41, 42]. However,
pathogens are able to suppress PTI when it successfully
delivers the effectors leading to effector-triggered susceptibility. At a later phase of resistance, the pathogen
effectors thereafter perceived by nucleotide-binding site
leucine-rich repeat (NB-LRR) for a more specific response the so-called effector-triggered immunity (ETI).
ETI is an exaggerated version of PTI which could bring
response over the resistance threshold level that lead to
HR. Through time-course transcriptome analysis of oil
palm seedlings artificially inoculated with G. boninense,
the occurrence of these responses was monitored based
on transcriptome profiling at the early stages of interaction which was within 11 d.p.i.
PRR proteins are involved in surveillance of pathogens
attack through recognition of their signature-pattern molecules known as PAMPs. Among the PRR proteins, the
lysM domain receptor kinase has been recognized to play
a role in the fungal perception [43]. In the present study,
lysM domain receptor-like kinase 3 was significantly upregulated by 5-fold at 3 d.p.i with decrement at later time
points. This will trigger PTI responses such as production
of PR proteins, ROS and protease inhibitors during the
biotrophic phase. In this study, the activation of PTI is further supported by upregulation of EgCDPK28 which
serves as a mediator for PTI responses.
RLKs are widely known for their roles in development,
cells differentiation and perception of stimuli [44]. In this
report, we presented upregulation of CRINKLY-4 (EgCR-4)
with ascending increment from 3 d.p.i until 11 d.p.i. CR-4
is one of the RLK mainly involved in roots stem cell differentiation and lateral roots formation [45]. CR-4 has been
identified as one of several important extracellular domains of RLKs responsible in recognizing and perceiving
diverse signals under both abiotic and biotic stresses [46].
It can be presumed that the stress signals are further
transduced downstream to effector molecules via secondary signalling molecules, most commonly Ca2+ and ROS
leading to orchestration of protein cascades to activate
plant adaptation and/or defense responsive genes [47, 48].
PR-1 has been reported having prominent antifungal
properties which combat fungal pathogens from further
invading the host plant [49, 50]. Our discovery revealed
significant upregulation of EgPR-1 gene at 3 and 7 d.p.i.
while significantly reduced at 11 d.p.i. Several PR-1 family
members are synthesized in response to pathogen attack
specifically as components for the local HR and systemic
acquired resistance (SAR). Recent discovery by Gamir et
al. showed that PR-1 binds and sequesters sterols from the
membranes of microbes [51]. Sterol-auxotroph oomycete,
Phytophthora brassicae is sensitive to PR-1, whereas
Page 14 of 25
sterol-prototroph pathogens are sensitive to PR-1 only
when the production of sterol is interrupted. High dose of
PR-1, particularly from within vacuole has the capability to
sequester more sterols compared to their biosynthetic capacity, thus achieving the antimicrobial effect in vivo. In this
study, abundant G. boninense hyphae network was observed at 3 d.p.i. We are proposing that reduction of the
hyphae network at the later stages (7 and 11 d.p.i) could
be due to sequestration of their ergosterol by the highly
expressed PR-1 which left the fungus sterol-deficient. Experimental evidences from Choon and colleagues proved
that ergosterol is produced by G. boninense as their primary metabolite in primary cell wall development [52].
Several studies have shown that G. boninense colonization
and its growth phase can be determined by measuring the
concentration of ergosterol [53, 54].
ROS is a unique molecule that serves both physiological and stress-related functions by playing the role as
signalling molecules for redox homeostasis and PTI responses [55, 56]. Peroxidases are another well-known
PR-protein belonging to PR-9 family that are induced in
plant host during pathogen infection [50]. Peroxidases
are expressed in higher plants under colonization of
fungi [57] and other microbes to limit pathogen spread
by providing structural barrier and creating an extremely
unpleasant environment via heavy production of ROS
and reactive nitrogen species (RNS) [58] at the cell wall
matrix level that promote HR and SAR. Intriguingly, the
transcripts of the peroxidase family of genes such as
EgPER3, EgPER4 and EgPER47 were being highly upregulated in oil palm host during Ganoderma attack from 3
d.p.i until 11 d.p.i.
Besides, the significantly upregulated NADPH oxidase:
respiratory burst oxidase homolog proteins (EgRboHA
and EgRboHB) observed in the present study, could have
assisted in the establishment of HR via the synthesis of
apoplastic ROS [59]. The finding was supported by our
previous study which demonstrated effective hyphae
penetration of Ganoderma spp. and plant’s cell wall degradation as early as 24 h-post-inoculation indicating involvement of ROS and strategized degradation of cell
wall during biotrophic stage [27]. Nevertheless, the high
dose of ROS which is toxic to plant cells promotes susceptibility to necrotrophs [60].
Development of secondary cell walls (SCWs) is essential
for various physiological processes in plant including
growth, seed dispersal, pollen release and fertilization as
well as defense response against pathogens attack [61].
SCWs consist of cellulose, lignins, hemicelluloses and
some proteins to structurally support plant as well as
regulate water transport [61, 62]. In the present study, cellulose synthase complexes which comprised of different
isoforms of cellulose synthases (EgCesAs) responsible in
SCWs biosynthesis were upregulated as early as 3 d.p.i.
Bahari et al. BMC Plant Biology
(2018) 18:377
We are also reporting for the first time on the involvement of Cobra-like 4 (EgCOBL-4) in defense response, a
SCW biosynthetic gene which was upregulated at the later
stage of infection against G. boninense (7 and 11 d.p.i).
Arabidopsis COBL-4, ortholog of Brittle culm 1 has been
reported to contribute in biogenesis of cellulose component as well as secondary cell wall thickening [63–65].
We also identified two out of four subfamilies of the
transcripts for expansins (EgEXPA and EgEXPB) known to
be responsible in cell wall expansion and loosening [66].
Expansins were mainly studied under abiotic stress due to
water deficit [67–69]. Expansin has also been reported in
cell wall alteration caused by flooding injury in soybean
seedlings [70], thus it may be suggested that expansin was
upregulated due to wounding by Ganoderma attack. A report has addressed regulation of expansin-like A2 against
necrotrophic attack of B. cinerea on A. thaliana [71]. Our
present data demonstrated 28-fold upregulation of expansin A2-like at 7 and 11 d.p.i. during G. boninense interaction. Two newly discovered expansins in the present
study were expansin B18 (upregulated 90 and 137-fold) as
well as expansin B5 (upregulated 15 and 19-fold) at 3 and
7 d.p.i. respectively. It was postulated that the ability of
expansins to break noncovalent bonding of polysaccharides allow larger exposure of surface glucans of cellulose
leading to cellulase enzymatic attack [72]. However, expansion and loosening of cell wall will increase susceptibility to necrotrophs infection.
During pathogenesis, pathogens secrete digestive proteases which facilitate degradation of plant proteins into
smaller compounds beneficial as nutrient sources [73]. The
proteolytic process is crucial for pathogen’s growth and cell
proliferation within host cells. As pathogen proteases and
their digested products are being administered, protease inhibitors (PIs) are released by host plant to inhibit the proteolytic enzyme as one of the resistance responses [74].
While PIs can be found naturally in plant to regulate many
biological processes such as development [75] and abiotic
stress induced-PCD [76], they are highly upregulated spatiotemporally during biotic stress [77–80]. PIs accumulate
not only at the site of injury, but also at distal locations to
prevent further protease digestive activities [74, 81]. Thus,
protease inhibitors are recognized as one of the major inducible defenses to combat against phytopathogens [82, 83].
We are reporting for the first time a highly expressed EgBGIA from the less studied potato type 1 serine PIs family
with 115-fold upregulation at 3 d.p.i. Interestingly, this PI
was upregulated to the same level of PR-1 genes which is a
prominent plant defense protein to combat fungal threats.
Mostly produced by solanaceous plants, potato type 1 and
II serine PIs have only been reported against herbivory attack [84], hence paving the way to further study on this
gene, whether it has specific involvement in the responses
against Ganoderma attack.
Page 15 of 25
GDSL esterase/lipase is a lipolytic enzyme with conserved GDSL motif and wide substrate specificity. Arabidopsis GDSL lipase, AtGLIP1 was reported to have a
positive effect in conferring resistance towards Alternaria
brassicicola, while its homolog AtGLIP2 is involved in
defense by inhibiting auxin response [85]. On the other
hand, Gao and colleagues showed that rice infected with
blast fungus Magnaporte oryzae treated with OsGLIP1/
2-RNAi demonstrated reduced symptoms of disease, while
OsGLIP1/2-overexpressed plant showed enhanced diseased symptoms. Thus, they proposed that OsGLIP1 and
OsGLIP2 have negative regulatory role towards disease resistance in rice [86]. The dual positive and negative regulatory role indicates the diverse catalytic properties of
GLIP1/2 in lipid metabolism. From our data, oil palm
EgGLIP5 expression was significantly reduced during early
interaction with G. boninense. It was interesting to report
on this gene, but further experimental verification is
needed to ensure if EgGLIP5 plays similar function as
OsGLIP1/2 in plant immunity. Gao et al. also reported
that high level of monogalactosyldiacylglycerol (MGDG)
corresponds to overexpression of OsGLIP1 [86]. Although
MGDG is abundant in leafy vegetables, varied total and
relative contents are also observed in other plant parts
[87]. We found that monogalactosyldiacylglycerol synthase
1 (EgMGD1) expression was also downregulated. Exogenous application of MGDG facilitated growth of pathogen
signifying its negative role in rice immune response [86],
whilst MGD1 is required as a positive regulator in Arabidopsis to induce SAR [88].
Due to its role as primary growth promoter, auxin or
indole-acetic acid (IAA) has been shown to oppose the development of induced-resistance in plant against biotic and
abiotic stresses while supporting disease manifestations in
numerous plants. Auxin perception involves transport inhibitor response 1 (TIR1) and auxin signalling F-box protein 1, 2, and 3 (AFB1, AFB2, AFB3) as receptors which
upon auxin signal will direct proteasomal degradation of
Aux/IAA repressor proteins through ubiquitin ligase
SKP-Cullin-F box, TRANSPORT INHIBITOR RESISTANT1/AUXIN SIGNALING F-BOX (SCFTIR1/AFB) complex and derepress ARF to regulate transcription of
auxin-responsive proteins. Exogenous treatment of oligosaccharides on tobacco and Arabidopsis improved protection of these plants against B. cinerea, however early
application with auxin restore their susceptibility [89, 90].
In our data, members of the Aux/IAA transcriptional
repressors, auxin-responsive protein IAA33 and
IAA30-like were upregulated at 3 d.p.i while the transcriptional activator EgARF4, EgARF11, EgARF18 and
EgARF24 were downregulated at the same time point.
This could suggest that auxin signalling pathway was
inhibited throughout the treatment period which in
turn compromised growth.
Bahari et al. BMC Plant Biology
(2018) 18:377
Apart from the inhibition of auxin signalling, our data
also showed that polar auxin transport in root cells has
been facilitated by the upregulation of putative auxin efflux carrier component 8 (EgPIN8) and protein kinase
PINOID-like (EgPID). Based on accumulating research
evidences, the plasma membrane-localized PIN are critical auxin efflux carrier component, while PID positively
regulate polar trafficking of PIN [91]. Studies showed
that over expression of PIN or PID strongly inhibits root
hair growth, while exogenous auxin feed or application
of PIN or PID inhibitors restores the growth [91]. Thus,
exaggerated efflux of auxin from roots by the actions of
EgPIN8 and EgPID may cause shortage of intracellular
auxin which in turn suppressed auxin signalling and
subsequently inhibited oil palm quaternary root growth
during G. boninense interaction.
Gene expression of EgERF113 was highly elevated by
approximately 29-fold suggesting recognition of necrotrophic attack at 11 d.p.i synergistic with large increment
by 17-fold of EgPR-1. The results support recent studies
claiming highly upregulation of transcription factor
ERF113 in plant defense response against necrotrophs
which subsequently promote PR-1 proteins [92, 93].
Overexpression of transcription factor ERF113
(RAP26.L) was reported to promote wound defense response triggered by jasmonate and ethylene [94]. The
perception of JA-Ile induces interaction between its receptor CORONATINE INSENSITIVE 1 and JAZMONATE ZIM-DOMAIN proteins leads to the relieve of
repression on MYC2 [95, 96], which explains upregulation of MYC2 at 11 d.p.i. MYC2 as well as MYC3 and
MYC4 are essential in promoting accumulation of secondary metabolites during plant resistance against various pathogens [97]. MYCs are known as master
regulator of JA expression under stress response but
they differ in specificity depending on the spatiotemporal accumulation. Induced upregulation of EgMYC2 in
our study supports the reports suggesting that MYC2
mediates JA-responsive genes against necrotrophic attack [30] predominantly in roots while MYC3 and
MYC4 expressed mainly in aerial tissues [98–100]. We
summarized the proposed functional categorization
based on differentially expressed unigenes enriched in
oil palm seedling roots during early interactions with G.
boninense at 3, 7 and 11 d.p.i (Tables 5 and 6).
The molecular and physiological evidences regarding
transition from biotrophy to necrotrophy are still awaiting
elucidation. This brings up the question on how long should
the biotrophic phase be before the transition? Apparently,
the biotrophic phase needs to keep progressing until the
host defense is overwhelmed. In M. oryzae-rice and C. graminicola-maize pathosystems, the establishment of disease
is favoured even though the fungi were not able to dampen
the magnitude of defense at the early stages of interaction
Page 16 of 25
[23]. Hence, C. graminicola and M. oryzae presumably
could endure the elevated host defense until the point when
they change to the necrotrophic mode. Based on our observation in oil palm during Ganoderma attack, upregulation
of important genes involved in defense responses such as
PR-proteins (EgPR-1), protease inhibitor (EgBGIA), PRR
proteins (EgLYK3) and chitinases (EgCht) was observed at 3
and 7 d.p.i before dropping to insignificant level at 11 d.p.i,
suggesting the occurrence of the biotrophic phase whereby
multifaceted plant defense responses were deployed to
counteract the G. boninense attack. The subsequent reduction in the defense response suggests switching to necrotrophic phase by the fungus which was essential for
successful infection. The result agrees with report suggesting suppression of pathogen-responsive genes by transcription factor MYC2 during necrotrophic attack [30].
Furthermore, significant upregulation of the EgFIT at later
phase (11 d.p.i) and minor induction of EgFRO2 could be
another clue for necrotrophic phase that caused disturbance
in iron uptake. EgFIT is a central transcription factor required in upregulation of iron deficiency responses in root
of Arabidopsis [101] hence suggested iron deprivation at
later phase of the infection in the oil palm root. Despite
other pathosystems showing distinct transition period (i.e.
C. graminicola only took 72 h post infection to begin necrotrophy on maize), development and spread of the fungi in
the host plant may vary across different species and rely on
the infection conditions.
Vargas et al. hypothesized that increasing pressure by
plant defense responses during biotrophy has augmented
pathogen to shift into necrotrophy [23]. Genes involved
in ROS production: EgPER and EgRBOH were upregulated and maintained throughout the treatment period
in the present study may cause overwhelming ROS accumulation thus underwent self-propagation causing cell
damage which promotes necrotrophic infection denoting
transition from biotrophy [102]. Besides, the loosening
and expansion of oil palm cell wall by expansin may
contribute to increase susceptibility to necrotrophs.
At the necrotrophic phase, we found out that CR-4 playing an important role in pathogen perception in oil pam.
The oil palm then deploys another set of defense response
against the necrotrophic attack that includes fortification
of cell wall as well as rapid and significant upregulation of
transcription factors. Transcription factor EgMYC2 is
known to regulate defense response against necrotroph
[30]. EgERF113 is proposed based on the present study as
a novel transcription factor involved in biotic stress responses. The most commonly reported ERF transcription
factors associated with biotic stress however, are ERF1 and
ERF2 which are activated through ethylene and jasmonate
signalling pathways [103–105]. It is evident that the oil
palm finally succumbed to chronic infection. Schematic
diagram on the proposed defense mechanism in oil palm
Bahari et al. BMC Plant Biology
(2018) 18:377
Page 17 of 25
Table 5 Proposed functional categorization of upregulated DEG unigenes at different time points compared to untreated control
3 d.p.i
7 d.p.i
11 d.p.i
[U1] Pathogenesis-related protein activity,
[U2] defense against chitin-containing fungal pathogens
[U1] Pathogenesis-related protein activity,
[U2] defense against chitin-containing fungal pathogens
[U1] Pathogenesis-related protein activity,
[U2] defense against chitin-containing fungal pathogens
U3] Pattern recognition receptor activity
and PAMP-triggered immunity (PTI)
signalling
[U3] Pattern recognition receptor activity
and PAMP-triggered immunity (PTI)
signalling
[U3] Pattern recognition receptor activity
and PAMP-triggered immunity (PTI)
signalling
[U4] ROS production, [U5] scavenging
activity
[U4] ROS production, [U5] scavenging
activity
[U4] ROS production, [U5] scavenging
activity
[U6] Signal transduction involve in growth,
development, reproduction, and differentiation
[U6] Signal transduction involve in growth,
development, reproduction, and
differentiation
[U6] Signal transduction involve in growth,
development, reproduction, and
differentiation
Cell wall formation: [U7] Primary, [U8]
Secondary
Cell wall formation: [U7] Primary, [U8]
Secondary
Cell wall formation: [U7] Primary, [U8]
Secondary
Cell wall modification: [U9] lignin
degradation, [U10] loosening and extension,
[U11] O-acetylation of cell wall polymers
Cell wall modification: [U9] lignin
degradation, [U10] loosening and
extension, [U11] O-acetylation of cell wall
polymers
Cell wall modification: [U9] lignin
degradation, [U10] loosening and
extension, [U11] O-acetylation of cell wall
polymers
Biosynthesis of secondary metabolites:
[U12] flavonols, anthocyanidins, catechins
and proanthocyanidins, [U13] ascorbate,
[U14] anthocyanidins, [U15] brassinosteroid
biosynthesis and signalling, [U17] flavonoid
metabolism
Biosynthesis of secondary metabolites:
[U12] flavonols, anthocyanidins, catechins
and proanthocyanidins, [U13] ascorbate,
[U14] anthocyanidins, [U16] brassinosteroid
signalling, [U17] flavonoid metabolism
Biosynthesis of secondary metabolites:
[U12] flavonols, anthocyanidins, catechins
and proanthocyanidins, [U13] ascorbate,
[U18] ubiquinone, other terpenoid-quinone,
phenylpropanoids, [U15] brassinosteroid
biosynthesis and signalling, [U17] flavonoid
metabolism
[U19] Repression of early auxin response
genes, [U20] auxin transport, [U21]
regulation of auxin signalling
[U19] Repression of early auxin response
genes, [U20] auxin transport, [U21]
regulation of auxin signalling
[U19] Repression of early auxin response
genes, [U20] auxin transport, [U21]
regulation of auxin signalling
Binding protein and transport: [U22] heavymetal, [U23] calcium, [U24] water, [U25] iron
Binding protein and transport: [U22] heavymetal, [U23] calcium, [U24] water, [U25] iron
Binding protein and transport: [U22] heavymetal, [U23] calcium, [U24] water, [U25] iron
[U26] Negative regulation in the
proliferation of xylem vessels
[U26] Negative regulation in the
proliferation of xylem vessels
[U26] Negative regulation in the
proliferation of xylem vessels
[U27] Conversion of gibberellin and cytokinin
from inactive form into bioactive form
[U27] Conversion of gibberellin and
cytokinin from inactive form into bioactive
form
[U28] Cytoskeleton organization: [U29]
Kinesin, [U30] microtubule
[U28] Cytoskeleton organization: [U29]
Kinesin, [U30] microtubule
[U28] Cytoskeleton organization: [U29]
Kinesin, [U30] microtubule
[U31] Nitrogen assimilation, distribution
and remobilization within the plant
U33] Adaptation to phosphate starvation
[U32] Biosynthesis of cuticular wax and
suberin
[U33] Adaptation to phosphate starvation
U34] Cell cycle process
[U33] Adaptation to phosphate starvation
U34] Cell cycle process
[U35] Protection from oxidative damage
U34] Cell cycle process
[U36] Fatty acid oxidation
[U36] Fatty acid oxidation
[U35] Protection from oxidative damage
[U36] Fatty acid oxidation
during transition from the biotrophic to the necrotrophic
phase is depicted in Fig. 9.
Conclusions
Observations on early interaction between oil palm
and G. boninense at different time points provided insights on early defense mechanism in oil palm to
overcome the fungal threats even though the plant finally succumbed to BSR. Based on the evidences of
the current study, several suggestions can be made:
(1) the thick multilayer of Ganoderma hyphae observed at 3 d.p.i on oil palm root surface was
significantly reduced at 7 and 11 d.p.i, indicating that
the plant was likely to overcome the infection, however emergence of chronic-stage fruiting bodies indicated that the plant defense was overwhelmed by the
fungus; (2) the fungus had possibly established a biotrophic relationship with the oil palm at early phase
(3 and 7 d.p.i) of interaction as evidenced by significant upregulation of defense-related genes; and (3)
the fungus may have switched its lifestyle to necrotrophy at later phase (11 d.p.i) of colonization whereby
the elevated expression of the same defense-related
genes was significantly reduced. The increasing
Bahari et al. BMC Plant Biology
(2018) 18:377
Page 18 of 25
Table 6 Proposed functional categorization of downregulated DEG unigenes at different time points compared to untreated control
3 d.p.i
7 d.p.i
11 d.p.i
[D1] ROS scavenging activity
[D1] ROS scavenging activity, [D2] oxidative
stress response
[D3] Defense against chitin- and glucancontaining and [D4] oxalate-producing
fungal pathogens
[D3] Defense against chitin- and glucancontaining and [D4] oxalate-producing fungal pathogens
[D3] Defense against chitin- and glucancontaining and [D4] oxalate-producing
fungal pathogens
Transport: [D5] sugar, [D6] water, [D7] ATP,
[D9] protein, [D10] heavy-metal, [D11] drug,
[D12] amino acid, [D13] peptide, [D14] ion
Transport: [D12] amino acid, [D13] peptide,
[D6] water, [D14] ion, [D5] sugar, [D7] ATP,
[D11] drug, [D15] inositol, [D16] various
Transport: [D5] sugar, [D14] ion, [D10]
heavy-metal, [D15] inositol, [D12] amino
acid, [D7] ATP, [D11] drugs, [D6] water,
[D13] peptide
[D17] Vesicle trafficking
[D17] Vesicle trafficking
[D17] Vesicle trafficking
[D18] Autophagy
[D18] Autophagy
[D18] Autophagy
[D19] Signal transduction: [D20] osmotic
response, [D21] histidine kinase, [D22]
phosphatidylinositol signalling
[D19] Signal transduction: [D21] histidine
kinase, [D20] osmotic response, [D22]
phosphatidylinositol signaling
[D19] Signal transduction: [D20] osmotic
response, [D21] histidine kinase
[D23] Pathogenesis-related protein activity
[D23] Pathogenesis-related protein activity
[D23] Pathogenesis-related protein activity
Growth: [D24] trichome and root hair
development, [D25] homeostasis
Growth: [D24] trichome and root hair
development, [D25] homeostasis
Growth: [D24] trichome and root hair
development, [D25] homeostasis
Transcription factor activity in regulating
[D26] photomorphogenesis, [D27]
ethylene-responsive genes, [D28] defense
response, [D28a] biotic and abiotic stress
response, [D29] growth and development
Transcription factor activity in regulating
[D26] photomorphogenesis, [D27]
ethylene-responsive genes, [D28] defense
response, [D28a] biotic and abiotic stress
response, [D29] growth and development
Transcription factor activity in regulating
[D26] photomorphogenesis, [D28] defense
response, [D28a] biotic and abiotic stress
response, [D29] growth and development
[D30] Auxin responsive genes
[D30] Auxin responsive genes
[D30] Auxin responsive genes
[D31] Pre-mRNA splicing activity
[D31] Pre-mRNA splicing activity
[D31] Pre-mRNA splicing activity
Biosynthesis of [D32] jasmonate, [D33]
ethylene, [D34] salicylate, [D35] ABA, [D36]
gibberellin, [D37] L-ascorbate and [D38]
phenylpropanoids. Phytohormones signalling pathway: [D39] jasmonate, [D40] ethylene, [D41] ABA
Biosynthesis of [D32] jasmonate, [D33]
ethylene, [D34] salicylate, [D35] ABA, [D36]
gibberellin, [D37] L-ascorbate and [D38]
phenylpropanoids. Phytohormones signalling pathway: [D39] jasmonate, [D40] ethylene, [D41] ABA
Biosynthesis of [D32] jasmonate, [D33]
ethylene, [D35] ABA, [D36] gibberellin and
[D37] L-ascorbate. Phytohormones signalling pathway: [D40] ethylene, [D41] ABA
[D42] Oxidative degradation of abscisic acid
[D42] Oxidative degradation of abscisic acid
[D42] Oxidative degradation of abscisic acid
Biosynthesis of secondary metabolites:
[D43] anthocyanins, tocopherols, terpenes,
terpenoids, oxylipins and sphingolipids,
[D44] taxols, [D45] pterostilbene
Biosynthesis of secondary metabolites:
[D44] taxols, [D45] pterostilbene, [D46]
oxylipins
Biosynthesis of secondary metabolites:
[D44] taxols, [D46] oxylipins, [D45]
pterostilbene
[D47] Lipid metabolism activity that confer
negative regulation in resistance towards
fungal pathogen
[D47] Lipid metabolism activity that confer
negative regulation in resistance towards
fungal pathogen
[D47] Lipid metabolism activity that confer
negative regulation in resistance towards
fungal pathogen
[D48] Biosynthesis of structural component
of photosynthetic membrane
[D48] Biosynthesis of structural component
of photosynthetic membrane
[D50] GTPase-activating protein for Rab
family protein
[D49] Photoreceptor activity
[D49] Photoreceptor activity
[D50] GTPase-activating protein for Rab
family
[D50] GTPase-activating protein for Rab
family
[D50] GTPase-activating protein for Rab
family
[D51] Cell wall modification
[D51] Cell wall modification
[D51] Cell wall modification
[D52] Biosynthesis of 16:3 and 18:3 fatty
acids
[D52] Biosynthesis of 16:3 and 18:3 fatty
acids
[D54] Non-specific lipolytic acyl hydrolase
activity
[D54] Non-specific lipolytic acyl hydrolase
activity
[D54] Non-specific lipolytic acyl hydrolase
activity
pressure by plant defense responses during biotrophy
could have triggered the transition as well as the
overproduction of ROS which caused cellular damage
and subsequent promotion of necrotrophic lifestyle to
the fungus. The data provides evidence supporting
the hemibiotrophic nature of this pathogen and it
showed that practising hemibiotrophic routine is always an advantage for phytopathogen over the host.
Analysis on DEGs revealed potential candidate genes
to be further elucidated which can serve as
phase-specific biomarkers at the early stages of oil
palm-Ganoderma interaction.
Bahari et al. BMC Plant Biology
(2018) 18:377
Page 19 of 25
quaternary root
and
Fig. 9 Proposed summary of defense-related events in oil palm roots during early interaction with Ganoderma boninense. Early phase responses
(biotrophic phase) are the summary of events which occurred at 3 and 7 d.p.i while later stage responses (necrotrophic phase) are events
occurring at 11 d.p.i based on analysis of DEGs
Methods
Host plant and fungal inoculums preparation
Ganoderma boninense strain PER 71, an aggressive fungal pathogen causing BSR was obtained from Ganoderma and Diseases Research for Oil Palm (GanoDROP)
Unit, Biology Division, Malaysian Palm Oil Board
(MPOB) [106]. The fungus was isolated and purified
from an infected oil palm in United Plantation Teluk
Intan, Perak, Malaysia as described in Sundram et al.
[107]. Four-month-old seedlings of susceptible oil palm
(Elaeis guineensis Jacq. Dura x Pisifera), purchased from
Sime Darby Plantation, Banting, Malaysia, were used as
host plants. The seedlings were planted in Cobalt-60
(60Co) gamma radiation-sterilized (40 kGy) soil mix consisting of topsoil, peat and sand (3:2:1) placed in inert
clay pot/vase and irrigated twice a day. Freshly prepared
malt extract agar (Merck) was added onto sterile rubber
wood block (RWB, 6 cm × 6 cm × 6 cm in dimension)
and autoclaved at 121 °C for 30 mins, before inoculation
with one-week-old G. boninense PER 71 cultured in potato dextrose agar (Difco). Inoculated RWBs were incubated at room temperature in the dark for 4 weeks to be
fully colonised by the Ganoderma inoculum.
Inoculation of G. boninense on oil palm seedlings
(artificial infection)
A total of 84 of four-month-old oil palm seedlings (including control) were tested with two different treatments: inoculation with bare RWB (without fungal
inoculum) as mock treatment (hereafter referred to as
T0) and inoculation with RWB fully colonised with G.
boninense (hereafter referred to as T1). Throughout the
treatment, all seedlings were arranged in a complete randomised design under conditionally-controlled plant
house and watered twice daily using distilled water. Destructive sampling consisting of two biological replicates
was performed at 3, 7 and 11 d.p.i (according to preliminary screening). Untreated seedlings were used as control. Each replicate consisted of pooled root samples
from six randomly picked oil palm seedlings. The root
samples were flash-frozen in liquid nitrogen and kept in
− 80 °C until further use. Several untreated and T1 seedlings were kept for extended period for observation of
chronic infection.
Artificial infection of G. boninense on oil palm seedlings were carried out using the method described by
Idris et al. [106]. For inoculated samples, the colonised
RWBs were placed in direct contact with the entire roots
of the plant seedlings and were placed in clay pots which
had been quarter-filled with the soil mixture. Soil was
added until bole of the seedlings were fully covered.
For NGS, control and T1 samples were analysed for
DEGs between different time points. DEGs of interest
from the NGS data were validated using qPCR which
also include the T0 samples for validation of G. boninense effect on oil palm gene expression.
RNA extraction
Total RNA of all samples were extracted using the
method described by [108] with minor modifications.
Bahari et al. BMC Plant Biology
(2018) 18:377
Two grams of harvested root samples were ground to
fine powder with mortar and pestle in liquid nitrogen.
Six millilitre of RNA extraction buffer (50 mM Tris-HCl
pH 9.0, 150 mM lithium chloride, 5 mM ethylenediaminetetraacetic acid pH 8.0, 5% (w/v) sodium dodecyl
sulfate, 2 mM aurintricarboxylic acid) was freshly prepared and 0.4% of 2-mercaptoethanol was added into
the buffer prior to use. Equal volume of phenol/chloroform (1:1) was added, and the mixture was centrifuged
at 18,514 g for 30 mins at 25 °C. The aqueous phase was
collected and transferred into a new tube. The addition
of phenol/chloroform was repeated. Then, 6 mL of
chloroform:isoamyl alcohol (24:1) was added and the
tube was centrifuged at 18,514 g for 30 mins at 25 °C.
The aqueous phase was collected and transferred into a
new tube. Lithium chloride (8 M) was added to obtain a
final concentration of 2 M and the mixture was kept
overnight in 4 °C. After overnight incubation, the mixture was centrifuged at 12,857 g for 30 mins at 4 °C. The
pellet was washed twice with molecular grade 90% ethanol and centrifuged at 12,857 g for 10 mins at 4 °C. The
pellet was dried using Concentrator 5301 (Eppendorf,
Germany). RNA pellet was dissolved in ultrapure
nuclease-free water and kept in − 80 °C until further use.
All centrifugations were performed using Centrifuge
5810R (Eppendorf, Germany).
mRNA library construction and sequencing
Prior to mRNA library preparation, the RNA Integrity
Number (RIN) of each sample was measured by Agilent
2100 Bioanalyzer (Agilent, USA) wherein only samples
with RIN value of > 7.5 were accepted for sequencing.
The mRNA library was constructed using the Illumina
TruSeq RNA Library Prep Kit (Illumina, USA). Reads
with an average length of 101 bp was used for sequencing on an Illumina HiSeq 2000 (Illumina, USA).
Paired-end (2 × 100 bp) reads with an average length of
101 bp were sequenced by Illumina HiSeq 2000 system
(Illumina, USA) at Macrogen, Korea. As pre-processing
steps, the sequenced reads were saved in FASTQ format
to determine the quality scores across all bases of short
101 bp paired-end reads using FastQC software.
Genome assembly and identification of differentially
expressed genes
The mRNA fragments were then mapped to Elaeis guineensis coding sequences as reference genome (retrieved
from www.ebi.ac.uk/genomes) through Geneious software
version 9.1.5 (Biomatters Ltd.). From align/assemble tools,
Geneious for RNA-Seq was used as mapper with
medium-low sensitivity using clean reads before mapping.
Upon completion of the mapping step, the transcript
abundance of each sample was calculated as transcript per
kilobase million (TPM). To analyse the alteration in gene
Page 20 of 25
expression of infected oil palm compared to uninfected
control, genes expressed from G. boninense-infected samples at each time point were compared to the genes
expressed in absolute control sample. DEGs were evaluated according to stringent cut-off values of log2 fold
change (FC) ≥ |1.0| and P-value < 0.01. DEGs that met the
stringent cut off-values from comparative analysis between control and T1 samples of all time points were
clustered according to upregulated or downregulated
genes. The data of the sequenced mRNA have been deposited at European Nucleotide Archive under the accession number PRJEB27915.
Scanning electron microscopy
Scanning electron microscopy was performed according
to in-house method of Microscopy Unit, Institute of Bioscience, Universiti Putra Malaysia. Uninoculated and G.
boninense-inoculated oil palm root seedlings were sliced
into 1 cm3 using clean blades. Samples were fixed in 4%
glutaraldehyde for 2 days at 4 °C and washed with 0.1 M
sodium cacodylate buffer thrice for 30 mins each.
Post-fixation was carried out in osmium tetroxide for 2 h
at 4 °C, followed by dehydration through a graded acetone
series (35, 50, 75, and 95% for 30 mins and 100% for 1 h,
with three changes of acetone). The samples were then
transferred into specimen vials and placed in critical dryer
(LEICA EM CPD030) for about 30 mins. Samples were
mounted onto stub and sputtered with colloidal silver and
gold (BALTEC SC030) prior to viewing under a scanning
electron microscopy (XL30 ESEM, Philips).
GO and gene set enrichment analysis of DEGs
The DEGs were adopted for sequence homology searches
(NCBI blast+) with biological sequences in CloudBlast
database of Blast2GO with subset to Viridiplantae (taxa:
33090) [109]. Blastx program were executed in protein
database, with limit to 20 blast hit results and restricted to
maximum E-value of 0.001. Functional annotation and
gene ontology of the DEGs were retrieved using default
parameters in Blast2GO package and classified into
biological process, molecular function and cellular component. Enrichment analysis of upregulated and downregulated GO terms was carried out via Gene Set Enrichment
Analysis (GSEA) by applying the P-value of differential expression analysis as reference.
DNA extraction from infected root tissue and pure culture
of G. boninense
Mycelia of G. boninense PER 71 were streaked and inoculated into 150 mL freshly made potato dextrose broth
(Difco) in 250 mL conical flasks. The cultures were incubated for a week using benchtop incubator shaker
SI-600 (Lab Companion, Korea) at 37 °C with agitation
at 150 rpm. The grown mycelia were rinsed using
Bahari et al. BMC Plant Biology
(2018) 18:377
distilled water, filtered using filter papers and promptly
grounded using mortar and pestle in N2 suspension.
Powdered form mycelia were stored in − 80 °C and ready
to be used for DNA extraction. DNA of G. boninense
from 200 mg of mycelia and infected root tissues were
extracted using Prescott and Martin, (1987) method
[108] with minor modifications. DNA pellet of both G.
boninense and all infected samples were dissolved in ultrapure nuclease-free water and stored in − 20 °C until
further use.
Page 21 of 25
parameter and high sensitivity of primers for improved detection threshold of nested PCR. Sequences of nested
primers are listed in Table 7. The cycling parameters were
similar to previous PCR with the exception of annealing
temperature of 62 °C. Amplified products were dyed with
1.5 μL bromophenol blue dye and electrophoresed in 1%
agarose gel. The gel was stained initially using FloroSafe
DNA Stain and visualized using Gel Doc™ XR+ Imager
(Bio-Rad, USA).
Experimental validation with qPCR
Validation of G. boninense presence within T1 oil palm
seedlings via PCR and nested PCR
The DNA obtained from G. boninense PER 71 was used as
control to validate the presence of infection within the
roots of T1 samples. DNA of mycelia was amplified using
primers of G. boninense strain PER71 internal transcribed
spacer 1 (ITS1), partial sequence; 5.8S ribosomal RNA
gene, complete sequence; and internal transcribed spacer
2 (ITS2), partial sequence with genebank accession number KM015454.1. Product length was expected to be 223
bp. Sequence of primer is listed in Table 7. Tubes containing reaction mixtures of DNA (5 ng), primers (5 ng each)
and 2X KAPA Hifi HotStart Readymix (12.5 μL) were
inserted in thermocycler (MyCycler™ Thermal Cycler System with Gradient Option, Bio-Rad, USA) with cycling
parameters of 95 °C for 5 mins; 40 cycles of 94 °C for 35 s,
35 s at 63 °C, 40 s at 72 °C; and 72 °C for 10 mins. The
amplicon of the PCR was sent for sequencing (Apical Scientific, Malaysia). Nested PCR was performed for 7 and
11 d.p.i root samples by using PCR product of 3 d.p.i root
sample as template. Nested primer pair of the sequenced
product was designed using Primer3 (v.0.4.0) based on
certain criteria such as annealing temperature of primer
pairs support separation of both PCRs based on the given
All primers encoding EgPR-1, EgEXP18, EgPG, EgMYC2,
EgBGIA, EgMTP10, EgCht1, EgERF113, EgPIN8 and EgFIT
(Table 8) were designed using Primer3 (v.0.4.0) for qPCR.
Preliminary screening of defense-related genes and validation of genes expression were performed using qPCR
Green Master Mix LRox (2x) according to manufacturer’s
protocol (Biotechrabbit GmbH, Germany). The qPCR cycling parameters were set as follow; 1 cycle of 95 °C for 3
mins, 40 cycles of 95 °C for 15 s and 62 °C for 30 s, followed
by melt curve at 65 °C to 95 °C (5 s for every increment of
0.5 °C). Analysis of the qPCR were performed using
Bio-Rad CFX Manager (Bio-Rad, USA). The specificity of
each primer pair was verified by melt curve analysis. Stability of five endogenous controls (Ubiquitin, Manganese
Superoxide dismutase (MSD), GAPDH 2, β-actin and
NADH 5) was tested over all samples (control, mock and
treated). Expression levels of all analyzed genes were normalized against the expression level of three most stable
reference genes which were GAPDH 2, β-actin and NADH
Table 8 Primers used for quantitative real-time PCR analysis
Primers
name
Sense
sequence (5′-3′)
Antisense
sequence (5′-3′)
EgGAPDH
2
GAAGGTCATCATATCTGCTCCC CATCAACAGTCTTCTGAGT
GGC
Table 7 Primers used for validation of Ganoderma boninense
DNA of oil palm roots
EgNADH 5 GCTCCCCTTTATTTGAATACCC
Primer
ID
Antisense
sequence (5′-3′)
Egβ-Actin
GAGAGAGCGTGCTACTCATCTT CGGAAGTGCTTCTGAGATCC
EgPR-1
GTCAGGCAGCTCAACTTCAC
TCGAACTTGAACTGGGTCGA
C
KM015454.1 CAACGGATCTCTTG
(control)
GCTCTC
GCCGATCAATAAAA
GACCGA
EgPG
CTGGAGTGAAGATTAGTCA
GGTG
ACAGAACTAGAGGCAGTAA
CATG
T1D3
(3 d.p.i)
GCCGATCAATAAAA
GACCGA
EgEXP18
ATGGCTACTTCTCTCCTGGC
CTTGATCCACAGCATTGCGA
EgMYC2
CTCAATCAGAGATTCTACGCCC CCTTGAGGGTATCAACTTG
GC
EgBGIA
ATGCACTGGGAAGAGCTCAT
GATGCCATCTTTGTCCACCC
EgCht1
AGCTCATCACTGTTCGACCA
CAAGAAAGCAGCGATCTCC
C
EgFIT
GTGAAGTTGGAGTGCAGCAA
TCGCTGTCATCTCGAACTCA
EgMTP10
TTGGCAGTTATCGCTTCCAC
TGCAGACCAAGTGTAGCCAT
EgPIN8
GGTGGTGCTCGTATTGTGTC
CGAACCCTCCATGATGCTTG
EgERF113
AGCAGCACTAAAGTTCAAA
GGC
GAATAAGGTCTGGGTAGGA
GGG
Accession
No.
Sense
sequence (5′-3′)
KM015454.1 CAACGGATCTCTTG
GCTCTC
–
GATCGGCTCCTCTC
AAATGC
CGGTTAGAAGCTCG
CCAAAC
T1D11n –
(11 d.p.i)
GATCGGCTCCTCTC
AAATGC
CGGTTAGAAGCTCG
CCAAAC
–
GATCGGCTCCTCTC
AAATGC
CGGTTAGAAGCTCG
CCAAAC
T1D7n
(7 d.p.i)
+VE
Note: C - primer for nested PCR from untreated control sample
T1D3 - primer for normal PCR from 3 day-post-inoculation sample
T1D7n* - primer for nested PCR from 7 day-post-inoculation sample
T1D11n* - primer for nested PCR from 11 day-post-inoculation sample
+ve -primer for normal PCR from Ganoderma boninense PER71 pure culture
* retrieved from sequenced PCR amplicon of T1D3 sample
AATAGTTAGAGATGCCGCA
AGC
Bahari et al. BMC Plant Biology
(2018) 18:377
5. Using more than one reference genes as normalization
factor for qPCR data is needed to avoid the drawbacks of
single gene normalization error [110]. Primers for NADH5
and β-actin were designed based on Kwan et al. [111]. PCR
efficiency, R2 value and slope value for the three reference
genes which fall within acceptable range [112] were tabulated in Additional file 5. All assays were performed in three
individual technical replicates of samples and non-template
control was included.
Statistical analysis
According to RNA-seq data, DEGs were determined following cut off-values of log2 FC ≥ |1.0| and P-value < 0.01.
The expression of each genes from qPCR analysis was
normalized by three reference genes; GAPDH 2, NADH 5
and ß-actin expression levels. Expression levels were
expressed as the mean ± SEM of three individual technical
replicates of each sample. P < 0.01 denoted significant different between groups as assessed by one-way ANOVA
analysis followed by Tukey’s test.
Additional files
Page 22 of 25
species; ROS: Reactive oxygen species; RWB: Rubber wood block; SAR: Systemic
acquired resistance; SCFTIR1/AFB: SKP-Cullin-F box, transport inhibitor resistant1/
auxin signaling f-box; SCWs: Secondary cell walls; TIR: Transport inhibitor
response; TPM: Transcript per kilobase million
Acknowledgements
Not applicable.
Funding
This work was supported by Ministry of Education, Malaysia under
NanoMalaysia Institute for Innovative Technology (NanoMITe) Consortium
projects 2015–2020 (5526302). NS was supported by MyPhD scholarship
from Ministry of Higher Education, Malaysia. MB was supported by Graduate
Research Fellowship from Universiti Putra Malaysia. G. boninense PER 71
culture was provided by Dr. Idris Abu Seman from Malaysian Palm Oil Board
(MPOB). Malaysian Nuclear Agency has provided Cobalt-60 gamma radiation
service for the research purposes.
Availability of data and materials
The data of sequenced mRNA are available in the European Nucleotide
Archive (ENA) under the accession number PRJEB27915.
Author’s contributions
SA designed and supervised the studies carried out by MB, NS and RR. MB
and NS contributed equally in this study. MB performed the bioinformatics
analysis of transcriptome data. MB, NS and RR contributed in DEGs analysis
and validation of RNA-seq using qPCR. MB and NS prepared while SA
reviewed and edited the manuscript. All authors read and approved the final
version of the submitted manuscript.
Additional file 1: Alignment of Ganoderma boninense PER71 ITS1/2
sequence with sequenced amplicon of normal and nested PCR. Nested
primers were generated from sequenced PCR product of 3 days post
infected oil palm root sample. Result showed conserved sequence which
confirmed that G. boninense fungal hyphae were present in all T1
samples. (JPG 235 kb)
Ethics approval and consent to participate
Not applicable.
Additional file 2: Top-hit species distribution of best-aligned gene annotations with highest percentage of similarity and lowest e-value. With
restriction to 20 blast hits and e-value cut-off of 0.001, Elaeis guineensis
was the most top-hit species with close to 9000 top-hits for upregulated
genes and 15,000 top-hits for downregulated genes. (JPG 173 kb)
Competing interests
The authors declare that they have no competing interests.
Additional file 3: Statistics for blast and annotation procedures
generated by Blast2Go Pro package from upregulated genes. (A)
Annotation distribution; (B) E-value distribution; (C) Sequence similarity
distribution; (D) Number of sequence with length. (JPG 118 kb)
Additional file 4: Statistics for blast and annotation procedures
generated by Blast2Go Pro package from downregulated genes. (E)
Annotation distribution; (F) E-value distribution; (G) Sequence similarity
distribution; (H) Number of sequence with length. (JPG 125 kb)
Additional file 5: PCR efficiency, R2 value and slope value for the three
reference genes. (PPTX 38 kb)
Abbreviations
AFB: Auxin signalling F-box protein; BSR: Basal stem rot; COBL-4: Cobra-like 4;
CR-4: CRINKLY-4; CWDEs: Cell wall degrading enzymes; d.p.i: Days-postinoculation; DAMP: Damage-associated molecular pattern; DEG: Differentially
expressed genes; ERF: Ethylene-responsive transcription factor; ETI: Effectortriggered immunity; EXP: Expansin; FC: Fold change; FIT: Fer-like iron deficiencyinduced transcription factor; FRO2: Ferric reduction oxidase 2; GLIP: GDSL
esterase/ lipase; GO: Gene Ontology; GSEA: Gene set enrichment analysis;
HR: Hypersensitive response; IAA: Indole-acetic acid; Ile: Isoleucine; ITS: Internal
transcribed spacer; JA: Jasmonate; MGDG: Monogalactosyldiacylglycerol;
MYC: Transcription factor MYC; NGS: Next-generation sequencing;
PAMP: Pathogen-associated molecular pattern; PCD: Programmed cell death;
PCR: Polymerase chain reaction; PER: Peroxidase; PI: Protease inhibitor;
PID: Protein kinase PINOID; PIN: Auxin efflux carrier; PR: Pathogenesis-related
protein; PRR: Pattern recognition receptor; PTI: Pattern-triggered immunity;
RBOH: Respiratory burst oxidase homolog; RIN: RNA Integrity Number;
RLKs: Receptor-like kinases; RNA-seq: RNA sequencing; RNS: Reactive nitrogen
Consent for publication
Not applicable.
Publisher’s Note
Springer Nature remains neutral with regard to jurisdictional claims in
published maps and institutional affiliations.
Author details
1
Institute of Plantation Studies, Universiti Putra Malaysia, 43400 UPM,
Serdang, Selangor, Malaysia. 2Faculty of Agriculture, Universiti Putra Malaysia,
43400 UPM, Serdang, Selangor, Malaysia. 3Research Institute for
Biotechnology and Bioengineering, Isfahan University of Technology, Isfahan
84156-83111, Iran.
Received: 2 August 2018 Accepted: 6 December 2018
References
1. Kadarusman YB, Herabadi AG. Improving sustainable development within
Indonesian palm oil: the importance of the reward system. Sust Dev. 2018.
/>2. Varkkey H, Tyson A, Choiruzzad SAB. Palm oil intensification and expansion
in Indonesia and Malaysia: environmental and socio-political factors
influencing policy. Forest Policy Econ. 2018;92:148–59.
3. Stichnothe H, Schuchardt F, Rahutomo S. European renewable energy
directive: critical analysis of important default values and methods for
calculating greenhouse gas (GHG) emissions of palm oil biodiesel. Int J LCA.
2014;19(6):1294–304.
4. Kurnia J, Jangam S, Akhtar S. Advances in biofuel production from oil palm
and palm oil processing wastes: a review. Biofuel Res J. 2016;3(1):332–46.
5. Malaysian Palm Oil Board (MPOB) monthly export of oil palm products –
2017. Accessed 10 April
2018.
Bahari et al. BMC Plant Biology
6.
7.
8.
9.
10.
11.
12.
13.
14.
15.
16.
17.
18.
19.
20.
21.
22.
23.
24.
25.
26.
27.
28.
29.
30.
(2018) 18:377
Roslan A, Idris A. Economic impact of Ganoderma incidence on Malaysian
oil palm plantation–a case study in Johor. Oil Palm Industry Econ J. 2012;
12(1):24–30.
Moncalvo JM. Systematics of Ganoderma. In: Flood J, Bridge PD, Holderness
M, editors. Ganoderma diseases of perennial crops. Wallingford: CAB
International; 2000. p. 23–45.
Susanto A, Sudharto P, Purba R. Enhancing biological control of basal stem
rot disease (Ganoderma boninense) in oil palm plantations. Mycopathologia.
2005;159(1):153–7.
Rees RW, Flood J, Hasan Y, Cooper RM. Effects of inoculum potential , shading
and soil temperature on root infection of oil palm seedlings by the basal stem
rot pathogen Ganoderma boninense. Plant Pathol. 2007;56(5):862–70.
GaitFee C. Management of Ganoderma diseases in oil palm plantations.
Planter. 2011;87(1022):325–39.
Chong KP, Dayou J, Alexander A. Pathogenic nature of Ganoderma
boninense and basal stem rot disease. In: Chong KP, Dayou J, Alexander A,
editors. Detection and control of Ganoderma boninense in oil palm crop.
Cham: Springer; 2017. p. 5–12.
Corley RHV, Tinker PB. Vegetative propagation and biotechnology. In: Corley
RHV, Tinker PB, editors. The oil palm: Wiley; 2003. p. 201–15.
Morkunas I, Ratajczak L. The role of sugar signaling in plant defense
responses against fungal pathogens. Acta Physiol Plant. 2014;36(7):1607–19.
Lam E, Kato N, Lawton M. Programmed cell death, mitochondria and the
plant hypersensitive response. Nature. 2001;411(6839):848.
Zhao Z, Liu H, Wang C, Xu JR. Comparative analysis of fungal genomes
reveals different plant cell wall degrading capacity in fungi. BMC Genomics.
2013;14(1):274.
Bellincampi D, Cervone F, Lionetti V. Plant cell wall dynamics and wall-related
susceptibility in plant–pathogen interactions. Front Plant Sci. 2014;5:228.
Sattler S, Funnell-Harris D. Modifying lignin to improve bioenergy
feedstocks: strengthening the barrier against pathogens? Front Plant Sci.
2013;4:70.
Hok S, Attard A, Keller H. Getting the most from the host: how pathogens
force plants to cooperate in disease. Mol Plant-Microbe Interact. 2010;23(10):
1253–9.
Cantu D, Blanco-Ulate B, Yang L, Labavitch JM, Bennett AB, Powell AL.
Ripening-regulated susceptibility of tomato fruit to Botrytis cinerea requires
NOR but not RIN or ethylene. Plant Physiol. 2009;150(3):1434–49.
Pazzagli L, Seidl-Seiboth V, Barsottini M, Vargas WA, Scala A, Mukherjee PK.
Cerato-platanins: elicitors and effectors. Plant Sci. 2014;228:79–87.
Quarantin A, Glasenapp A, Schäfer W, Favaron F, Sella L. Involvement of the
Fusarium graminearum cerato-platanin proteins in fungal growth and plant
infection. Plant Physiol Biochem. 2016;109:220–9.
Kabbage M, Yarden O, Dickman MB. Pathogenic attributes of Sclerotinia
sclerotiorum: switching from a biotrophic to necrotrophic lifestyle. Plant Sci.
2015;233:53–60.
Vargas WA, Martín JMS, Rech GE, Rivera LP, Benito EP, Díaz-Mínguez JM,
Thon MR, Sukno SA. Plant defense mechanisms are activated during
biotrophic and necrotrophic development of Colletotricum graminicola in
maize. Plant Physiol. 2012;158(3):1342–58.
Idris AS, Kushairi A, Ismail S, Ariffin D. Selection for partial resistance in oil palm
progenies to Ganoderma basal stem rot. J Oil Palm Res. 2004;16(2):12–8.
Sustainable Oil Palm Farming / Tenera, Dura, and Pisifera. http://akvopedia.
org/wiki/Sustainable_Oil_Palm_Farming_/_Tenera,_Dura,_and_Pisifera.
Accessed 10 April 2018.
Kushairi A, Jalani BS, Rajanaidu N, Zakri AH. Variation in Dura × Pisifera
planting materials, 1: bunch yield. Elaeis. 1994;6:14–24.
Nusaibah SA, Akmar ASN, Idris AS, Sariah M, Pauzi ZM. Involvement of
metabolites in early defense mechanism of oil palm (Elaeis guineensis Jacq.)
against Ganoderma disease. Plant Physiol Biochem. 2016;109:156–65.
Ho CL, Tan YC, Yeoh KA, Ghazali AK, Yee WY, Hoh CC. De novo
transcriptome analyses of host-fungal interactions in oil palm (Elaeis
guineensis Jacq.). BMC Genomics. 2016;17(1):66.
Ho CL, Tan YC, Yeoh KA, Lee WK, Ghazali AK, Yee WY, Hoh CC.
Transcriptional response of oil palm (Elaeis guineensis Jacq.) inoculated
simultaneously with both Ganoderma boninense and Trichoderma
harzianum. Plant Gene. 2018;13:56–63.
Lorenzo O, Chico JM, Sanchez-Serrano JJ, Solano R. JASMONATEINSENSITIVE1 encodes a MYC transcription factor essential to discriminate
between different jasmonate-regulated defense responses in Arabidopsis.
Plant Cell. 2004;16:1938–50.
Page 23 of 25
31. Pozo MJ, Van Der Ent S, Van Loon LC, Pieterse CM. Transcription factor
MYC2 is involved in priming for enhanced defense during rhizobacteriainduced systemic resistance in Arabidopsis thaliana. New Phytol. 2008;180(2):
511–23.
32. Hiruma K, Nishiuchi T, Kato T, Bednarek P, Okuno T, Schulze-Lefert P, Takano
Y. Arabidopsis ENHANCED DISEASE RESISTANCE 1 is required for pathogeninduced expression of plant defensins in nonhost resistance, and acts
through interference of MYC2-mediated repressor function. Plant J. 2011;
67(6):980–92.
33. Kloppholz S, Kuhn H, Requena N. A secreted fungal effector of Glomus
intraradices promotes symbiotic biotrophy. Curr Biol. 2011;21(14):1204–9.
34. Liu G, Kennedy R, Greenshields DL, Peng G, Forseille L, Selvaraj G, Wei Y.
Detached and attached Arabidopsis leaf assays reveal distinctive defense
responses against hemibiotrophic Colletotrichum spp. Mol Plant-Microbe
Interact. 2007;20(10):1308–19.
35. Kendziorski C, Irizarry RA, Chen KS, Haag JD, Gould MN. On the utility of
pooling biological samples in microarray experiments. Proc Natl Acad Sci U
S A. 2005;102(12):4252–7.
36. Biswas S, Agrawal YN, Mucyn TS, Dangl JL, Jones CD. Biological averaging in
RNA-seq. Quant. Methods arXiv 2013;1309.0670 [q-bio.QM].
37. Wagner GP, Kin K, Lynch VJ. Measurement of mRNA abundance using RNAseq data: RPKM measure is inconsistent among samples. Theor Biosci. 2012;
131(4):281–5.
38. Anders S, Huber W. Differential expression analysis for sequence count data.
Genome Biol. 2010;11(10):R106.
39. Colangelo EP, Guerinot ML. The essential basic helix-loop-helix protein FIT1
is required for the iron deficiency response. Plant Cell. 2004;16(12):3400–12.
40. Senthil-Kumar M, Mysore KS. Nonhost resistance against bacterial
pathogens: retrospectives and prospects. Annu Rev Phytopathol. 2013;51:
407–27.
41. Nürnberger T, Brunner F, Kemmerling B, Piater L. Innate immunity in plants
and animals: striking similarities and obvious differences. Immunol Rev.
2004;198(1):249–66.
42. Zipfel C, Felix G. Plants and animals: a different taste for microbes? Curr
Opin Plant Biol. 2005;8(4):353–60.
43. Zipfel C. Plant pattern-recognition receptors. Trends Immunol. 2014;35(7):
345–51.
44. Nikonorova N, Vu LD, Czyzewicz N, Gevaert K, De Smet I. A phylogenetic
approach to study the origin and evolution of the CRINKLY4 family. Front
Plant Sci. 2015;6:880.
45. Stahl Y, Wink R, Ingram G, Simon R. A signaling module controlling the
stem cell niche in Arabidopsis root meristems. Curr Biol. 2009;19(11):909–14.
46. Shiu S, Bleecker A. Expansion of the receptor-like kinase/Pelle gene family
and receptor-like proteins in Arabidopsis. Plant Physiol. 2003;132(2):530–43.
47. Vaid N, Pandey PK, Tuteja N. Lectin receptor-like kinases and their emerging
role in abiotic stress tolerance. In: Tuteja N, Gill SS, editors. Abiotic stress
response in plants. Weinheim: Wileh-VCH; 2016. p. 203–16.
48. Choi WG, Miller G, Wallace I, Harper J, Mittler R, Gilroy S. Orchestrating rapid
long-distance signaling in plants with Ca2+, ROS and electrical signals. Plant
J. 2017;90(4):698–707.
49. Niderman T, Genetet I, Bruyere T, Gees R, Stintzi A, Legrand M, Fritig B,
Mosinger E. Pathogenesis-related PR-1 proteins are antifungal. Isolation and
characterization of three 14-kilodalton proteins of tomato and of a basic PR1 of tobacco with inhibitory activity against Phytophthora infestans. Plant
Physiol. 1995;108(1):17–27.
50. van Loon L, Rep M, Pieterse C, Pieterse C. Significance of inducible defenserelated proteins in infected plants. Annu Rev Phytopathol. 2006;44:135–62.
51. Gamir J, Darwiche R, Hof P, Choudhary V, Stumpe M, Schneiter R, Mauch F.
The sterol-binding activity of PATHOGENESIS-RELATED PROTEIN 1 reveals
the mode of action of an antimicrobial protein. Plant J. 2017;89(3):502–9.
52. Choon RLT, Sariah M, Mariam S. Ergosterol from the soilborne fungus
Ganoderma boninense. J Basic Microbiol. 2012;52(5):608–12.
53. Gao Y, Chen T, Breuil C. Ergosterol—a measure of fungal growth in wood
for staining and pitch control fungi. Biotechnol Tech. 1993;7(9):621–6.
54. Muniroh MS, Sariah M, Abidin MZ, Lima N, Paterson RRM. Rapid detection
of Ganoderma-infected oil palms by microwave ergosterol extraction with
HPLC and TLC. J Microbiol Methods. 2014;100:143–7.
55. Mittler R, Vanderauwera S, Gollery M, Van Breusegem F. Reactive oxygen
gene network of plants. Trends Plant Sci. 2004;9(10):490–8.
56. Trchounian A, Petrosyan M, Sahakyan N. Plant cell redox homeostasis and
reactive oxygen species. In: Gupta DK, Palma JM, Corpas FJ, editors. Redox
Bahari et al. BMC Plant Biology
57.
58.
59.
60.
61.
62.
63.
64.
65.
66.
67.
68.
69.
70.
71.
72.
73.
74.
75.
76.
77.
78.
(2018) 18:377
state as a central regulator of plant-cell stress responses. Cham: Springer;
2016. p. 25–50.
Sasaki K, Iwai T, Hiraga S, Kuroda K, Seo S, Mitsuhara I, Miyasaka A, Iwano M,
Ito H, Matsui H, Ohashi Y. Ten rice peroxidases redundantly respond to
multiple stresses including infection with rice blast fungus. Plant Cell
Physiol. 2004;5(10):1442–52.
Passardi F, Cosio C, Penel C, Dunand C. Peroxidases have more functions
than a Swiss army knife. Plant Cell Rep. 2005;24(5):255–65.
Yoshioka H, Numata N, Nakajima K, Katou S, Kawakita K, Rowland O, Jones
JD, Doke N. Nicotiana benthamiana gp91phox homologs NbrbohA and
NbrbohB participate in H2O2 accumulation and resistance to Phytophthora
infestans. Plant Cell. 2003;15:706–18.
Abdullah SNA, Akhtar MS. Plant and necrotrophic fungal pathogen interaction:
mechanism and mode of action. In: Hakeem KR, Akhtar MS, Abdullah SNA,
editors. Plant, soil and microbes. Cham: Springer; 2016. p. 29–53.
MacMillan CP, Birke H, Chuah A, Brill E, Tsuji Y, Ralph J, Dennis E, Llewellyn
D, Pettolino FA. Tissue and cell-specific transcriptomes in cotton reveal the
subtleties of gene regulation underlying the diversity of plant secondary
cell walls. BMC Genomics. 2017;18(1):539.
Cosgrove DJ, Jarvis MC. Comparative structure and biomechanics of plant
primary and secondary cell walls. Front Plant Sci. 2012;3:204.
Brown D, Zeef L, Ellis J, Goodacre R, Turner SR. Identification of novel genes
in Arabidopsis involved in secondary cell wall formation using expression
profiling and reverse genetics. Plant Cell. 2005;17(8):2281–95.
Sato K, Suzuki R, Nishikubo N, Takenouchi S, Ito S, Nakano Y, Nakaba S, Sano
Y, Funada R, Kajita S, Kitano H. Isolation of a novel cell wall architecture
mutant of rice with defective Arabidopsis COBL4 ortholog BC1 required for
regulated deposition of secondary cell wall components. Planta. 2010;
232(1):257–70.
Liu L, Shang-Guan K, Zhang B, Liu X, Yan M, Zhang L, Shi Y, Zhang M, Qian
Q, Li J, Zhou Y. Brittle Culm1, a COBRA-like protein, functions in cellulose
assembly through binding cellulose microfibrils. PLoS Genet. 2013;9(8):
e1003704.
Marowa P, Ding A, Kong Y. Expansins: roles in plant growth and potential
applications in crop improvement. Plant Cell Rep. 2016;35(5):949–65.
Jones L, McQueen-Mason S. A role for expansins in dehydration and
rehydration of the resurrection plant Craterostigma Plantagineum. FEBS Lett.
2004;559(1–3):61–5.
Guo W, Zhao J, Li X, Qin L, Yan X, Liao H. A soybean β-expansin gene
GmEXPB2 intrinsically involved in root system architecture responses to
abiotic stresses. Plant J. 2011;66(3):541–52.
Li F, Han Y, Feng Y, Xing S, Zhao M, Chen Y, Wang W. Expression of wheat
expansin driven by the RD29 promoter in tobacco confers water-stress
tolerance without impacting growth and development. J Biotechnol. 2013;
163(3):281–91.
Nanjo Y, Nakamura T, Komatsu S. Identification of indicator proteins
associated with flooding injury in soybean seedlings using label-free
quantitative proteomics. J Proteome Res. 2013;12(11):4785–98.
Abuqamar S, Ajeb S, Sham A, Enan MR, Iratni R. A mutation in the expansinlike A2 gene enhances resistance to necrotrophic fungi and hypersensitivity
to abiotic stress in Arabidopsis thaliana. Mol Plant Pathol. 2013;14(8):813–27.
Cosgrove DJ. Plant expansins: diversity and interactions with plant cell walls.
Curr Opin Plant Biol. 2015;25:162–72.
Li H, Child M, Bogyo M. Proteases as regulators of pathogenesis: examples
from the Apicomplexa. Biochim Biophys Acta. 2012;1824(1):177–85.
Seow-Neng C, Bakar NA, Mahmood M, Chai-Ling H, Shaharuddin NA.
Alternative strategy in crop protection: protease inhibitors from turmeric. In:
Abdullah SNA, Ho CL, Wagstaff C. crop improvement: Cham: Springer
International Publishing; 2017. p. 253–70.
Rustgi S, Boex-Fontvieille E, Reinbothe C, von Wettstein D, Reinbothe S.
Serpin1 and WSCP differentially regulate the activity of the cysteine
protease RD21 during plant development in Arabidopsis thaliana. Proc Natl
Acad Sci U S A. 2017;201621496.
Petrov V, Hille J, Mueller-Roeber B, Gechev T. ROS-mediated abiotic stressinduced programmed cell death in plants. Front Plant Sci. 2015;6:69.
Dutt S, Gaur V, Taj G, Kumar A. Differential induction of two different
cystatin genes during pathogenesis of Karnal bunt (Tilletia indica) in wheat
under the influence of jasmonic acid. Gene. 2012;506(1):253–60.
Hartl M, Giri AP, Kaur H, Baldwin IT. The multiple functions of plant serine
protease inhibitors: defense against herbivores and beyond. Plant Signal
Behav. 2011;6(7):1009–11.
Page 24 of 25
79. Bode RF, Halitschke R, Kessler A. Herbivore damage-induced production and
specific anti-digestive function of serine and cysteine protease inhibitors in tall
goldenrod, Solidago altissima L. (Asteraceae). Planta. 2013;237(5):1287–96.
80. Müller V, Bonacci G, Batthyany C, Amé MV, Carrari F, Gieco J, Asis R. Peanut
seed cultivars with contrasting resistance to Aspergillus parasiticus
colonization display differential temporal response of protease inhibitors.
Phytopathology. 2017;107(4):474–82.
81. Bangrak P, Chotigeat W. Molecular cloning and biochemical characterization
of a novel cystatin from Hevea rubber latex. Plant Physiol Biochem. 2011;
49(3):244–50.
82. Zhang Y, Lubberstedt T, Xu M. The genetic and molecular basis of plant
resistance to pathogens. J Genet Genomics. 2013;40(1):23–35.
83. Habib H, Fazili K. Plant protease inhibitors: a defense strategy in plants.
Biotechnol Mol Biol Rev. 2007;2(3):68–85.
84. Dunse KM, Stevens JA, Lay FT, Gaspar YM, Heath RL, Anderson MA.
Coexpression of potato type I and II proteinase inhibitors gives cotton
plants protection against insect damage in the field. Proc Natl Acad Sci.
2010;107(34):15011–5.
85. Lee DS, Kim BK, Kwon SJ, Jin HC, Park OK. Arabidopsis GDSL lipase 2 plays a
role in pathogen defense via negative regulation of auxin signaling.
Biochem Biophys Res Commun. 2009;379(4):1038–42.
86. Gao M, Yin X, Yang W, Lam SM, Tong X, Liu J, Wang X, Li Q, Shui G, He Z.
GDSL lipases modulate immunity through lipid homeostasis in rice. PLoS
Pathog. 2017;13(11):e1006724.
87. Christensen LP. Galactolipids as potential health promoting compounds in
vegetable foods. Recent Pat Food Nutr Agric. 2009;1(1):50–8.
88. Gao QM, Yu K, Xia Y, Shine MB, Wang C, Navarre D, Kachroo A, Kachroo P.
Mono-and digalactosyldiacylglycerol lipids function nonredundantly to
regulate systemic acquired resistance in plants. Cell Rep. 2014;9(5):1681–91.
89. Ferrari S, Galletti R, Pontiggia D, Manfredini C, Lionetti V, Bellincampi D,
Cervone F, DeLorenzo G. Transgenic expression of a fungal endopolygalacturonase increases plant resistance to pathogens and reduces
auxin sensitivity. Plant Physiol. 2008;146:669–81.
90. Savatin DV, Ferrari S, Sicilia F, De Lorenzo G. Oligogalacturonide-auxin
antagonism does not require posttranscriptional gene silencing or
stabilization of auxin response repressors in Arabidopsis. Plant Physiol. 2011;
157(3):1163–74.
91. Lee SH. Cho HT. PINOID positively regulates auxin efflux in Arabidopsis root
hair cells and tobacco cells. Plant Cell. 2006;18(7):1604–16.
92. Wang H, Lin J, Chang Y, Jiang C. Comparative transcriptomic analysis reveals
that ethylene/H2O2-mediated hypersensitive response and programmed cell
death determine the compatible interaction of sand pear and Alternaria
alternata. Front Plant Sci. 2017;8:195.
93. Zhao Y, Chang X, Qi D, Dong L, Wang G, Fan S, Jiang L, Cheng Q, Chen X,
Han D, Xu P. A novel soybean ERF transcription factor, GmERF113, increases
resistance to Phytophthora sojae infection in soybean. Front Plant Sci. 2017;
8:229.
94. Asahina M, Azuma K, Pitaksaringkarn W, Yamazaki T, Mitsuda N, OhmeTakagi M, Yamaguchi S, Kamiya Y, Okada K, Nishimura T, Koshiba T. Spatially
selective hormonal control of RAP2. 6L and ANAC071 transcription factors
involved in tissue Reunion in Arabidopsis. Proc Natl Acad Sci U S A. 2011;
108(38):16128–32.
95. Yan J, Zhang C, Gu M, Bai Z, Zhang W, Qi T. The Arabidopsis CORONATINE
INSENSITIVE1 protein is a jasmonate receptor. Plant Cell. 2009;21(8):2220–36.
96. Zhu Z, An F, Feng Y, Li P, Xue L, Mu A. Derepression of ethylene-stabilized
transcription factors (EIN3/EIL1) mediates jasmonate and ethylene signaling
synergy in Arabidopsis. Proc Natl Acad Sci U S A. 2011;108(30):12539–44.
97. Schweizer F, Fernández-Calvo P, Zander M, Diez-Diaz M, Fonseca S, Glauser
G, Lewsey MG, Ecker JR, Solano R, Reymond P. Arabidopsis basic helix-loophelix transcription factors MYC2, MYC3, and MYC4 regulate glucosinolate
biosynthesis, insect performance, and feeding behavior. Plant Cell. 2013;
25(8):3117–32.
98. Fernández-Calvo P, Chini A, Fernández-Barbero G, Chico C, Gimenez-Ibanez S,
Geerinck J, Eeckhout D, Schweizer F, Godoy M, Franco-Zorrilla JM, Pauwels L.
The Arabidopsis bHLH transcription factors MYC3 and MYC4 are targets of JAZ
repressors and act additively with MYC2 in the activation of jasmonate
responses. Plant Cell. 2011;23(2):701–15.
99. Kazan K, Manners JM. MYC2: the master in action. Mol Plant. 2013;6(3):686–703.
100. Gasperini D, Chételat A, Acosta I, Goossens J, Pauwels L, Goossens A, Dreos
R, Alfonso E, Farmer EE. Multilayered organization of jasmonate signalling in
the regulation of root growth. PLoS Genet. 2015;11(6):e1005300.
Bahari et al. BMC Plant Biology
(2018) 18:377
101. Jakoby M, Wang HY, Reidt W, Weisshaar B, Bauer P. FRU (BHLH029) is
required for induction of iron mobilization genes in Arabidopsis thaliana.
FEBS Lett. 2004;577(3):528–34.
102. Rossi FR, Krapp AR, Bisaro F, Maiale SJ, Pieckenstain FL, Carrillo N. Reactive
oxygen species generated in chloroplasts contribute to tobacco leaf infection
by the necrotrophic fungus Botrytis cinerea. Plant J. 2017;92(5):761–73.
103. Lorenzo O, Piqueras R, Sánchez-Serrano JJ, Solano R. ETHYLENE RESPONSE
FACTOR1 integrates signals from ethylene and jasmonate pathways in plant
defense. Plant Cell. 2003;15(1):165–78.
104. McGrath KC, Dombrecht B, Manners JM, Schenk PM, Edgar CI, Maclean DJ,
Scheible WR, Udvardi MK, Kazan K. Repressor-and activator-type ethylene
response factors functioning in jasmonate signaling and disease resistance
identified via a genome-wide screen of Arabidopsis transcription factor gene
expression. Plant Physiol. 2005;139(2):949–59.
105. Khan NA, Khan MIR, Ferrante A, Poor P. Ethylene: a key regulatory molecule
in plants. Front Plant Sci. 2017;8:1782.
106. Idris AS, Kushairi D, Ariffin D, Basri MW. Technique for inoculation of oil
palm germinated seeds with Ganoderma. MPOB Inf Ser. 2006;314:1–4.
107. Sundram S, Meon S, Seman IA, Othman R. Symbiotic interaction of
endophytic bacteria with arbuscular mycorrhizal fungi and its antagonistic
effect on Ganoderma boninense. J Microbiol. 2011;49(4):551.
108. Prescott A, Martin C. A rapid method for the quantitative assessment of
levels of specific mRNAs in plants. Plant Mol Biol Report. 1986;4(4):219–24.
109. Conesa A, Götz S, García-Gómez J, Terol J. Blast2GO: a universal tool for
annotation, visualization and analysis in functional genomics research.
Bioinformatics. 2005;21(18):3674–6.
110. Vandesompele J, De Preter K, Pattyn F, Poppe B, Van Roy N, De Paepe A,
Speleman F. Accurate normalization of real-time quantitative RT-PCR data
by geometric averaging of multiple internal control genes. Genome Biol.
2002;3(7):research0034–1.
111. Kwan YM, Meon S, Ho CL, Wong MY. Selection of reference genes for
quantitative real-time PCR normalization in Ganoderma-infected oil palm
(Elaeis guineensis) seedlings. Australasian Plant Path. 2016;45(3):261–8.
112. Bustin SA, Benes V, Garson JA, Hellemans J, Huggett J, Kubista M, Mueller R,
Nolan T, Pfaffl MW, Shipley GL, Vandesompele J. The MIQE guidelines:
minimum information for publication of quantitative real-time PCR
experiments. Clin Chem. 2009;55(4):611–22.
Page 25 of 25