Voice of the customer capture and analysis
Bạn đang xem bản rút gọn của tài liệu. Xem và tải ngay bản đầy đủ của tài liệu tại đây (2.36 MB, 430 trang )
www.ebook3000.com
Voice of the Customer: Capture and Analysis
www.ebook3000.com
McGraw-Hill’s
Other Books inBiomedical
the Six Sigma
Engineering
Operational
Series
Methods Series
⋅
Parveen S. Goel, Rajeev Jain, and Praveen Gupta • Six Sigma for
HJORTSØ Population Balances in Biomedical Engineering:
Transactions
and Service
Segregation
through
the Distribution of Cell States
PANCHAPAKESAN
Six SigmaNanotechnology
Performance Handbook
Praveen Gupta • TheBiomedical
PETERS
Real-Time
Biomolecular
Simulations
Thomas McCarty, Lorraine Daniels, Michael Bremer, and
SARKODIE-GYAN
Devices:
The Six Sigma Black
BeltEngineering
Handbook
Praveen Gupta • Neurorehabilitation
Design, Measurement, and Control
• Lean
Six Sigma
Statistics Systems
Alastair Muir
WAITE
Biofluid
Mechanics
in Cardiovascular
Andrew Sleeper • Design for Six Sigma
⋅
⋅
⋅
⋅
Kai Yang • Design for Six Sigma for Service
www.ebook3000.com
Voice of the Customer:
Capture and Analysis
Dr. Kai Yang
New York
Chicago San Francisco Lisbon London Madrid
Mexico City Milan New Delhi San Juan Seoul
Singapore Sydney Toronto
www.ebook3000.com
Copyright © 2008 by The McGraw-Hill Companies. All rights reserved. Manufactured in the United
States of America. Except as permitted under the United States Copyright Act of 1976, no part of this
publication may be reproduced or distributed in any form or by any means, or stored in a
database or retrieval system, without the prior written permission of the publisher.
0-07-159341-1
The material in this eBook also appears in the print version of this title: 0-07-146544-8.
All trademarks are trademarks of their respective owners. Rather than put a trademark symbol after
every occurrence of a trademarked name, we use names in an editorial fashion only, and to the
benefit of the trademark owner, with no intention of infringement of the trademark. Where such
designations appear in this book, they have been printed with initial caps.
McGraw-Hill eBooks are available at special quantity discounts to use as premiums and sales
promotions, or for use in corporate training programs. For more information, please contact George
Hoare, Special Sales, at or (212) 904-4069.
TERMS OF USE
This is a copyrighted work and The McGraw-Hill Companies, Inc. (“McGraw-Hill”) and its licensors
reserve all rights in and to the work. Use of this work is subject to these terms. Except as permitted
under the Copyright Act of 1976 and the right to store and retrieve one copy of the work, you may not
decompile, disassemble, reverse engineer, reproduce, modify, create derivative works based upon,
transmit, distribute, disseminate, sell, publish or sublicense the work or any part of it without
McGraw-Hill’s prior consent. You may use the work for your own noncommercial and personal use;
any other use of the work is strictly prohibited. Your right to use the work may be terminated if you
fail to comply with these terms.
THE WORK IS PROVIDED “AS IS.” McGRAW-HILL AND ITS LICENSORS MAKE NO
GUARANTEES OR WARRANTIES AS TO THE ACCURACY, ADEQUACY OR COMPLETENESS OF OR RESULTS TO BE OBTAINED FROM USING THE WORK, INCLUDING ANY
INFORMATION THAT CAN BE ACCESSED THROUGH THE WORK VIA HYPERLINK OR
OTHERWISE, AND EXPRESSLY DISCLAIM ANY WARRANTY, EXPRESS OR IMPLIED,
INCLUDING BUT NOT LIMITED TO IMPLIED WARRANTIES OF MERCHANTABILITY OR
FITNESS FOR A PARTICULAR PURPOSE. McGraw-Hill and its licensors do not warrant or
guarantee that the functions contained in the work will meet your requirements or that its operation
will be uninterrupted or error free. Neither McGraw-Hill nor its licensors shall be liable to you or
anyone else for any inaccuracy, error or omission, regardless of cause, in the work or for any damages
resulting therefrom. McGraw-Hill has no responsibility for the content of any information accessed
through the work. Under no circumstances shall McGraw-Hill and/or its licensors be liable for any
indirect, incidental, special, punitive, consequential or similar damages that result from the use of or
inability to use the work, even if any of them has been advised of the possibility of such damages. This
limitation of liability shall apply to any claim or cause whatsoever whether such claim or cause
arises in contract, tort or otherwise.
DOI: 10.1036/0071465448
www.ebook3000.com
Professional
Want to learn more?
We hope you enjoy this
McGraw-Hill eBook! If
you’d like more information about this book,
its author, or related books and websites,
please click here.
www.ebook3000.com
ABOUT THE AUTHOR
Kai Yang, Ph.D., has wide experience in quality and reliability engineering.
The Executive Director of Enterprise Excellence Institute, a renowned quality
engineering organization based in West Bloomfield, Michigan, he is co-author of
the influential Design for Six Sigma: A Roadmap for Product Development. He
is also Professor of Industrial and Manufacturing Engineering at Wayne State
University, Detroit.
v
Copyright © 2008 by The McGraw-Hill Companies. Click here for terms of use.
www.ebook3000.com
This page intentionally left blank
www.ebook3000.com
For more information about this title, click here
Contents
Chapter 1. Value, Innovation, and the Voice of the Customer
1.1
1.2
1.3
1.4
1
Defining Customer Value
Innovation Roadmap
Voice of the Customer: Mining for the Gold
Overview of This Book
2
5
6
8
Chapter 2. The Product Development Process
9
2.1 Defining Product Cost and Development
2.1.1 Product Development Process Flowchart
2.2 The Product Development Process–End to End
2.2.1 Opportunity Identification and Idea Generation: Stage 0
2.2.2 Customer and Business Requirement Study: Stage 1
2.2.3 Concept Development: Stage 2
2.2.4 Product Design and Prototype: Stage 3
2.3 The Nature of Product Development: Information and
Knowledge Creation
2.3.1 Axiomatic Design
2.3.2 Design as an Information Production Factory
2.3.3 Information and Knowledge Mining
2.3.4 Information Transformation
2.3.5 Information and Knowledge Creation
2.3.6 The Ideal Product Development Process
2.4 Customer-Value–Based Lean Product Development Process
2.4.1 Lean Operation Principles
2.4.2 Waste Elimination in Process
2.4.3 Value-Stream Mapping
2.4.4 One-Piece Flow
2.4.5 Pull-Based Production
2.4.6 Lean Principles for Product Development
2.4.7 Mining the Voice of the Customer to Capture Value
2.4.8 Maximizing Technical Competence
2.4.9 Front-Loading the Product Development Process
2.4.10 Optimizing Information Transformation and Flow
2.4.11 Creating a Lean Product
9
13
14
14
17
18
25
33
35
43
45
53
56
60
64
64
65
66
68
70
71
74
75
76
78
86
vii
www.ebook3000.com
viii
Contents
Chapter 3. Customer Value and the Voice of the Customer
89
3.1 Customer Value and Its Elements
3.1.1 Value and Other Commonly Used Metrics
3.1.2 The Versatility and Dynamics of Value
3.2 Customer Value Analysis
3.2.1 Market-Perceived Quality Profile
3.2.2 Market-Perceived Price Profile
3.2.3 Customer Value Map
3.2.4 Competitive Customer Value Analysis
3.3 Customer Value Deployment
3.4 Evolution of Customer Values—Blue Ocean Strategy
3.4.1 Formulating a Blue Ocean Strategy
3.5 Customer Value and the Voice of the Customer
3.6 Capturing the Voice of the Customer
3.6.1 Plan for Capturing the Voice of the Customer
91
94
95
97
98
102
104
107
109
111
116
123
126
127
Chapter 4. Customer Survey Design, Administration, and Analysis
4.1 Customer Survey Types
4.1.1 Mail-Out Surveys
4.1.2 In-Person Interviews
4.1.3 Telephone Surveys
4.1.4 Other Methods of Gathering Information
4.2 Stages of the Customer Survey
4.2.1 Stage 1: Establish Goals and Objectives of the Survey
4.2.2 Stage 2: Set the Survey Schedule and Budget
4.2.3 Stage 3: Establish an Information Base
4.2.4 Stage 4: Determine the Population and Sampling Frame
4.2.5 Stage 5: Determine Sample Size and Selection Procedure
4.2.6 Stage 6: Design the Survey Instrument
4.2.7 Stage 7: Pretest the Survey Instrument
4.2.8 Stage 8: Select and Train Survey Interviewers
4.2.9 Stage 9: Implement the Survey
4.2.10 Stage 10: Analyze the Data and Report
4.3 Survey Instrument Design
4.3.1 Close-Ended Questions
4.3.2 Open-Ended Questions
4.3.3 The Wording of Survey Questions
4.3.4 Order of Questions in Surveys
4.3.5 Questionnaire Length
4.4 Administering the Survey
4.4.1 Administering Mail-Out Surveys
4.4.2 Administering Telephone Surveys
4.4.3 Administering In-Person Surveys
4.5 Survey Sampling Method and Sample Size
4.5.1 Population and Sampling Frame
4.5.2 Sampling Methods
4.5.3 Sample Size Determination
4.6 Internet Surveys
4.6.1 Drawing People to the Internet-Based Survey
www.ebook3000.com
133
133
134
134
135
135
136
137
138
138
139
139
139
140
140
140
140
141
141
144
144
145
147
147
147
148
148
148
149
150
153
157
158
Contents
4.6.2 Administering a Survey on the Internet
4.6.3 Comparing Paper-Based Surveys with Internet Surveys
Chapter 5. Proactive Customer Information Gathering—
Ethnographic Methods
5.1 What Are Ethnographic Methods?
5.1.1 Frequently Used Ethnographic Methods
5.1.2 Data Recording Methods
5.1.3 Types of Ethnographic Research Used in Product Development
5.1.4 Key Winning Factors for Ethnographic Methods
5.2 Ethnographic Research Project Planning
5.2.1 Determining Research Objectives
5.2.2 Recruiting Informants
5.2.3 Selecting Research and Data Collection Methods
5.2.4 Developing the Ethnographic Research Team and
Ground Rules
5.3 Ethnographic Project Execution
5.3.1 Ethnographic Interviews and Documentation
5.3.2 Ethnographic Observations in Shops
5.3.3 Ethnographic Observations in Product Usage Processes
5.3.4 Ethnographic Studies of Customer Cultures
Chapter 6. VOC Data Processing
ix
162
166
169
171
173
174
175
177
178
178
180
185
189
191
191
196
198
203
213
6.1 Types of VOC Data
6.2 Analyzing VOC Data
6.2.1 Methods of Analyzing VOC Data
6.2.2 Affinity Diagram—KJ Method
6.3 Quantitative VOC Data Analysis
6.4 Critical-to-Quality Characteristics (CTQ)
213
214
214
214
221
223
Chapter 7. Quality Function Deployment (QFD)
229
7.1 History of QFD
7.2 QFD Benefits, Requirements, and Practicalities
7.3 QFD Methodology Overview
7.3.1 Customer Attributes (WHATs)
7.3.2 CTSs (HOWs)
7.3.3 Relationship Matrix
7.3.4 Importance Ratings
7.3.5 Planning Matrix
7.3.6 CTS Correlation (HOWs Correlation)
7.3.7 Targets and Limits (HOW MUCH)
7.3.8 Competitive Benchmarks
7.4 Kano Model of Quality
7.5 QFD Analysis
7.6 Example 7.1 Information System Design
7.6.1 Ranking Customer Input
7.6.2 Ranking the Functional Requirements
7.7 QFD Case Study 1: Global Commercial Process Design
7.7.1 QFD Steps
7.7.2 The HOWs Importance Calculation
7.7.3 Phase I QFD Diagnostics
231
231
232
234
235
235
237
237
238
238
239
239
240
241
241
243
244
245
248
249
x
Contents
7.8 QFD Case Study 2: Yaesu Book Center
7.8.1 Determine Customer Attributes (WHATs)
7.8.2 Determine Quality Characteristics (HOWs)
7.8.3 Assign Degree of Importance to Customer Attributes
7.8.4 Determine Operations Items
7.8.5 Two-Phase QFD Analysis for Yaesu Book Center
Chapter 8. Customer Value Creation by Brand Development
8.1 The Anatomy of Brands
8.1.1 People’s Buying Behavior and Brands
8.1.2 Brand Identity
8.1.3 Brand Equity
8.2 Brand Development
8.2.1 Key Factors in Brand Development
8.2.2 The Brand Development Process
8.2.3 Strategic Brand Analysis
8.2.4 Brand Strategy Development
8.2.5 Brand Implementation
8.2.6 Brand Evaluation
Chapter 9. Value Engineering
9.1 An Overview of Value Engineering
9.1.1 Collecting Information and Creating Design Alternatives
9.1.2 Evaluating, Planning, Reporting, and Implementing
9.1.3 The Job Plan
9.2 Information Phase
9.2.1 Information Development
9.2.2 Function Determination
9.2.3 Function Analysis and Evaluation
9.3 Creative Phase
9.3.1 Brainstorming
9.4 Evaluation Phase
9.4.1 Relatively Simple Evaluations
9.4.2 More Complex Evaluations
9.4.3 Selection and Screening Techniques
9.5 Planning Phase
9.6 Reporting Phase
9.7 Implementation Phase
9.7.1 Setting a Goal
9.7.2 Develop An Implementation Plan
9.8 Automobile Dealership Construction (Park 1999)
9.9 Engineering Department Organization Analysis (Park 1999)
Chapter 10. Customer Value Creation Through Creative Design (TRIZ)
10.1 Theory of Inventive Problem Solving (TRIZ)
10.1.1 What Is TRIZ?
10.2 TRIZ Fundamentals
10.2.1 Function Modeling and Analysis
10.2.2 Use of Resources
251
254
255
255
255
255
259
262
262
264
275
277
278
281
283
287
293
293
297
298
298
300
300
300
301
306
314
328
328
329
330
331
332
335
336
337
338
338
339
341
345
345
347
349
349
353
Contents
10.2.3 Ideality
10.2.4 Contradictions
10.2.5 Evolution
10.3 The TRIZ Problem-Solving Process
10.3.1 Problem Definition
10.3.2 Problem Classification and Tool Selection
10.3.3 Problem-Solution Generation
10.3.4 Problem Concept Evaluation
10.4 Technical Contradiction Elimination and Inventive Principles
Chapter 11. Statistical Basics and Six Sigma Metrics
11.1 Six Sigma and Data Analysis
11.2 Descriptive Statistics
11.2.1 Dot Plot
11.2.2 Histogram
11.2.3 Box Plot
11.2.4 Numerical Descriptive Statistics
11.3 Random Variables and Probability Distributions
11.3.1 Discrete and Continuous Random Variables
11.3.2 Expected Values, Variance, and Standard Deviation
11.3.3 Probability Distribution Models
11.3.4 Statistical Parameter Estimation
11.4 Quality Measures and Six Sigma Metrics
11.4.1 Process Performance
11.4.2 Process Capability Indices
11.4.3 Sigma Quality Level (Without Mean Shift)
11.4.4 Sigma Quality Level (With Mean Shift)
xi
354
355
357
360
360
362
363
363
363
379
379
380
380
380
382
382
386
386
387
388
391
392
392
393
395
396
References
399
Index
403
This page intentionally left blank
Chapter
1
Value, Innovation, and the
Voice of the Customer
In today’s global economy, several business functions have become global
commodities and subject to stiff price competition: first manufacturing
activities, then IT, and most recently traditional R&D, such as routine
engineering design work. To find success in this competitive reality, your
business needs to take the high ground in value creation. Value is a measure of how much the customer really appreciates a product or service,
and how much customers are willing to purchase this product or service.
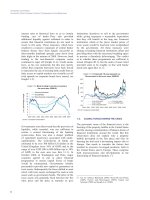
In Figure 1.1, you can see that there are some legendary products or
services, such as Hollywood movies, Intel CPUs, and Microsoft operating systems, that solidly command the market place—these products
creates enormous profits for their companies.
Figure 1.1 reveals the secrets of how these products and companies
create value. There are two success models for companies to create high
values. One type of company has a commanding lead either in technology
or brand recognition. Their products or brands dominate the marketplace and become industry standards. Examples of this kind of company
include Microsoft, Intel, Cisco, Google, and so on. The driver for value creation for this type of company is technical or brand dominance, or technology-driven innovation. The other type of company develops products
or services that capture the heart of customers; examples of this kind of
companies or products include Starbucks and Apple’s iPod. The driver
for value creation for this type of company is customer-centric innovation. However, these two types of companies or products are few; most
companies are mediocre in both technical or brand dominance and customer value position. However, in order to survive in the global economy
of the 21st century, it is wise for a company to excel in at least one of the
above two aspects; that is, either the technical/ brand dominance, or the
1
Copyright © 2008 by The McGraw-Hill Companies. Click here for terms of use.
2
Chapter One
Value level
Value level
Innovative
companies
Technical/brand
dominance
Most
companies
Microsoft operation
systems
Customer-centric
innovation
Starbucks
iPod Nano
Intel CPUs
Figure 1.1 Value and innovation
customer-centric innovation. In both aspects, thorough understanding
of voice of the customer is very important. The main topic of this book is
about the voice of the customer (VOC). I will discuss thoroughly the role
of voice of the customer in these two success models.
1.1
Defining Customer Value
In the two aforementioned successful models, the real key for success is
that the product or brand brings exceptional value to customers, so that
many customers crave the product and are willing to pay good prices.
In this subsection, the following issues are discussed:
What is value and how do you create it? What is the role of value for long
term commercial success?
Profitability is one of the most important factors for long term commercial success. High profitability is determined by strong sales and
overall low cost in the whole enterprise operation. It is common sense
that:
Business profit = Revenue – Cost
In addition:
Revenue = Sales volume × Price
Here, price means “sustainable price,” that is, the price level that
customers are willing to pay. Many researchers (Sheridan 1994, Gale
1994) have found that both sales volume and sustainable price are
mostly determined by customer value—customers’ opinions determine
Value, Innovation, and the Voice of the Customer
3
a product’s fate. Customers’ opinions will decide the price level, the size
of the market, and the future trend of this product family. A product that
has high customer value is often featured by increasing market share,
increasing customer enthusiasm towards the product, word of mouth
praise, reasonable price, and a healthy profit margin for the company
that produces it, as well as increasing name recognition.
Sherden (Sherden 1994) and Gale (Gale 1994) provided a good definition for customer value. In their assessment, customer value is defined
as perceived benefit (benefits) minus perceived cost (liabilities):
Customer Value = Benefits – Liabilities
Here the benefits are the factors that increase the customer value,
and the liabilities are the factors that decrease the customer value.
Benefits in this equation include the following categories:
Functional benefits This category includes the actual benefits of
a product or service delivered to customers. In other words, functional
benefits are “what the product or service does for customers”. For example,
the functional benefits of a food item include “providing energy, providing nutrition, providing taste” and so on. For investment services, the
functional benefits include economic benefits and revenue to customers.
The reliability, quality and durability of the product are also part of
functional benefits. For example, a kitchen knife delivers the function of
“cutting food”. In comparing a high quality knife with a low quality knife,
both of them can cut food, but the high quality knife can cut better, last
longer, so it will deliver more functional benefits.
Psychological benefits In addition to functional benefits, psychological benefits are a very important component for a product or
service. A very obvious example is that a plain color T-shirt will sell at
much lower price than that of a T-shirt with a famous logo. A famous
logo will give customers emotional and self-expression benefits on top
of the regular T-shirt’s functional benefit, “covering body”. Brand image
is also a part of psychological benefit. A known good brand brings confidence to customers about products quality, reliability and durability. A famous brand may even raise customers’ social status, such as
a Mercedes Benz car. If a product is the first of its kind, it usually
brings psychological awe to customers, such as the first copy machine. A
“first-of-its-kind” product will usually command a high price and often
create a brand name. Competitions in the market place also brings
psychological effects into customers’ value judgments, if there are many
competitors producing the same or similar a product, that usually will
create a perception that this product is a commodity and it doesn’t carry
much value.
4
Chapter One
Service and convenience benefits This category includes availability, which is the ease of accessing the product or service; it also
includes service, which is the ease of getting help in case of product
problems or failure.
Liabilities in this equation include the following categories:
Economic liabilities This category includes all monetary expenses
incurred for owning the product or service. The price that a customer
pays in order to buy the product or service is certainly a major part
of economic liabilities. But, in addition to the price of the product or
service, there are many other indirect ownership costs associated with
owning this product or service, which include:
■
Acquisition costs: This includes transportation cost, shipping cost,
time and efforts spent to obtain the service
■
Usage costs: This includes additional cost to use the product or service
in addition to the purchase price, such as installation, training cost,
and so on.
■
Maintenance costs: This includes repair cost, routine maintenance
costs, regular upgrades and so on.
■
Ownership costs: This includes financing cost, licensing cost and so on.
■
Disposal costs: This includes disposal cost of hardware, environmental
regulation compliance cost and so on.
Psychological liabilities This category includes the negative psychological effects of the product or service. An unknown brand name
may make a customer feel uncertain about the dependability of the
product or service. A “cheap brand” may cause self-esteem liability for
some customers. A poorly performed product or service not only delivers
low functional benefits, but will also make the customer feels bad.
Service and convenience liability This category includes all the
negative effects related to service and convenience. Even if the original
product is very good, lack of service, or poor service will use customer
issues when the product encounters problems. For example, lack of
repair facilities, high cost of spare parts and high repair cost are among
the major concerns for some potential buyers of foreign made cars. Poor
availability, such as long delivery time, is also an example of service and
convenience liability.
This customer value definition is comprehensive, and explains what
types of product or services that customers are willing to pay a premium
price to buy.
There are numerous cases where customers are willing to pay a higher
price to buy a product with better brand name image, because brand
name image is a psychological benefit for the customer. Toyota and
Value, Innovation, and the Voice of the Customer
5
General Motors have a joint venture in California that produces an
identical car model. Some of the units have a Toyota brand, and some
have a GM brand; however, the units with the Toyota brand can sell for
a few hundreds dollars more than the identical cars with the GM brand,
because the public perception is that Toyota has the preferable brand
image. Brand name image is an important portion of customer value.
As another example, a neighborhood store will sell an item at higher
prices than the identical item in discount chain stores. This is because
of the perceived convenience in obtaining these items in neighborhood
stores. This is a part of the service and convenience benefit defined in
customer value.
Therefore, to gain business profit, creating products with high customer
value is a must. Many business enterprises often fail to see the multiple
aspects of customer value. They may create a product with tremendous
functionality, but one that is very poor in customer service, accessibility,
and psychological aspects, and therefore, the product will fail.
In a competitive marketplace, success will become more difficult to
achieve. Your competitors can learn from and copy your product, learn
your customer value proposition, and ultimately offer a similar product
at a lower price. There are also disruptive innovations, which change
the whole landscape of the competitive situation. Thus, achieving a
high value position is becoming more and more a moving target. For
example, video renting stores, such as Blockbuster, were everywhere in
the United States and their business was very good. With the emergence
of Internet downloading and Internet-based video rental businesses,
such as Netflix, video rental stores lost a lot of their attractions to customers. Blockbuster has suffered huge losses in recent years. Another
example is the sport utility vehicles (SUVs) made by American automobile manufacturers. SUVs helped GM, Ford, and Chrysler a lot in their
revenue and profitability in 1990s and early 2000s. However, with the
drastic improvement of fuel efficiency of Toyota vehicles, such as Prius,
and a surge of gasoline prices in the years 2005 to 2006, Ford and GM
lost a big chunk of the automobile market share due to the consumers’
abandonment of SUVs and Trucks.
In any case, the key to value creation is the trend-setting innovation,
either technology-driven innovation or a customer-centric innovation,
because innovation will change the rules of game, and if you do it right,
it will put you on the top of the competition. If you are a business leader,
then you have to learn how to lead innovation. You will need to lead this
kind of innovation many times in your business tenure.
1.2
Innovation Roadmap
What is innovation? What are the key factors for successful innovation?
Based on Amabile et al (1996), “All innovation begins with creative ideas . . .
6
Chapter One
We define innovation as the successful implementation of creative ideas
within an organization. In this view, creativity by individuals and teams
is a starting point for innovation; the first is necessary but not sufficient
condition for the second.”
Specifically, innovation has two aspects. One is creativity; better creativity generates out-of-the-ordinary ideas to create “first-of-its-kind”
products. Another aspect of creativity is to make new ideas into commercial successes.
In developing innovative products or services, there are two kinds of
driving forces. The first is the technology push; the phenomenal development of the IT industry from the 1990s up to now started with new
technological breakthroughs—take Microsoft and Google for example.
The other driving force is customer or market pull; this innovation is
usually started by discovering a hidden market need. Starbucks and the
iPod are such examples. Starbucks is not simply a regular coffee shop;
its vision is to become someplace other than home and the workplace.
It not only provides coffee, but also provides a casual meeting places,
free electrical outlets, and wireless Internet access.
The driver for technological push innovation is creativity and the ability to generate new ideas, and connecting this innovation with customer
and market needs. The driver for customer-centric innovation is the
ability to discover a hidden market. You need great vision to discover
some hidden unmet customer need and accurately identify a customer
value proposition, that is, what things customers really crave. In both
technology push and market pull innovative product development scenarios, capturing the voices of customers, especially the unarticulated
voice of the customers, is really a key factor. A creative mind may bring
new ideas, but a new idea alone is not enough; the new idea needs to
catch customers’ hearts. Without knowing the real voice of the customer,
you cannot catch the customers’ heart, so you cannot succeed.
Another key factor for successful innovations is an effective product
development process. You need an effective product development process
to make creative ideas and customer-centric innovation into products
at low cost and with high quality.
Finally, innovation is not only a product and technology matter.
Business model, brand strategy, services, and so on are all parts of
a grand road map for innovation.
1.3 Voice of the Customer:
Mining for the Gold
In the previous section, I discussed the key factors for value-based innovation. Clearly, capturing the voice of the customer is a very important
www.ebook3000.com
Value, Innovation, and the Voice of the Customer
7
factor, whether you are dealing with a technology push-or-market pull
oriented product or service development.
If you had some magic power and were able to discover exactly what
customers are craving, and if you also knew how to produce their
dream product at a low price, then you would be guaranteed to get
rich! Therefore, capturing the exact voice of the customer is like striking gold.
Of course, this kind of lucky chance is very rare. In the natural world,
you need to mine for gold. You need to explore and search. Sometimes
you find bits and pieces of gold mixed into other minerals, which you
then need to distill and purify to get pure gold. The same is true for the
voice of customer. You need to search for a good source of customer information by finding bits and pieces. The real voice of customer may hide
deep in the customer’s mind, and many customers are humble people.
If you only use traditional customer data collection methods, you may
only get inaccurate and incomplete information. It takes a lot of effort
and sophisticated methods to mine the voice of the customer accurately
and distill this VOC information into valuable inputs for the product
development process.
What strategy and methods for voice of customer capturing and analysis that we use depends very much on what this VOC information is
used for. The purposes for the voice of customer information capturing
and analysis are the following:
■
You need the right kinds and sufficient amount of accurate voice of
customer information to provide necessary inputs for all stages and
levels of the product design work. The stages include product design
and manufacturing process design, and the levels refer to the system
level, subsystem level, and component level.
■
You need a good set of VOC information to learn what are the key
customer value factors for this kind of product; what factors, such as
price and functions or really excite customers; and what the product’s
customer value position is.
■
You may need to explore the possibility of shifting your current customer value proposition to another one, so you can develop a new
innovative product that is different from competitors. In this case,
you need to capture enough VOC information for decision making.
■
We may want to capture the right kinds and a sufficient amount of voice
of customer information to provide necessary inputs for product improvements in limited scope, instead of a complete new product design.
This book will show you how to capture and analyze the voice of the
customer in all these four scenarios.
8
1.4
Chapter One
Overview of This Book
Since VOC capturing and analysis is a very important part of the product
development process, we will not cover the process of VOC capturing and
analysis in isolation. Chapter 2 discusses all aspects of product development processes. I’ll cover some state-of-the-art product development
theories and advanced product development processes. During this discussion, the roles of VOC capturing and analysis in the product development process are thoroughly discussed. After reading this chapter, you
should have a good idea of how voice of customer information can help
your product development process, and what kinds and what amount of
VOC information are really needed for this.
Chapter 3 discusses issues related to the customer value. Because the
customer value position determines the market position of the product,
you need to know about the relationship between VOC and customer
value, and how to obtain key customer value information from VOC.
I will also discuss how a customer value position can be modified to
create a new product market position; this strategy is called the “blue
ocean strategy” (Kim and Mauborgne 2005). Chapter 3 also discusses
how to link VOC information to product design specifics in a very clear
and exact manner.
Chapter 4 discusses conventional VOC capturing methods, including
customer surveys, interviews, and Internet surveys, in great detail.
Chapter 5 discusses an anthropology-based VOC capturing method, the
ethnographic method. Because this VOC capturing method can capture
hidden, unarticulated VOC information much better than conventional
VOC capturing methods, it is becoming very popular and many customercentric innovation practices are heavily relying on the ethnographic
method. In this chapter, I give very detailed descriptions of the method
and provide several examples and case studies.
Chapter 6 explains how to process raw voice of customer data and
transform them into clearly defined customer data. Chapter 7 discusses
the method of quality function deployment (QFD). The QFD method is
a systematic method to transform VOC data into product functional
requirements, and then design specifications. This method serves as the
interface between VOC data and the product design process.
Customer value creation and improvement is related to other methodologies, such as brand development (Chapter 8), value engineering
(Chapter 9), and the theory of inventive problem solving (Chapter 10).
These methodologies are thoroughly discussed in the relevant chapters.
The last chapter, Chapter 11, provides some necessary background in
statistics.
Chapter
2
The Product Development
Process
This book is about how to capture and analyze the voice of the customer.
However, the major purpose of capturing and analyzing the voice of the
customer is to provide vital input for the product development process.
In order to derive the best approach to capturing and analyzing the voice
of the customer, you need to know how the product development process
really works. This chapter will provide you with that information. I’ll
introduce the key stages in production development and then discuss
the first four stages in detail. I’ll then discuss the nature of the product
development process from an information perspective. You’ll learn about
the development and evolution of the theories and best practices for the
product development process. You’ll discover the leading framework for
the product development process, called the lean product development
process. Finally, I’ll discuss the relationship between the voice of the
customer and the product development process.
2.1
Defining Product Cost and Development
A product is anything that can be offered to a market that might satisfy a want or need. A product is one of two types: tangible (physical) or
intangible (nonphysical). Tangible products are what most people think
products are; examples of tangible products include bicycles, laptop
computers, printer paper, cars, and airplanes. Intangible products are
related to service industries, for example, vacation packages, insurance
policies, and medical treatment.
Every product is sold in the market for a price. For good products, the
customers are willing to pay higher prices. The prices that customers are
willing to pay depend on a supply-and-demand relationship. How much
9
Copyright © 2008 by The McGraw-Hill Companies. Click here for terms of use.
10
Chapter Two
the customers will demand a certain product depends on the value of the
product. Based on the research of Sherden (1994) and Gale (1994), the
value of the product can be expressed as the following equation:
Value = Benefits – Liabilities
Because the customers are really buying the benefits offered by a
product, not just the physical entity of the product, in a real marketplace,
the product itself, or generic product, could be bundled with everything
that is needed to deliver the benefits to customers. This bundle is called
the whole product. The whole product typically augments the generic
product with training and support, manuals, cables, additional software,
online help, warranty, installation instructions, professional services, and
so on. The concept of the whole product is illustrated in Figure 2.1.
As this analysis shows, customers demand products purely for their
benefits. The liabilities, such as the prices they have to pay to buy the
products, are necessary evils that customers have to live with. For a
product, if the gap between benefits and liabilities is large, then customers will perceive that the benefits they get from the product are much
larger than the liabilities they have to accept, and the product will sell
quickly and easily. Besides the benefits offered by the product, market
competition can also greatly affect the selling of the product. The supplyand-demand equation is very different in a competitive environment,
with one supplier versus multiple suppliers. Competition will increase
the supply of the same or similar products, which will give customers
more choices. Competitors can also offer products with the same or better
values for their products, by offering more benefits, having lower liabilities (mostly lower prices), or both. The product with a better value will
take more market share. When competition in the marketplace becomes
fierce, one common tactic is to reduce the selling price of the product in
order to improve the product’s value position in the marketplace and
Procedures
Installation
Generic
product
Support
Training
Additional
software
Figure 2.1 The Whole Product
The Product Development Process
11
Products
Core Operation
Impetus
Ideation
Concept
development
Design
Production
Sales/service
BUSINESS PROCESSES
BUSINESS MANAGEMENT
SUPPLIER MANAGEMENT
INFORMATION TECHNOLOGY
Figure 2.2 Business Operation of Product Producing Companies
keep the market share. However, there is a limit to how much you can
lower the price—the limit is the cost of providing the product, because
the selling price has to be higher than cost in order to make a profit.
Figure 2.2 illustrates how a typical product is produced. There is
always a core operation, which consists of the product development
and the actual production of the product. There are also other business
operations, however, such as marketing, finance, personnel, and so on.
From Figure 2.2, you can see that the cost of providing a product has
the following components:
■
Cost of product development
■
Cost of production
■
Cost of running supporting operations
Besides these three cost components, the success of the product development and production system also depends on other factors, such as
the quality and value of the product, the time to market, and so on. The
economic model for a product development and production system is
illustrated in Figure 2.3.
The ultimate goal for any product development and production system
is to make a profit, and the profit is the output of the system. There are
three important inputs in the system:
■
Cost The total cost includes the product development cost, production cost, and the cost of running supporting operations. Lower costs
lead to higher profit.