Stand structure and growth pattern of deodar (Cedrus deodara Roxb. Loud) forests of western Himalaya (India)
Bạn đang xem bản rút gọn của tài liệu. Xem và tải ngay bản đầy đủ của tài liệu tại đây (278.28 KB, 9 trang )
Int.J.Curr.Microbiol.App.Sci (2018) 7(7): 1737-1745
International Journal of Current Microbiology and Applied Sciences
ISSN: 2319-7706 Volume 7 Number 07 (2018)
Journal homepage:
Original Research Article
/>
Stand Structure and Growth Pattern of Deodar (Cedrus deodara Roxb.
Loud) Forests of Western Himalaya (India)
V.C. Prahlad*
Department of Silviculture and Agro-forestry, College of Horticulture and Forestry, Jhalawar
(Agriculture University, Kota) 326 023 (Raj.), India
Corresponding author
ABSTRACT
Keywords
Basal area, Green
felling, Growing
stock, Periodic
blocks, Stand
structure, Stem
density
Article Info
Accepted:
15 June 2018
Available Online:
10 July 2018
Study on structure and growing Stock of deodar stands of Himalayan forests under existing
mute silvical treatments due to imposed ban on green felling revealed that stem density
(N/ha) varied in increasing order 277.8, 390,484.4 and 816.7 under PBI, II, III and IV
approves the principle of allotment of PBs as per the crop age. Regenerated block PBIV,
obviously supports more density. Whereas, diameter at breast height (cm) was found
increasing from 21.11 cm in PBIV 30.01 cm in PBIII 44.64 cm in PBII and 57.37 cm in
PBI and maximum mean diameter of the site reported 40.34 cm in Cheog (S 3). Diameter
performance shows smaller diameter trees with higher stem density in PBIV and higher
diameter trees in PBI with less stocking. Good soil depth and less disturbances compared
to other sites be added substantiation for significant diameter performance at S 3. Mean tree
height showed significant variation with 26.67 m at S3 and 31.88 m in PBI. Tree height
differentiation indicates the level of competition with neighbor resulting differentiated use
of vertical space as well as varying pattern of crown size formation with respect to density
for light requirements in these stands. Trees on good site quality grow taller than on poor
ones. Highest mean basal area 70.95 m2/ha obtained in PBI and lowest 34.02 m2/ha in
PBIV and at site level highest 56.38 m2/ha at S3 and lowest 44.62 m2/ha at Habban (S1)
respectively. Form factor performance showed significant variation both at site and their
interaction level with minimum 0.219 taper at Chail (S2) and interaction level maximum
0.363 taper at S1B2 and minimum 0.207 at S2B2. The total growing stock (stem volume/ha)
showed significant variation for PBs only where PBI (640.44 m3 / ha) > PBII(492.24
m3/ha) > PBIII (381.88 m3/ha) > PBIV (205.79 m3/ha) respectively.
Introduction
Stand structure has been defined as the
horizontal and vertical distribution of
components of a forest stand including the
height, diameter, crown layers and stems of
trees, shrubs, herbaceous understorey, snags
and coarse woody debris (Helms1998).
Further, the composition and spatial variability
of forest structure is a major focus of forest
ecological study as it relates to functional
attributes as basal area increment in young
1737
Int.J.Curr.Microbiol.App.Sci (2018) 7(7): 1737-1745
trees increases until their maximum usable
growing space is reached (Assmann, 1970).
Natural and manmade interventions alter the
forest structure and composition, thus
knowledge of stand dynamics supports
decision making. Ishi et al., (2004) reported
that simplification of stand structure diminish
ecosystem functions and biodiversity services.
Stand structure has been defined as the
horizontal and vertical distribution of
components of a forest stand including the
height, diameter, crown layers and stems of
trees, shrubs, herbaceous understorey, snags
and coarse woody debris (Helms 1998).
However, ecosystem functions of biodiversity
can be enhanced by managing forests for
increased structural complexity. Silviculture
interventions directed at the production of
timber crops is pointless without the crops can
be harvested and utilized profitably.
Improperly managed forest forms too dense or
too sparse stand condition results detrimental
forest growth. To achieve the sustainability of
forest existence of normal forest is a
prerequisite (Avery and Burkhart 1983).
Continued deforestation and forest degradation
(Joshi et al., 2001) perceived as evidence of
management and policy failures to provide
sustainable timber supply and environmental
protection ban on green felling has been
imposed in the state after 1985, and then
silvicultural treatments and other stand
management practices are defunct and no
information available on impact of this ban on
deodar forest’s structure and productivity. As a
result, deodar (Cedrus deodara (Roxb.) Loud)
being one of the most important naturally
durable
western
Himalayas
managed
commercial timber species under uniform
system or its modification like Punjab
shelterwood system, selection or its modified
form (Anon 1985) stand treatments are
standstill. More so, in absence of forest
extraction and mute silvical plans employing
precise stand treatments to smoothened out
irregularity should receive attention. This,
investigation is an attempt in describing
structural and growth aspects of deodar forests
viz., density (trees/ ha), total basal area (m2/ha)
and growing stock (m3/ha).
The Indian Himalayan region occupies a
special place in the mountain ecosystems of
the world. Considering this India’s National
Action Plan on Climate Change (GOI 2008)
has made special provision of a National
mission for Sustaining Himalayan Ecosystem.
Himachal Pradesh (H.P) is a mountainous
state consequently its climate is more
congenial to forests. The forest vegetation in
the Himalayan region ranges from tropical dry
deciduous forests in the foothills to alpine
meadows above timberline (Champion and
Seth 1968). Physiographic zone-wise, the
Western Himalayan region in the country
alone contributes 1008 mi cu m of Growing
stock inside forest area out of the total 4173
mi cu m of which 325.36 mi cu m volume of
growing stock decreased between the year
2011 to 2013 is almost equivalent to the
growing stock in the forests of Himachal
Pradesh state (FSI 2013).
Materials and Methods
Study area and methodology
Location and stand selection
This study was undertaken in the year 2010-13
in selected natural pure deodar stands of Cedrus
deodara to assess the density and basal cover
pattern and its distribution in different diameter
class under different site conditions in parts of
temperate forests from western Himalayan
regions of Himachal Pradesh (India). For this,
three locations, Habban (S1), Chail (S2) and
Cheog (S3) forest range/administrative units
were selected (Table 1). At each location
randomly three replication with plot size 0.1 ha
(20 × 50 m) in four Periodic blocks (PBs) or
erstwhile managed conventional management
units (PBI (B1), PBII (B2), PBIII (B3) and PBIV
(B4) were laid out (Table 1).
1738
Int.J.Curr.Microbiol.App.Sci (2018) 7(7): 1737-1745
Stand measurement
Partial enumeration was carried out for stand
growth assessment according to the standard
forest mensuration practices. After thorough
inspection, trees falling under each site were
enumerated to determine the stand density as
number of plants per hectare and were
arranged in diameter classes of 10 cm classwidth. In all the plots, the stem diameter (cm)
at breast height (1.37 m above ground level)
was measured with the help of tree caliper.
Basal area refers to the cross sectional area of
the stems and calculated by using following
relation:
Where, d Diameter (cm). Further, Total Basal Area was
assessed by considering the sum of the
product of number of trees to the cross
sectional area of the stems in each diameter
class. The height of the tree was measured
with the help of Spiegel Relaskop and is
expressed in meters. The form factor was
calculated separately for each diameter class
using the formula given by Bitterlich (1984).
Where, ff - Form factor, h1 Height (m) at which diameter is half of the
dbh, h - Total height (m) of the tree. Growing
stock or Volume of standing trees was
calculated by Pressler’s (1865) formula
Where, V-Volume
(m ), d -Diameter at breast height (cm), h-Tree
height (m) and ff-Form factor. and expressed
in cubic meters. Further, the volume per
hectare was calculated by multiplying the
mean volume with number of trees in
respective diameter classes per hectare.
3
Results and Discussion
The site and periodic block wise stem density
(N/ha) showed (Table 2) the significant
variation in different periodic block level
when compared among sites which varied in
increasing order 277.8, 390,484.4 and 816.7
N/ha under PBI, II, III and IV respectively.
PBIV stands significantly differ from other
three PBs but, there is no significant variation
among PBIII and PBII, PBII and PBI. The
mean of stem density among sites were
insignificant with values 453.3,465 and 558.3
N/ha in S3, S1 and S2 respectively. The
diameter at breast height (cm) was found
increasing from 21.11 cm in PBIV 30.01 in
PB III 44.64 cm in PBII and 57.37 cm in PBI.
The mean diameter of the site was
insignificant; however, the maximum mean
diameter reported was 40.34 cm in S3. With
reference to mean diameter of the trees, the
interaction between site and periodic block
was also found significantly different.
Further, mean tree height (m) shown
significant variation for different site and PBs
with maximum value at S3 (26.67 m) and in
PBI (31.88 m).The performance at site levels
shows that S3 varies significantly with other
two sites in an order S3>S1>S2 but, found no
significant variation between S2 and S1. In
contrast all PBs differ significantly with each
other. In current study highest (70.95 m2/ha)
mean basal area/ha obtained in PBI followed
by PBII (61.74 m2/ha), PBIII (45.76 m2/ha)
and PBIV (34.02 m2/ha) respectively. Further,
PBII varied significantly with PBIII but there
was no significant variation between PBI and
PBII and PBIII and PBIV. However, at site
level highest basal area/ha was reported at S3
(56.38 m2/ha) followed by S2 (58.35 m2/ha)
and lowest at S1 (44.62 m2/ha) (Table 2).
Form factor performance showed significant
variation both at site and their interaction level
with minimum taper at site level S2 (0.219).
The interaction level for the said parameter
between site and PBs showed the maximum
taper at S1B2 (0.363) and minimum at S2B2
(0.207).
Whereas,H1
found
varying
significantly at site, PBs and their interaction
levels. Among the sites mean H1 was found
highest at S1 (12.38 m). However, the mean H1
1739
Int.J.Curr.Microbiol.App.Sci (2018) 7(7): 1737-1745
values were found to be consistently
increasing with values 6.90m, 9.05 m, 11.19m
and 13.03 m at PBIV, PBIII, PBII and PBI
respectively. The total growing stock (stem
volume/ha) showed significant variation for
PBs only. The stem volume performance was
found to be in descending order where PBI
(640.44 m3/ha) > PBII (492.24 m3/ha) > PBIII
(381.88 m3/ha) > PBIV (205.79 m3/ha)
respectively (Figure 1). Except PBI and PBII
and PBII and PBIII remaining PBs show
significant variation among each other.
Table.1 Location and details of the study sites
Locality
(District)
Forest Altitude Rainfall Temperature
Parent
Division
(m)
(about
(°C)
material
mm/yr)
17501500
42 to below 0
Slates,
Habban- Rajgarh
Forest
2000
schist and
(S1)
limestone.
(Sirmour) Division
Chail(S2)
(Shimla)
Cheog (S3)
(Shimla)
Shimla
Wildlife
Forest
Division
Theog
Forest
Division
18602100
1050
20202180
1250
40 to - 4
Shale,
schist,
slate and
quartzite.
40 to below 0 Shale, silt
stone,
quartzite
Coordinates
30°38'40'' to
31°1'14''N and
77°1'5''to
77°26'13''E
30°53'36'' and
31°00'42'' N and
77°07'20'' to
77°16'44''E
30°56'55'' to
31°17'50'' N and
77°16'10'' to
77°37'32'' E
Table.2 Stem desity, stand growth and growing stock details at site and PBs level
Sites and
Periodic
Blocks (P.Bs)
Habban (S1)
N/ha
DBH (cm)
Ht (m)
h 1 (m)
TBA (m2/ha)
ff
GS (m3/ha)
465
37.4
23.62
12.38
44.62
0.343
465.89
Chail (S2)
558.3
37.11
23.34
7.61
58.35
0.219
342.98
Cheog (S3)
453.3
40.34
26.67
10.13
56.38
0.258
481.39
PB-I
277.8
57.37
31.88
13.03
70.95
0.272
640.44
PB-II
390
44.64
27.75
11.19
61.74
0.263
492.24
PB-III
484.4
30.01
20.75
9.05
45.76
0.294
381.88
PB-IV
816.7
21.11
17.78
6.9
34.02
0.264
205.79
Site
NS
NS
2.64
1.25
NS
0.024
NS
P.B.
149.22
6.34
3.05
1.45
14.49
NS
157.24
NS
10.98
NS
2.51
NS
0.047
NS
CD0.05
1740
Int.J.Curr.Microbiol.App.Sci (2018) 7(7): 1737-1745
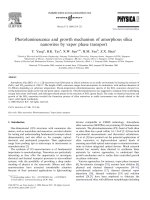
Figure.1 Density, basal area and growing stock performance young, medium and matured crop
at site and PBs level
Note: Y- Young Crop (0-30 cm): Md-Medium Crop (30-60 cm): Matured Crop (> 60 cm)
1741
Int.J.Curr.Microbiol.App.Sci (2018) 7(7): 1737-1745
Stem density (N/ha) of stand at P B s level
approves the principle of allotment of crop to
different PBs as per the crop age. PBIV being
a regenerated block obviously supports more
stems per unit area. Site quality, biophysical
rate of seed dispersal, level of disturbance,
stage of succession, altitude level (Chandra et
al., 1999; Dzwonko and Loster, 2000) and
stand management practices are other causes
supporting the stocking level in this regard
(Slik et al., 2010). Density-diameter
distribution of deodar in the current study
showed missing number of smaller and larger
trees is worth to consider (Figure 1) that
approves the similar results reported by
Adhikari et al., (1996) at and around Nainital
from Central Himalayan region also, study
reported by Kaushal et al., (1996) in mixed
deodar forest from dry temperate zone of
north-west Himalayas recorded deodar tree
density range as 350- 800 trees/ha. proved the
current study reports (Fig. 1).
Mean diameter at breast height under the
current investigation shows an increasing
order of DBH from young crop to mature
crop indicated that the tree growth is
influenced by two opposing factors i.e., firstly
the positive component associated with biotic
potential, photosynthesis activity, absorption
of nutrients, constructive metabolism etc., and
secondly the negative component representing
the restraints imposed by competition,
limiting resources, stress, respiration and
aging factors, which results in sigmoid shape
of tree growth Kozlowaski (1971). study
reported by Popoola (2012) that, DBH and
tree height exhibits increasing trend with
decreasing plant density as trees with close
neighbor in all sides maintain small crown
ratio and eventually slow in diameter growth.
This observation holds good for diameter
performance in current study where smaller
diameter trees with higher stem density were
found in PBIV and higher diameter trees in
PBI with less stocking. More so the spacing in
matured stand is not a constraint hence no
limitations for diameter expansion compare to
crowded stand where the available space is
upward only. The diameter increment found
to be pronounced with the availability of
plenty of sunlight and moisture that results in
wider annual rings (Stoddard, 1968). As per
the yield table the mean diameter increases
with increase in crop age. The same has been
observed in PBI having big size, matured
individuals with presence of exploitable girth
than regenerated block- PBIV having young
age crop. More so, in tall canopy trees
fragmentation represents gradual incapability
of the plant to replace dead structures and
maintain optimal diameter growth rate (Genet
et al., 2010) which could be the reason of
diameter variation in different PBs under
different sites. The good soil depth and less
disturbance compared to other sites as
observed during study period may be added
substantiation for significant diameter
performance at site level (S3) as stem
diameter is among the most sensitive
character traits in trees likely to be affected by
local environmental stresses (Dobbertin,
2005).
Regarding tree height differentiation at stand
level, presence of different densities in
different sites and PBs in current study
indicates the level of competition with
neighbor
by
individuals
resulting
differentiated use of vertical space. The
significant performance of height at site and
interaction level for S3 and S3B1 in the current
study may be because of this. This finding is
in line with Gawali (2014) for C. pentandra.
Also, the varying pattern of crown size with
respect to density indicates the differential
level of light requirements in these stands
(Jack and Long 1991). The dominant and codominant trees with greater competitive vigor
enjoy the available free space in top layer and
harness the benefit of light increment apart
from the trees on good site quality grow taller
1742
Int.J.Curr.Microbiol.App.Sci (2018) 7(7): 1737-1745
at faster rate than on poor ones (Avery and
Burkhart, 1983). Further, study demands self
thinning and managed thinning response for
height growth at stand level in future.
The variation in mean basal area /ha was
however in accordance with the stage of
growth
(Figure 1). In different PBs
(Chaturvedi and Khanna 1982) with slight
variation in PBIV and PBIII which might be
due to non removal of over matured trees.
Similar studies have been carried out by
Kumar (2013) in deodar forest of Chail region
in Himachal Pradesh. In comparison of study
of Bhat et al., (2002) for the growing stock
variations in different deodar forests of
Garhwal Himalayas, which reported highest
total basal cover (TBC) (60.5424 + or-4.6362
m2/ha) and minimum density (313 + or-23.44
trees/ha) at in Dewarkhal area in Uttarkashi
District is comparable for PBI basal area and
density performance. The form factor of
deodar stand showed greater significant
variation at both site and their interaction
level with minimum taper at site level S2
(0.219) followed by S3 (0.258) and S1 (0.343)
in a manner that S1 and S2 significantly vary
with each other. In site S3, height and crown
length was comparatively higher than S1, is an
indicator of good performance of form factor
the results in accordance with the study of
Singh (1976).
As the mean h1 values were found to be
consistently increasing with values from
young crop to mature crop suggests the
increase in diameter that does fall in line with
the findings of Singh 2004 for deodar,
Bhardwaj et al., (2001a) for Populus deltoids
and Kumar (2009) for Acrocarpus
fraxinifolius. Also, overall height (H1) in all
PBs remained high at S1 due to smaller crown
length as compared to S3 and S2. The growing
stock (total stem volume/ha) variation at site
level and their interaction levels were nonsignificant, but more average values were
obtained in S3 is indicative of better growth
performance and the higher growing stock in
PBIV and PBIII (Figure 1). The higher
growing stock in PBIV and PBIII in different
sites was due to the presence of trees of
higher diameter classes which otherwise were
required to be removed for better growth of
stock.
It is concluded that the density (N/ha) of
deodar stand showed a regular increasing
pattern with values 277.8, 390,484.4 and
816.7 N/ha under PBI, II, III and IV. Being a
regenerated block PBIV showed highest
numbers of total stems/ha at all the sites in
comparison to matured PBI broadly approved
the conventional crop allotment in PBs as per
the crop age. Density variation both at
younger and matured crop, was due to
delayed regeneration felling, poor conversion
of saplings to established individuals and
degree of competition also shows its tendency
to move towards even aged character. The
irregular stocking prevails wherein middle
aged crop found to be comparatively stable
indicates the devoid of silvical treatments due
to existing ban on green felling. Mean
diameter increases with increase in crop age
as 21.11 cm in PBIV 30.01 in PB III 44.64 cm
in PBII and 57.37 cm in PBI. Also, suggests
good competitive vigor, available spacing,
level of disturbance, stage of growth and soil
depth conditions for diameter variation.
Further, mean tree height (m) vary
significantly at site and PBS level with shown
significant variation for different site and PBs
with maximum value at S3 (26.67 m) and in
PBI (31.88 m). Presence of different densities
in different sites and PBs in indicates the level
of competition with neighbor resulting
differentiated use of vertical space with
varying crown size generated differential
level of light requirements. The highest basal
area/ha was reported at S3 (56.38 m2/ha) at
site level and (70.95 m2/ha) in PBI
respectively. This variation in mean basal area
1743
Int.J.Curr.Microbiol.App.Sci (2018) 7(7): 1737-1745
/ha was however in accordance with the stage
of growth in different PBs with slight
variation in PBIV and PBIII which might be
due to non removal of over matured trees.
Overall, maximum basal area was contributed
from middle diameter classes. The form factor
showed greater significant variation at both
site and their interaction level with minimum
taper at S2 (0.219) and in S2B2 (0.207). The
H1 reported increased value with increase in
diameter where, overall height (H1) in all PBs
remained high at S1 due to smaller crown
length as compared to S3 and S2.The growing
stock of deodar perform in descending order
where PBI > PBII > PBIII > PBIV
respectively.
References
Adhikari B S, Dhaila Seema and Rawat Y S
(1996).
Density-diameter
(D-D)
distribution curve under exposed and
unexposed
areas at and around
Nainital, Central Himalaya (U.P.).
Indian Forester. 122(6): 520-522.
Anonymous (1985). Report on forest
resources of Shimla, Rohru and
Chopal forest divisions of Himachal
Pradesh. FSI (N-Zone), MoEF. GOI:
94-95.
Assmann E (1970). The principles of forest
yield study. New York: Pergamon
Press. 506p.
Avery T E. and Burkhart H E (1983). Forest
Measurements. New York: McGraw
Hill. 290p.
Bhardwaj S D, Panwar P and Gautam S
(2001a). Biomass production potential
and nutrient dynamics of Populus
deltoides
under
high
density
plantations. Indian Forester. 127(2):
144-153.
Bhatt A, Sharma C M and Khanduri V P
(2002). Growing stock variations in
different Cedrus deodara forests of
Garhwal Himalaya. Indian Forester.
128(8): 903-916
Bitterlich W (1984). The relaskop idea
slough: Commonwealth Agricultural
Bureaux. Farnham Royal, England.
242p.
Champion H G. 1935. Silvicultural research
manual for use in India. Vol: The
experimental manual. Government of
India Press. Delhi. 110p.
Chandra P, Uniyal V K and Prakash C
(1999).Structure of forest vegetation
along an altitudinal gradient in the
Valley of Flowers National Park and
its vicinity. Western Himalaya.
7(1):60-69.
Chaturvedi A N and Khanna L S (1982).
Forest Mensuration. International
Book Distributors, Dehradun, India.
403p.
Dobbertin M (2005). Tree growth as indicator
of tree vitality and of tree reaction to
environmental stress: a review.
European Journal of Forest Research.
124: 319-333.
Dzwonko Z and Loster S (2000).
Syntaxonomy and phyto-geographical
differentiation of the Fagus woods in
the Southwest Balkan Peninsula.
Journal of Vegetation Science. 11(5):
667-678.
FSI. 2013. State of Forest Report (2013).
Forest Survey of India, Dehradun.
Gawali A (2014). Studies on growth and floss
yield of Ceiba pentandra (L) Gaertn.
stands in sub humid tropics, Asian
Journal of Plant Science and Research.
4(4): 37-39.
Genet H Breda and Dufrene N E (2010). Age
related variation in carbon allocation
at tree and stand scales in beech
(Fagus sylvatica L.)and sessile oak
(Quercus petraea (Matt.) Liebl.) using
a chronosequence approach. Tree
Physiology. 30: 177-192.
GOI (2008). National Action Plan on Climate
Change. PM Council on Climate
1744
Int.J.Curr.Microbiol.App.Sci (2018) 7(7): 1737-1745
Change, GoI, New Delhi.
Helms J A.(1998).(ed). The dictionary of
Forestry. Society of American
Foresters. Bethesda, MD, USA.
Ishii Hiroaki T, Tanabe Shin–ichi and Hiura
Tsutom (2004). Exploring their
relationships among canopy structure,
stand productivity and biodiversity of
temperate forest ecosystems. Forest
Science. 50(3): 342-355.
Jack S B. and Long J N (1991). Analysis of
stand density effects on canopy
structure: a conceptual approach.
Trees Structure and Function. 5(1):
44-49
Joshi, P.K., S. Singh, S. Agarwal and P.S.
Roy (2001). Forest cover assessment
in western Himalayas, Himachal
Pradesh using IRS 1C/1D WiFS data.
Curr Sci., 80: 941-947
Kaushal R, Bhandari A R, Sharma J C and
Tripathi D (1996). Tree productivity
in north-west Himalayas: deodar tree
productivity in dry temperate zone of
north-west Himalayas. Indian Journal
of Forestry. 19(3): 258-263.
Kozlowaski T T (1971). Growth and
development of trees. Academic Press,
New York. 443p.
Kumar Rakesh (2013). Studies on plant
biodiversity
of
Chail
wildlife
sanctuary in Himachal Pradesh. M.Sc.
Thesis, Dr. Y. S. Parmar University of
Horticulture and Forestry, Nauni,
Solan, H.P., India. 83p.
Kumar Suresh (2009). Study of growth
characteristics
of
Acrocarpus
fraxinifolius Wight and Arn. under
mid hill conditions of Himachal
Pradesh. M.Sc. Thesis, Dr. Y. S.
Parmar University of Horticulture and
Forestry, Nauni, Solan, H.P., India.
95p.
Popoola F S and Adesoy P O (2012). Crown
ratio models for Tectona grandis
(Linn. f) stands in Osho forest reserve,
Oyo state, Nigeria. Journal of Forest
Science. 28(2): 63-67.
Pressler M (1865). Das Gesetz der
stambidung. Leipzig. 153p.
Singh S P (1976). Stem standard timber form
factor of some Indian conifers. IndianForester. 102(11): 747-760.
Slik J W, Shin – Ichiro Aiba S I, Brearley F
QCannon C H, Forshed O, Kitayama
K (2010). Environmental correlates of
tree biomass, basal area, wood specific
gravity and stem density gradients in
Borneo’s forests. Global Ecology and
Biogeography. 19: 50-60.
Stoddard Charles H (1968). Essentials of
forestry practice. 2nd edition. The
Ronald Press Company, New York.
362p.
How to cite this article:
Prahlad, V.C. 2018. Stand Structure and Growth Pattern of Deodar (Cedrus deodara Roxb.
Loud) Forests of Western Himalaya (India). Int.J.Curr.Microbiol.App.Sci. 7(07): 1737-1745.
doi: />
1745