Performance evaluation of improved water management technology of rice at farmers’ field in south-eastern Rajasthan
Bạn đang xem bản rút gọn của tài liệu. Xem và tải ngay bản đầy đủ của tài liệu tại đây (280.35 KB, 8 trang )
Int.J.Curr.Microbiol.App.Sci (2018) 7(7): 2727-2734
International Journal of Current Microbiology and Applied Sciences
ISSN: 2319-7706 Volume 7 Number 07 (2018)
Journal homepage:
Original Research Article
/>
Performance Evaluation of Improved Water Management Technology of
Rice at Farmers’ Field in South-Eastern Rajasthan
R.S. Narolia*, Harphool Meena, Baldev Ram and B.L. Nagar
AICRP on Irrigation Water Management, Agricultural Research Station, Ummedganj, Kota
(Agriculture University, Kota -324001, Rajasthan), India
*Corresponding author
ABSTRACT
Keywords
Rice, Sustainability
yield index,
Sustainability value
index and water
management
technology
Article Info
Accepted:
20 June 2018
Available Online:
10 July 2018
On farm demonstrations were conducted during kharif seasons of 2013 to 2015 at farmer’s
field in Chambal command area of Rajasthan under Operational Research Programme of
Agricultural Research Station, Kota to study the impact of improved water management
technology on the water productivity and sustainability of rice. Treatments comprised
irrigation of 5±2 cm standing water and refilling at 1-3 days after disappearance of ponded
water which was compared with the farmers practice (FP) i.e. continuous submergence.
Results revealed that improved water management technology gave higher and sustainable
yield of rice over the years. The mean grain yield (4,531 kg/ha), production efficiency
(34.8 kg/ha/day) and crop monetary efficiency (Rs.728 /ha/day) recorded under IWMT
being 7.0, 7.1 and 7.8 per cent higher as compared to the farmers practice, respectively.
Mean sustainability yield index (0.913) and sustainability value index (0.888) were found
2.87 and 4.0 percent higher under IWMT in comparison to FP, respectively. Mean water
expanse efficiency (92.9 kg/ha-cm), water use efficiency (35.2 kg/ha-cm), water
profitability (7.35 Rs./M3) and incremental cost benefit ratio (4.8) observed were also
better in IWMP than farmers practice.
Introduction
Rice (Oryza sativa L.) is the most important
staple food crop for nearly half of the world’s
population. It can grow well in standing water,
but it does not require standing water as a rule.
In the traditional practice water level of 9-10
cm is always maintain. This is because of
farmer’s belief that rice requires more water
for better growth and good yield. Based on
favourable monsoons, huge irrigation net work
covering over 90 m ha has been developed
since independence in the country that has
made country self-sufficient in food grains
production. However, the ever-growing
competition over water, between farming and
urban dwellers, and industrialists, is shrinking
the available water resources for agriculture.
The rapidly changing climate is also putting
hurdles on the monsoon pattern and thus water
supply to agriculture (Singh et al., 2013). It is
in this context that efficient water use
becomes more crucial in the coming years.
There is also need to make food production
2727
Int.J.Curr.Microbiol.App.Sci (2018) 7(7): 2727-2734
less water dependant. Irrigated rice production
system is the largest consumer of water in
agriculture sector and its sustainability is
threatened by increasing water shortage
(Yang, 2012). Such water scarcity necessitates
the development of alternate–irrigated rice
system that requires less water than
traditional-flooded rice (Naresh et al., 2013).
Keeping in view of these emerging challenges,
efficient production technology need to be
developed and adopted utilizing the available
water resources in the right perspective
without compromising on production and
productivity of rice, field trials were
conducted at farmer’s field under operational
research programme (ORP) with the aim to
increase water productivity of rice.
A total of 12 on farm trials (6 each at left main
and right main canal of Chambal command)
were conducted each year at adopted villages
namely Manasganv, Soli, Kotsuan Mandawari
of Kota and Kotkhera, Khothiya and Lesarda
of Bundi districts during kharif seasons for
five consecutive years (2013 to 2015) in the
selected farmers’ field. For the selection of
farmers to conduct the demonstrations, a
farmer’s group meeting was convened each
year and receptive and innovative farmers
were selected. Selected villages of Chambal
command lies between 25º and 26º N latitude
and 75º-30' and 76º-6' E longitude in the
south-eastern part of Rajasthan. It comes
under agro climatic zone V which is also
known as humid south eastern plain of
Rajasthan.
The soils of the adopted villages for
demonstrations belong to the order vertisols
and inceptisols, mainly comprise of Chambal
series (62%) and Kota variant (23%). The bulk
density, pH and cation exchange capacity of
these soils varies between 1.35-1.59 Mg/m3,
7.7 - 8.4 and 30-40 C mol/kg, respectively.
The soils have a very low water intake rate
approximately 0.25 cm/hr on surface but are
almost impermeable at 1.2 to 1.5 m depth. The
potential moisture retention capacity is almost
120 mm of water in 1 m depth. The soils of
the selected villages for demonstrations are
poor in organic carbon (0.50±0.07) and
available nitrogen (273±12 kg/ha) but are low
to medium in available P2O5 (24.3± 0.8 kg/ha)
and medium to high in available K2O (295 ±
10 kg/ha).
Improved water management practices
(IWMP) includes irrigation of 5±2 cm
standing water and refilling at 1-3 days after
disappearance of ponded water and compared
with the farmer’s practice (FP) i.e. continuous
submergence (usually 10 cm in each
irrigation). Beside this, demonstrated blocks
as well as control blocks were followed the
recommended package of practices viz., high
yielding varieties (Pusa Basmati-1121), seed
treatment, nursery raising, recommended dose
of fertilizer (120:60:60 NPK, kg/ha), crop
geometry (20 cm x 20 cm) and seed rate (30
kg/ha). Each trial was laid out in an area of 0.1
ha. For assessing impact of improved water
management
technology
(IWMT),
transplanting of paddy in adjoining field with
similar area was also done by the farmer
which was considered as control plot. For the
test plots, measurement of water was done by
velocity-area method at field level. The
demonstration plots were transplanted with
improved water management practices during
first fortnight of July and harvested in the mid
of October every year. The rainfall received
during growing period of rice were 924.4 mm,
734.6 mm and 592.2 mm with the total rainy
days 39, 20 and 25 for the years of 2013, 2014
and 2015 respectively (Table 1). Potential
yield of rice crop in humid south eastern plain
zone of Rajasthan was 6000 kg/ha. Production
efficiency was calculated on the basis of
average maturity days (130 days) of variety
Pusha Basmati-1121. Water productivity was
also analyzed using standard method (Singh
and Kumar, 2011). For economic evaluation in
2728
Int.J.Curr.Microbiol.App.Sci (2018) 7(7): 2727-2734
term of gross and net returns and incremental
benefit ratio, the prevailing market rates for
input, labour and produce was utilized. Data
were recorded from demonstration blocks and
farmer’s practice blocks.
These recorded data were analyzed for
different
parameters,
using
following
formulae, suggested by Prasad et al., (1993).
(A)
Extension
Gap=Demonstration
yield(Di)- Farmers practice yield (Fi)
Technology Gap= Potential yield(Pi)Demonstration yield(Di)
Technology Index=( Pi-Di )/Pi x 100
(B)
(C)
Statistical analysis of the data for standard
deviation and coefficient of variation was
done as described by Panse and Sukhatme
(1985). Sustainability indices (Sustainability
yield index and sustainability value index)
were work out using formula (Singh et al.,
1990).
SYI =
Estimated average yield (kg/ha) - Standard
deviation
Maximum yield (kg/ha)
SVI =
Estimated net return (Rs./ha) - Standard
deviation
Maximum net return (Rs./ha)
Water use efficiency =
Economic crop yield (kg/ha)
Evapotranspiration (ha.cm)
Results and Discussion
Grain yield
Cumulative data over three year (Table 3)
revealed that mean grain yield (4531 kg/ha),
production efficiency (34.8 kg/ha/day) and
crop profitability ( 728/ha/day) were found to
be 7.0, 7.1 and 7.8 per cent higher under
improved water management technology
(IWMT) than mean grain yield (4230 kg/ha),
production efficiency (32.5 kg/ha/day) and
profitability ( 675/ha/day) obtained under
farmers practices, respectively. However,
maximum production efficiency (36.9
kg/ha/day) and crop profitability ( 801 kg/ha)
under IWMT were recorded during 2014 and
2013, respectively. The higher grain yield and
efficiency indices in relation to production and
profitability during particular year and mean
basis under demonstrated blocks could be
attributed to the adoption of improved water
management technology and higher sale price
of produce. Year wise variations in grain yield
and ultimately in efficiency indices were due
to variation in the environmental conditions
prevailed during that particular year. Narolia
et al., (2013) also reported that improved
water management practices have showed
positive effect on yield potentials of paddy
crop. Mean water expanse efficiency (92.9
kg/ha-cm), water use efficiency (35.2kg/hacm) and water profitability (7.35 /M3) which
were 57.0, 28.3 and 29.8 per cent higher in
test blocks as compared to farmers practice,
respectively resulted due to optimal depth of
irrigation water applied and by virtue of that
more yield obtained. Dhar et al., (2011)
reported similar results in rice crop at Jammu.
Yield gap analysis
Water profitability =
Net return (Rs./ha)
Water applied (m3)
Extension gap, Technology gap and
Technological index were evaluated for all the
three years. Extension gap is a parameter to
know the yield difference between the
2729
Int.J.Curr.Microbiol.App.Sci (2018) 7(7): 2727-2734
demonstrated technology and farmer’s
practice; for study this ranged from 197 to 404
kg/ha with an average of 302 kg/ha. This
indicated a wide gap between the
demonstrated improved technology and its
adoption by the farmers (Table 4). Technology
gap is a measure of difference between
potential yield and yield obtained under
improved water management technology
demonstration, this is of greater significance
than other parameters as it indicates the
constraints in implementation and drawbacks
in our package of practices, these could be
environmental or varietal. This also reflects
the poor extension activities, which resulted in
lesser
adoption
of
improved
water
management technology and package of
practices by the farmers. Technology gap can
be lowered down by strengthening the
extension activities and further research to
improve the package of practices. It is
dependent on technology gap and is a function
expressed in percent. For the three years of
study it varied from 20.1 percent to 33.0
percent, with an average of 25.0 per cent. The
very low technology index (20.1) during the
year 2014 could be due to adoption of
improved water management practices,
favorable climatic conditions, free from insect
pest and disease incidence. High technology
index (33 %) observed in the year 2015 shows
a poor performance of package of practices
and demonstrated technology.
This was mainly due to early withdrawal of
monsoon and unfavorable climatic conditions
with incidence of pest and diseases. Such
higher technology indices have been also
reported in rice crop by Narolia et al., (2013).
Table.1 Weekly Rainfall and rainy day during Kharif 2013 to 2015
Standard
week
27
28
29
30
31
32
33
34
35
36
37
38
39
40
41
from
Period
to
2.7.2009 – 8.7.2009
9.7.2009-15.7.2009
16.7.2009-22.7.2009
23.7.2009-29.7.2009
30.7.2009 -5.8.2009
6.8.2009-12.8.2009
13.8.2009-19.8.2009
20.8.2009-26.8.2009
27.8.2009-2.9.2009
3.9.2009-9.9.2009
10.9.2009-16.9.2009
17.9.2009-23.9.2009
24.9.2009-30.9.2009
1.10.2009-7.10.2009
8.10.2009- 14.10.2009
Total
Total rainfall (mm)
2013
2014 2015
90.8
0.0
0.0
35.6
29.2
92.8
137.2
74
106.4
190.8
96.4 189.2
112.8
39.0
9.4
142.9
333.6 44.4
32.0
15.4 121.8
75.1
0.0
0.0
0.00
13.4
0.0
0.00
114.8
5.8
4.6
18.8
0.0
22.2
0.00
0.00
43.8
0.00
0.00
7.4
0.00
0.00
29.2
0.00
0.0
924.4
734.6 592.2
2730
Rainy days
2013 2014 2015
4
0
0
3
0
5
5
4
4
6
4
5
5
2
3
6
4
2
2
1
4
4
0
0
0
1
0
0
3
1
0
1
0
1
0
1
1
0
0
1
0
0
1
0
0
39
20
25
Int.J.Curr.Microbiol.App.Sci (2018) 7(7): 2727-2734
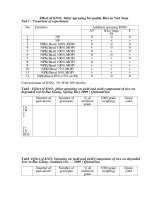
Table.2 Effect of improved water management technology on sustainability yield and value index of paddy
Particulars
Years
Grain yield (kg/ha) range
Mean yield (kg/ha)
Standard deviation
CV (%)
Net return range( /ha)
Mean Net return ( /ha)
Standard deviation
CV (%)
SYI
SVI
H
T
H
T
2013
IWMT
FP
5050
4690
4500
4020
4775
4371
167.1
181.4
3.50
4.15
111966 103174
96395
84206
104192 94136
4730
5134
4.54
5.45
0.913
0.893
0.888
0.863
2014
IWMT
FP
5000
4800
4560
4070
4797
4493
146.6
184.0
3.06
4.10
104600
100636
92579
80692
99049
92244
4006
5026
4.04
5.45
0.930
0.898
0.909
0.867
H= Maximum yield at head reach of canal, T= Minimum yield at tail reach of canal
FP=Farmers practice
2015
IWMT
FP
4150
4040
3880
3630
4022
3825
89.1
103.1
2.21
2.70
84445 82832
76804 71229
80818 76759
2521
2919
3.12
3.80
0.948
0.921
0.927
0.891
Mean
IWMT
FP
4733
4510
4313
3907
4531
4230
134.3
156.1
2.92
3.65
100337 95547
88593
78709
94686
87713
3752
4360
3.90
4.90
0.930
0.904
0.908
0.873
IWMT=Improved water management technology
Table.3 Effect of improved water management technology on grain yield, efficiency indices for water use and profitability of paddy
Year
Yield (kg/ha)
2013
2014
2015
Mean
IWMT
4775
4797
4022
4531
FP
4371
4493
3825
4230
%
increase
over FP
9.2
6.8
5.2
7.0
Water applied
(cm)
IWMT
130.6
125.5
130.7
128.9
WEE
(kg/ha-cm)
FP
IWMT
152.6 125.7
143.5 92.3
154.7 60.9
150.2 92.9
FP
72.9
64.2
42.5
59.8
WEE= Water expanse efficiency, WUE=Water use efficiency, WP= Water profitability
2731
WUE
(kg/ha-cm)
IWMT
36.6
38.2
30.8
35.2
FP
28.6
31.3
24.7
28.2
WP
( /M3)
IWMT
7.98
7.89
6.18
7.35
FP
6.17
6.43
4.96
5.85
Production
efficiency
(kg/ha/day)
IWMT FP
36.7
33.6
36.9
34.6
30.9
29.4
34.8
32.5
Monetary
efficiency
( ha/day)
IWMT FP
801
724
762
710
622
590
728
675
Int.J.Curr.Microbiol.App.Sci (2018) 7(7): 2727-2734
Table.4 Economic analysis of improved water management technology on paddy at farmer’s field
Year
Cost of inputs
Additiona
Sale
Total return
Additiona
Effective
IBC
( x1000/ha)
l cost in
price
( /ha)
l return
gain
R
IWMT
IWMT
( /q)
in IWMT
( ./ha)
FP
IWMT
FP
( /ha)
EG
TG
TI
(kg/ha)
(kg/ha)
(%)
( /ha)
2013
31.0
29.6
1400
2700
104192
94136
10056
8656
7.2
404
1225
20.4
2014
32.0
30.5
1500
2600
99049
92244
6805
5305
4.5
304
1203
20.1
2015
33.0
31.5
1500
2700
80818
76759
4059
2559
2.7
197
1978
33.0
Mean
32
30.5
1467
2667
94686
87713
6973
5507
4.8
302
1469
25
IWMT= Improved water management technology, FP= Farmers practices, EG= Extension gap, TG=Technology gap, TI= Technology Index
2732
Int.J.Curr.Microbiol.App.Sci (2018) 7(7): 2727-2734
Economic analysis
Mean data (Table 4) of three years revealed
that 7.9 per cent higher net return was found
in improved water management technology
( 94,686/ha) as compared to farmers
practices. Grain yield, cost of inputs and sale
price of produce determine the economic
returns and these vary from year to year as the
cost of input, labor and sale price of produce
changes from time to time. The year wise
additional returns from improved water
management technology over farmer’s
practice varied from 4,059 to 10,056. The
mean additional cost of input of all the
demonstrations for three years was 1,467
(Table 4). This additional investment along
with non-monitory management factors gave
an additional mean return of
6,973. The
higher sale price of produce, in spite of low
production and higher additional cost of input
during 2013 gave highest additional returns
under improved technological demonstrations
over farmer’s practice. The incremental
benefit cost ratio (IBCR) on overall average
basis was 4.8. The highest IBCR during three
years was observed in 2013 (7.2) this is due to
comparatively higher grain yield, less cost of
input and a good sale price. The results are in
agreement with the findings of Singh et al.,
2012.
Sustainability
The improved water management technology
i.e. irrigation of 5±2 cm standing water and
refilling at 1-3 days after disappearance of
ponding water, gave higher grain yield,
sustainability yield index and value index
compared to the farmers practice. Higher
standard deviation and ultimately coefficient
of variation in yield observed under farmer’s
practices during all the experimental years
was due to more variations in the yield from
farmer to farmer and were lesser in improved
water management technology. However, the
sustainability yield index (SYI) and
sustainability value index (SVI) were more
under improved technology than farmer’s
practices (Table 1). The mean SYI under
improved water management technology
varied from 0.913 - 0.948 and SVI of 0.888 0.927, whereas value of SYI under farmers
practice ranged from 0.893 - 0.921 and 0.863
– 0.891 of SVI.
Mean data further revealed that SYI (0.930)
and SVI (0.908) increased to the tune of 2.87
and 4.0 per cent over farmers practice. This
showed that the improved water management
technology is more sustainable as well as
economical also as compared to farmer’s
practice. Chery et al., (2014) also observed
similar trends in cotton based intercropping
system under semi-arid vertisols.
In conclusion, the improved water
management technology i.e. irrigation of 5±2
cm standing water and refilling at 1-3 days
after disappearance of ponded water, gave
higher grain yield with saving of water,
sustainability yield index and value index
compared to the farmers practice.
References
Chery, G.R., Shriniwas, C.H., Shankar,
G.R.M., Patel, P.G., Singh, R.N.,
Mganvir, M., Nagdeve, M.B., Mohad,
V.D., Singh, R., Rani, N and
Siddaram.
2014.
Sustainability
assessment
of
cotton
based
intercropping system for productivity
and profitability using different
quantitative indices under semi-arid
vertisols. Indian Journal of Agronomy
59(4) : 587-595
Dhar, R., Bharti,V., Samanta, A., Gupta, N.K.
and Bali, A.S. 2011. Water
productivity enhancement of major
crops in irrigated plains of Jammu. In
proc: National seminar on “strategic
2733
Int.J.Curr.Microbiol.App.Sci (2018) 7(7): 2727-2734
resource management for sustainable
food and water security”. G.B. Pant
University
of
Agriculture
&
Technology Pantnagar (13-15 June
2011) Pp-2.
Naresh, R.K., Singh, S.P and Kumar vener.
2013. Crop establishment, tillage and
water management technologies on
crop and water productivity in ricewheat cropping system of North west
India. International Journal of Life
Sciences. Biotechnology and Pharma
Research 2(3): 237-248.
Narolia, R.S., Pratap Singh., Mathur, I.N and
Tetarwal, J.P. 2013. Assessment of
gaps in transfer of water management
technology in rice grown in Chambal
Command
of
South
–eastern
Rajasthan. Annals Agril. Research.
34(3): 276-280
Panse, V.G. and Sukhatme, V.P. 1985.
Statistical methods for agricultural
workers.
Indian
Council
of
Agricultural Research, New Delhi.
Prasad, Y., Rao E, Manchar, M. and
Vijaybhinanda, R. 1993. Analysis of
on-farm trialsand level of technology
on oilseeds and pulse crops in
Northern Telangana Zone of Andra
Pradesh. Indian J. Agril. Economics
48: 351-56.
Singh, R.P., Das, S.K., Bhaskar Rao, U.M
and. Narayana Reddy, M. 1990.
Towards
sustainable
dryland
agricultural
practices.
Bulletin,
CRIDA, Hyderabad, India. Pp. 1-106.
Singh, R., and Kumar, A. 2011.
Mannual on Enhancing water use
efficiency in
canal
command.
Directorate of Water Management
(ICAR), Bhubaneswar Pp-47-62
Singh, P., Narolia, R.S., Mathur, I.N.,
Sharma, N.N., Tomar, S.S. and Gupta,
P.K.
2013.
Enhancing
crop
productivity and water use efficiency
in Chambal command area of
Rajasthan:
Prospectus
and
Perspectives. Proceedings of India
Water Week on efficient water
management:
Challenges
and
Opportunities from 8-12 April, 2013
organized by Government of India,
Ministry of water Resources. New
Delhi.
Singh,T., Singh, R. and Soni, R.L. 2012.
Performance of rice variety (P- 1460)
in front line demonstrations under
rainfed conditions in southern humid
region of Rajasthan. Annals of Agril.
Sci. 33 (3): 121-125.
Yang, C.M. 2012. Technology to improve
water management for rice cultivation
to cope with climate change. Crop,
Environment & Bioinformatics 9:
193-207.
How to cite this article:
Narolia, R.S., Harphool Meena, Baldev Ram and Nagar, B.L. 2018. Performance Evaluation of
Improved Water Management Technology of Rice at Farmers’ Field in South-Eastern
Rajasthan. Int.J.Curr.Microbiol.App.Sci. 7(07): 2727-2734.
doi: />
2734