Assessment of mutation in marigold (Tagetes erecta L.) using morphological and molecular markers
Bạn đang xem bản rút gọn của tài liệu. Xem và tải ngay bản đầy đủ của tài liệu tại đây (371.38 KB, 10 trang )
Int.J.Curr.Microbiol.App.Sci (2018) 7(7): 2588-2597
International Journal of Current Microbiology and Applied Sciences
ISSN: 2319-7706 Volume 7 Number 07 (2018)
Journal homepage:
Original Research Article
/>
Assessment of Mutation in Marigold (Tagetes erecta L.) using
Morphological and Molecular Markers
Jayoti Majumder1*, S. K. Singh1 and Manjusha Verma2
1
2
ICAR- Indian Agricultural Research Institute, New Delhi-110012, India
ICAR-National Bureau of Plant Genetic Resource, New Delhi-110012, India
*Corresponding author
ABSTRACT
Keywords
Mutation in
Marigold,
Tagetes erect
Article Info
Accepted:
17 June 2018
Available Online:
10 July 2018
Variability caused by induced mutations is not essentially different from variability caused
by spontaneous mutation during evolution. Although marigold (Tagetes spp.) is an
important commercial crop the major breeding obstacle is non-availability of known
sources for creating a novelty. Therefore, in vivo grown seedlings and in vitro raised
proliferated cultures of marigold cultivar Pusa Narangi Gainda were subjected to gammairradiation to develop mutant populations. 11 Mutants were grown in the M 1 generation
and variants screened based on yield and morphological characters. The number of flowers
per plant was recorded the maximum in both the parents i.e. Parent (53.24) followed by in
vivo raised mutant v4 (40.78). The v4 exhibited maximum average flower diameter (5.71
cm) with equivalence to Parent (5.71 cm). The maximum petal width among the mutants
of M1 was observed in vitro raised mutant v8 (12.55 mm). After screening the mutants
through the morphology, genomic DNA from leaf samples was evaluated by six identified
putative mutants (pm1-6) in PCR amplification using RAPD primers and the amplified
DNA fragments from mutants were compared with their respective controls. Single marker
and stepwise regression analysis were carried out in relation to percent variability indicate
that the alleles OPA 10, markers are strongly associated with mutant identification. On the
basis of dendogram generated, Putative mutant 3 shows highest dissimilarity than the
parent (0.24). The Putative mutants 5 and 6 were found to be similar with each other (0.47)
but were distinct from parent (0.44)
Introduction
Marigold (Tagetes erecta L.) is grown world
over and are highly valued for their
spectacular flowers, brilliant colours and
delightful appearance and is endowed with
large spectrum of commercial potentialities in
medicinal and industrial sector. Presently,
most of the varieties being grown in marigold
are open-pollinated, which are less vigorous,
uneven in height with low yield and are
vulnerable to cross-pollination (Raghava,
1995). Therefore, the direct use of mutation is
very valuable supplementary approach to plant
breeding, particularly when it is desired to
improve one or two easily identifiable
2588
Int.J.Curr.Microbiol.App.Sci (2018) 7(7): 2588-2597
characters in a well adopted variety. Mutation
usually slightly alter the genetic base while the
improved character(s) is (are) added, and the
time required to breed the improved variety
can be much shorter than when hybridization
(Omar, 2008). Mutation breeding can play an
important role in the improvement of a crop
either directly or by supplementing the
conventional breeding procedures where
linkage between genes controlling desirable
and undesirable characters can be broken with
the help of radiation. Selection of appropriate
mutagen and isolation of the mutants are
difficult, but is important in mutation assisted
breeding.
Marigold is basically seed propagated crop.
The induced mutation either in vivo or in vitro
can create mutant in M0 generation but most
mutations may be recessive at this stage and
plants may be chimeric so it is important to
follow further generations for phenotypic
screening purposes (Maple and Moller, 2007).
Screening for mutants is usually carried out in
the M1 or later generations when the
population has got stabilized. This is because
in the M1 generation, the mutants will be
heterozygous and as a result mutant which are
dominant with respect to the wild would be
expressed (Leyser, 2000). With the advent of
in vitro and in vivo techniques, the interest in
the combination of mutagenic treatment is
possible now for many seed propagated as
well as vegetatively propagated crops.
Phenotypic selections based on traits that are
conditioned by additive allelic effects can
produce dramatic, economically important
changes in breeding populations. Besides that,
Molecular markers like RAPD provide a quick
and reliable method for estimating genetic
diversity and are the reliable tools to confirm
mutant at early stages. In order to contribute
towards improvement in marigold the present
investigation was carried out keeping the
above facts in mind, i.e., isolated putative
mutants of Pusa Narangi Gainda derived
through in vivo and in vitro induced
mutagenesis were multiplied, and then to
isolate the solid mutant through morphological
and molecular characterization. The putative
mutants will be multiplied in the successive
generation.
Materials and Methods
Seedlings and in vitro grown proliferated
cultures of var. Pusa Narangi Gainda were
subjected to gamma irradiation (5, 10, 15, 20,
25, 30, 35 and 40 Gy) at Nuclear Research
Laboratory, IARI, New Delhi for in vivo and
in vitro mutation. The mutated seedlings as
well as the proliferated cultures along with the
controls were grown. In M1, selfed seeds of
variants derived by in vivo mutation (v1, v2, v3
and v4) and in vitro mutation (v5, v6, v7, v8, v9,
v10 and v11) with their respective controls were
raised in nursery and finally transplanted in
main field at 30 x 30 cm distance. The
quantitative parameter of the variants were
analysed
statistically
in
Completely
Randomized Design the significance of
treatment effects on various parameters was
determined using analysis of variance
(ANOVA).
The selected variants of M1 generation were
again screened with RAPD primers.
For genomic DNA isolation, DNA was
extracted using 500 mg young leaves from the
non-irradiated control (stock plant) and
putative mutants with CTAB method
described by Tsaftaris et al., (2006). The DNA
concentration of each sample was confirmed
by using VersaFluorTM Flurometer (BIORAD, USA). The isolated DNA was diluted in
TE buffer having concentration upto 10ng/l
and kept under the -200C until analysis.
Amplification was performed as per the
protocol described by William et al., (1990)
with a few modifications. Five decamer
RAPD primers (Operon Technology Inc.,
2589
Int.J.Curr.Microbiol.App.Sci (2018) 7(7): 2588-2597
USA) were used for PCR amplification. The
reaction volume was of 25 μl of reaction
containing 2.5 μl of reaction buffer with 2.5 μl
MgCl2, 0.5 µl dNTPs, 1 unit of Taq DNA
polymerase and 1.0 µl primer. The total
volume of the reaction mixture was adjusted
using
sterile
deionized
water.
The
amplification was performed in Biometra®
PCR thermocycler. Thermal cycles were
programmed for initial denaturation at 940C
for 4 min. In each cycle denaturation was for
one min at 940C, annealing for 1 min at 320C
and extension for 2 min at 720C was
performed with the final extension after 35
cycles for 10 min. Amplification was repeated
thrice for each primer. The PCR product was
separated on 1.4% agarose gel and visualized
with ethidium bromide staining. Gels were
photographed using AlphaEaseTM software.
Bands of RAPD gels were scored as either
present (1) or absent (0) for the genotypes
studied. Common band analysis was
conducted using the computer programme
NTSYS-PC Ver. 1.8. (Rohlf, 2000) to
determine the genetic distances values
between the genotypes. The gel images
depicting the genetic distances were then used
as input data for cluster analysis to generate
dendograms.
Results and Discussion
The morphological characteristics of the
variants are presented in the Table 1. Among
them, the maximum days were taken to
germinate the seed in v3 (5.8 days), followed
by Parent and v1 (5.67 days) while, the
minimum days required for germination was
in v11 (5.23 days). It was evident from the
Table 1, that there was non-significant effect
on the average days to bud initiation among
the mutants and their parents. The maximum
number of days required for anthesis was
noted in the v1 (71.89 days) and then the v7
(71.45). The number of flowers per plant was
recorded the maximum in both the parents i.e.
Parent (53.24) followed by v4 (40.78). The
number of flowers per plant was significantly
reduced compared to their respective parent
(control). Among the mutants derived in M1,
v4 exhibited maximum average flower
diameter (5.71 cm) with equivalence to Parent
(5.71 cm) while, minimum in v6 (5. 33 cm).
Among the parents, the minimum flower
diameter was exhibited by v1 (5.37 cm).
Although the obtained results of flower
diameter was statistically non-significant at
5% LSD. The maximum petal width among
the mutants of M1 was observed in v8 (12.55
mm) being statistically at par with v3 (12.47
mm). The parents of both type of mutant
showed non-significant variation in petal
width. The highest harvest index was found
Parent (48.33 %) while, lowest harvest index
was recorded in v11 (31.34 %). Among the
mutants the highest harvest index was
obtained in v4 (45.45 %) which is at par with
v2 (45.34 %). Out of all, highest seed wt. was
recorded in v10 (241.35 mg) followed by v1
(241.24 mg). Among different parent of the
mutants, the maximum seed wt. was noticed in
Parent (240.93 mg). The isolated six putative
mutants (pm1, pm2, pm3, pm4, pm5, pm6)
were obtained in M1and were subjected for
molecular characterization in Table 2.
One of the mutagens which have been
successfully used to cause beneficial induced
mutation in crops is gamma ray (Omar, 2008).
There are chances to obtain somatic epitypic
changes as well as genetic changes. In case of
gamma irradiation the chances of epitypic
change reduces (Sangyoung et al., 2007). But,
marigold is a cross pollinated crop and highly
heterozygous (Raghava, 1995). In the cases
like seed germination, may be attributed to the
occurrence of seeds with completely
developed embryos which could not be
affected by the gamma irradiation (Omar et
al., 2008). Three mutants have been isolated
naming Putative mutants 2, 5 and 6 exhibited
a larger bloom.
2590
Int.J.Curr.Microbiol.App.Sci (2018) 7(7): 2588-2597
Table.1 Morphological analysis of variants grown in M1
Sl.
No.
Genotype
Days to seed
germination
Days to
anthesis
Flower
diameter
(cm)
5.71
Flower
colour
70.80
No. of
flowers
per plant
53.24
orange
Width of
petal
(mm)
11.24
1.
Parent
5.67
2.
v1
5.67
71.89
30.65
5.37
orange
12.04
3.
v2
5.54
67.89
21.34
5.59
orange
12.25
4.
v3
5.65
70.23
25.67
5.45
orange
12.47
5.
v4
5.45
70.45
40.78
5.71
orange
12.33
6.
v5
5.52
70.16
30.56
5.67
orange
11.45
7.
v6
5.55
69.9
26.67
5.33
orange
11.19
8.
v7
5.80
71.45
31.78
5.34
orange
12.45
9.
v8
5.65
70.12
27.45
5.50
orange
12.55
10.
v9
5.38
71.45
29.04
5.65
orange
12.45
11.
v10
5.45
69.23
24.56
5.35
orange
12.45
12.
v11
5.23
70.11
25.67
5.47
orange
12.34
SE
0.34
1.19
0.69
9.92
1.02
7.85
1.33
0.27
-
0.31
0.48
CD at 5%
Harvest
index
(%)
48.33
(43.86)
44.33
(41.55)
45.34
(42.30)
38.67
(38.35)
45.45
(42.30)
35.78
(36.69)
32.56
(34.76)
34.87
(35.85)
32.12
(34.51)
34.12
(35.73)
31.45
(34.08)
31.34
(34.02)
0.67
1.85
Table.2 The mutants used for molecular analysis
Sl. No
Name
1.
2.
3.
4.
5.
6.
Putative mutant 1 (pm1)
Putative mutant 2 (pm2)
Putative mutant 3 (pm3)
Putative mutant 4 (pm4)
Putative mutant 5(pm5)
Putative mutant 6(pm6)
Derived from
(Plant no.)
3
21
23
14
3
25
2591
Distinguishing feature
Flower light orange (orange 10 YR)
Flower of larger diameter (8.5 cm)
Early flowering (in 47.89 days)
Flower light orange (orange 10 YR)
Flower of larger diameter (7.5 cm)
wider petals width (14 mm)
100
seed
wt.(mg)
240.93
241.24
239.45
238.78
240.13
235.67
236.45
239.56
240.56
238.94
241.35
238.78
1.23
11.23
Int.J.Curr.Microbiol.App.Sci (2018) 7(7): 2588-2597
Table.3 Characteristics of RAPD primers generated by selected primers
Sl
No.
Primers
Sequence
(5’-3’)
Total No.
of amplification
product
No. of
polymorphic
amplification
product
%
polymerphism
Average
amplificatproduct/cv./
primer
Molecular
weight
range
(bp)
Effective
Multiplex
Ratio
(EMR)
Diversity
Index
(DI)
Marker
Index
(MI)
Primer
Resolving
Power
(Rp)
1
2
3
OPA 3
OPA 10
OPB 10
AGTCAGCCAC
GTGATCGCAG
GGGGGTCTTT
5
8
4
2
5
1
40.0
62.5
25.0
1.20
1.87
3.50
550-900
300-1200
500-1500
0.8
3.15
0.25
0.12
0.18
0.08
0.096
0.56
0.02
3.2
2.65
1.2
4
OPD 2
GTGCCCGTCA
5
3
60.0
2.64
375-1300
1.5
0.12
0.18
1.42
5
OPD 7
GTCCCGACGS 3
1
33.3
3.00
500-1000
1.0
0.03
0.03
2.68
Table.4 Jaccard’s similarity coefficient values for RAPD markers
parent 1(in vivo)
parent2(in vitro)
m1
m2
m3
m4
m5
m6
parent1(in vivo)
parent 2(in vitro)
m1
m2
m3
m4
m5
1
0.70
0.58
0.24
0.61
0.45
0.45
0.70
0.58
0.24
0.61
0.45
0.45
0.75
0.40
0.78
0.33
0.50
0.36
0.61
0.4
0.36
0.22
0.54
0.33
0.37
0.29
0.47
2592
m6
Int.J.Curr.Microbiol.App.Sci (2018) 7(7): 2588-2597
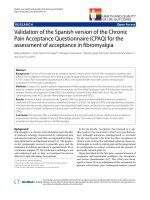
Fig.1 Amplification profiles of parents and mutants (8) RAPD Primer OPA 10, DNA source in
the lanes are p1= in vivo raised parent, p2=in vitro raised parent, pm1-pm3= in vivo raised
mutants, pm4-pm6= in vitro raised mutants.
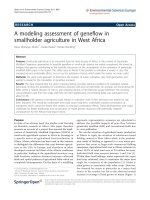
Fig.2 Dendogram generated by RAPD primers in mutant and parent genotype
2593
Int.J.Curr.Microbiol.App.Sci (2018) 7(7): 2588-2597
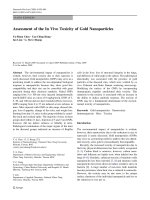
Fig.3 PCA analysis of RAPD primers for mutant and parent genotypes
It can be described as the change which occur
in the M1 generation, in information status
and may be heritable, which is referred as
epigenetic. The effective information content
has not been changed only by means of the
actions of a protein or proteins on DNA
(Wang, 1993). However, marigold is a
heterozygous crop, so there may be presence
of widely diverse genes, the primary DNA
sequence could be altered through irradiation
but could not transferred in all the mutant
population the similar type results were
obtained by Lefort et al., (1999). Mutation
can result in several different types of change
in DNA sequences; these can have no effect,
alter the product of a gene, or prevent the
gene from functioning (Johnson et al., 1955).
May be these are the reasons of deriving
colour mutant (v4, v2, v5, v6 and v7) in M1.
However, to the damaging effects that
mutations can have on cells, organisms have
evolved mechanisms such as DNA repair to
remove mutations (Reiter et al., 1992). That
would be the primary reason of not getting a
true colour putative mutant, the conclusion
lend the support from the finding of
Bandyopadhyay et al., (1997).
Molecular characterization of putative
mutants
The polymorphism survey among parents and
the putative mutants was carried out using the
bulked DNA sample in each case. A total of
60 RAPD primers were used for initial
screening. Out of these 5 and 12 primers were
selected based on clear and reproducible
bands (Table 3). With 5 RAPD primers a total
of 25 reproducible bands were obtained. Of
these 12 (48.0 %) were polymorphic. The
mean polymorphism level (i.e. per cent
polymorphism) was 43.75 % ranging from
25.0 % (OPB 10) to 62.5 % (OPA 10). The
maximum number of polymorphic bands (5.0)
was obtained with the primer OPA 10
followed by OPD 2 (3.0) and OPA 3 (2.0).
The average number of polymorphic bands
per primer was 2.4. Primer resolving power
and effective multiplex ratio were found to be
highest (3.15 and 2.65 respectively) for the
primer OPA 10, while lowest was for the
primer OPB 10 (0.02 and 1.2 respectively)
(Table 3). Maximum marker index (MI) was
observed 0.18 for the primer OPD 7 and also
diversity index (DI) was comparatively higher
(0.12).
2594
Int.J.Curr.Microbiol.App.Sci (2018) 7(7): 2588-2597
Genetic diversity between parents and
obtained putative mutants accessions were
determined on the basis of Jaccard’s Pairwise
Similarity Coefficients (Table 4). In RAPD
analysis, the greatest similarity (0.78) has
been seen in between Putative mutant 1 and
Putative mutant 4, followed by the Putative
mutant 1 and Putative mutant 2 (0.75).
Putative mutant 3 and both the parents (Parent
1 and Parent 2) showed least pair-wise
similarity (0.24). The population average was
0.49. This proves that the Putative mutant 3
could be isolated as solid mutant for M2
generation. In RAPD analysis, (Fig. 1) the
clusters were identified in such a manner that
the similarity within the group was greater but
between groups, it should be less. Thus, all
the point of population average of 0.46
similarities, the cluster was designated and it
resulted in identification of three major
clusters. Cluster I included two parents
(Parent 1 and Parent 2) and three putative
mutants, i.e. Putative mutant 1, Putative
mutant 4 and Putative mutant 2. Cluster II had
two putative mutants; viz., Putative mutant 5
and Putative mutant 6. Putative mutant 3 is
placed separately as different taxa. The 3D
plot of first three principal components is
presented in Fig. 2. PC 1, PC 2 and PC 3 used
for depicting the three dimensional
coordinates explained 29.94%, 19.02% and
8.94% variation. Since it is only 57.9%
variation, 60 principal components were
required to explain 100% variation. Three
groups were identified the PCA and among
them cluster 1 was identified to be more
diverse
stages of development. Mutations in these
genes may lead to early lethality or may be
highly pleiotropic, which can mask the role of
a gene in a specific pathway (Hallden et al.,
1996). Due to these reasons, the using the
morphological characters selection of the
solid mutant is very difficult from the large
putative mutants population. In the RAPD
assay, the nature of the fragments that are
amplified is highly dependent on the primer
sequence and on the genomic DNA sequence
being assayed. Primers differing by a single
nucleotide generate quite different profiles.
Thus, this technique may detect single base
changes in genomic DNA if sufficient primers
are assayed (Gilmour, 1994). Among all the
genotypes, the highest level of dissimilarity
was observed in pm3 with the parents.
Randomly amplified polymorphic DNA
markers, which can quickly detect a large
number of genetic polymorphism, have led to
the creation of genetic maps in a number of
crops (Luo et al., 2002) and RAPD markers
have used to detect mutations and DNA
damage (Atienzar et al., 2002),. Similarly,
Yang and Schmidt (1994) used the RAPD
analysis to differentiate mutants developed by
X-rays treated cherry leaf plants. Concurrent
report was made by Deng et al., 1995
reported that RAPD analysis can be used for
lime for the identification of 14 in vivo and
one in vitro lemon mutants in comparison
with a known zygotic origin genotype (Fig.
3).
Mutation that results in overt phenotypes
reflecting the function of the corresponding
gene, however, can be uncovered by
mutagenesis for two main reasons. First,
many genes are functionally redundant,
sharing overlapping functions with other
genes that may or may not be related at the
sequence level (Pooler and Scorza, 1995).
Secondly, many genes function at multiple
The pm 3 was found most dissimilar (0.24)
with the parents. The pm1 and pm4 was had
found almost similar coefficient (0.70 and
0.61 respectively) to the parents and also they
were quite similar with each other (0.78). The
pm3 can be regarded as solid mutant. pm 5, 6
are similar to each other and can be isolated
as solid mutant as they are different than the
parent at 0.45 similarity coefficient value.
Mutant identification
markers
2595
with
molecular
Int.J.Curr.Microbiol.App.Sci (2018) 7(7): 2588-2597
Here it could be concluded that the Putative
mutant 3, 5 and 6 were isolated as solidd
mutants in M1 generation.
References
Atienzar, F. A., Venier, P., Jha, A.N. and
Depledge, M.H. 2002. Evaluation of
the random amplified polymorphic
DNA (RAPD) assay for the detection
of DNA damage and mutations,
Mutation
Res./Genet.
Toxicol.
Environ. Mutagen., 521: 151-163.
Bandyopadhyay, P., Das, D.K. and
Chattopadhyay,
T.K.
(1997).
Correlation and path analysis in seed
production of marigold as affected by
the micronutrient application. Hort. J.,
10: 73-78.
Deng, Z.N., Gentile, E., Nicolosi, E., Domina,
F., Vardi, A. and Tribulato, E. (1995).
Identification of in vitro and in vivo
lemon mutants by RAPD markers. J.
Hort. Sci., 70: 117-125.
Gilmour, M. 1994. The BCCCA Ring test on
the RAPD analysis of cocoa. Proc. Int.
Work Cocoa Breed. Start. Kuala
Lumpur, pp.135-138.
Hallden, C. Hansen, M. Nilsson, N., Hjerdin,
A. and Sall, T. 1996. Competition as a
source of error in RAPD analysis.
Theor. Appl. Genet., 93: 1185-1192.
Johnson, H.W., Robinson, H.F., Comstock,
R.E. 1955. Estimates of genetic and
environmental variability in soybean.
Agron. J. 47: 477-483.
Lefort, F. and Douglas G. C. 1999. An
efficient micro-method of DNA
isolation from mature leaves of four
hard-wood tree species. Ann. Forest
Sci., 56: 259-263.
Leyser, M. 2000. Genetics and Analysis of
Quantitative Traits. Sinaure Assocs.
Inc., Sunderland, Massachusetts,
USA, 980p.
Luo, S., He, P., Zheng, X. and Zhou, P., 2002.
Inheritance of RAPD markers in an
interspecific F1 hybrid of grape
between Vitis quinquangularis and V.
vinifera. Sci. Hort., 93:19-28.
Maple, A.J. and Moller, J.P. 2007.
Cytogenetics of mutants in triticale.
Plant Breed Rev. 5: 41-93
Omar, C., Alikarnanoglub, S., Acik, L. and
Canbolatb, Y. 2008. Plant breeding
program aided by radiation treatment.
Calif. Aggr., 14:4-5.
Pooler, M. and Scorza, R. 1995. Aberrant
transmission of RAPD markers in
haploids, double haploids and F1
hybrids of peach: Observations and
speculations on causes. Sci Hort., 64:
233-241.
Raghava, S.P.S. 1995. Genetic improvement
of African marigold In: Proc. National
Seminar on Ornamental Horticulture
and Environment, Calcutta, 111-119.
Reiter, R.S., Williams, J.G.K., Feldman,
K.A., Rafalski, A., Tingey, S.V. and
Scolnik, P.A. 1992. Global and local
genome mapping in Arabidopsis
thaliana by using recombinant inbred
lines
and
random
amplified
polymorphic DNAs. Proc. Natl. Acad.
Sci. USA., 89: 1477-1481.
Rohlf, F.J. (2000). NTSYS-pc Numerical
taxonomy and multivariate analysis
system, Version 2.02 extern software,
Setauket, New York, USA, pp.843.
Sangyoung, N., Kyoungmi, K., Hanchul, K.
and Kang, H. C. 2007. Selection of a
primer in the randomly amplified
polymorphic DNA (RAPD) analysis
for genetic relationship of grapes.
RDA Journal of Hort. Sci., 40: 30-35.
Tsaftaris, A.S., Kafka, M., Polidoros, A. and
Tani, E. 2006. Epigenetic change in
Vigna mungo DNA and mutagenesis
In: J.G. Coors and S. Pandey (eds.),
Genet. Exploit. Heterosis Crop, pp.
195-203.
Wang, H., Parent, S., Gosseliu, A. and
2596
Int.J.Curr.Microbiol.App.Sci (2018) 7(7): 2588-2597
Desjardins, Y. 1993. Vesiculararbuscular mycorrhizal peat-based
substrates
enhance
symbiosis
establishment and growth of three
micropropagated species. J. American
Hort. Sci., 118: 896-901.
William, J.G.K., Kubelic, A.R., Livac, K.J.,
Rafalski, J.A. and Tingey, S.V. 1990.
DNA polymorphism amplified by
arbitrary primers is useful as genetic
markers. Nucleic Acid Res., 18: 65316535.
Yang, H. and Schmidth, H. 1994. Selection of
mutants from adventitious shoots
formed in X-rays treated cherry leaves
and differentiation of standard and
mutant with RAPDs. Euphytica,
77:89-92
How to cite this article:
Jayoti Majumder, S. K. Singh and Manjusha Verma 2018. Assessment of Mutation in Marigold
(Tagetes erecta L.) using Morphological and Molecular Markers Int.J.Curr.Microbiol.App.Sci.
7(07): 2588-2597. doi: />
2597