Developing a selection criterion for terminal heat tolerance in bread wheat based on various mopho-physiological traits
Bạn đang xem bản rút gọn của tài liệu. Xem và tải ngay bản đầy đủ của tài liệu tại đây (459.83 KB, 11 trang )
Int.J.Curr.Microbiol.App.Sci (2018) 7(7): 2716-2726
International Journal of Current Microbiology and Applied Sciences
ISSN: 2319-7706 Volume 7 Number 07 (2018)
Journal homepage:
Original Research Article
/>
Developing a Selection Criterion for Terminal Heat Tolerance in Bread
Wheat Based on Various Mopho-Physiological Traits
Devender Sharma*, J.P. Jaiswal, N.K. Singh, Anjana Chauhan
and Navin Chander Gahtyari
Department of Genetics and Plant Breeding, G.B.Pant University of Agriculture &
Technology, Pantnagar -263145 (Uttarakhand), India
*Corresponding author
ABSTRACT
Keywords
Wheat, heat stress,
Canopy temperature
depression;
membrane
thermostability,
1000 Grain Weight,
Normalizes
Difference
Vegetation index
Article Info
Accepted:
20 June 2018
Available Online:
10 July 2018
Wheat (Triticum aestivum L.), a staple food crop is of great commercial importance. Its
production is restricted due to various abiotic stresses. There are indications that the wheat
production is consistently limited by terminal heat stress. Here, performance of forty
genotypes of wheat was undertaken for assessment of direct selection parameters
(variability, heritability and genetic advance) and their relation with heat tolerance. The
plants were sown in late planting (first fortnight of December) to expose them to terminal
heat stress. Observations were recorded on fourteen morpho-physiological traits i.e. days
to heading, days to maturity, grain filling duration, number of tillers per plant, spike
length, grain yield per plant, 1000-kernel weight, CTD-I, CTD-II, CTD-III, NDVI-I,
NDVI-II, NDVI- III and membrane thermostability. High heritability associated with high
genetic advance reflected for physiological traits like canopy temperature depression and
membrane thermostability. That indicated effectiveness of selection for the improvement
of these traits. Moderate estimate of genetic advance (25%-50%) exhibited for number of
tillers per plant, NDVI I, CTD (I & II) and spike length. For all the morpho-physiological
traits studied, the estimates of phenotypic variance were exhibited higher than their
corresponding genotypic variances, indicating the influence of environment on the
expression of these morpho-physiological characters were observed. These finding
suggests the relative importance of various physiological traits in formulating the selection
criteria for developing thermotolerant wheat cultivars.
Introduction
Wheat (Triticum aestivum L.), a cereal grass
belong to Poaceae family and of the genus
Triticum, is the world’s largest cereal crop
extensively grown as staple food in the world.
Wheat is grown on 223.67 million hectares
throughout the world, which produces 735.3
million tons of grain (USDA, 2017). It
provides, on an average, 20% of daily calories
and protein for 4.5 billion people (Shiferaw et
al., 2013).Wheat in India is grown over an
area of 30.72 million ha producing 98.30
million tonnes (ICAR-IIWBR, 2017). It
occupies an inimitable position in human life
as it is the major source of food and energy
2716
Int.J.Curr.Microbiol.App.Sci (2018) 7(7): 2716-2726
with a large number of products like chapathi,
biscuits, bread and pasta, even it is a good
source of fodder for animals.
Wheat production is limited by current and
upcoming challenges including reduced land,
reduced
water
availability
increased
temperature due to global warming under
climatic shift (Fischer et al., 2002). Among
these, increased temperature stress is
increasingly causing a concern as the global
air temperature is predicted to rise by 0.2 °C
per decade, leading to temperatures 1.8–4.0 °C
higher than the current level by 2100 (IPCC
2007). Even now heat stress affects 40% of
the wheat growing area of the world covering
about 36 million ha (Reynolds et al., 2001).
Every 1°C rise in temperature above the
optimal 28°C reduces wheat yield by 3-4%
(Wardlaw et al., 1989).
The terminal heat stress at anthesis and grain
filling stages accelerate maturity and
significantly reduce grain size, weight and
yield (Rane et al., 2000; Lane et al., 2007;
Kosina et al., 2007). Physiological responses
of wheat crop to terminal heat stress have been
found to effectively determine genotype
tolerance or susceptibility (Almeselmani et al.,
2000). There is urgent need for immediate
attention to develop heat tolerance wheat
genotypes by combining different approaches.
The genetic potential of different cultivars for
the presence of diversity, stability in
performance are measured by statistical
parameters such as mean, variance, coefficient
of variation (%), heritability and genetic gain
(Ali et al., 2008). Grain yield is a complex
trait and is greatly influenced by various
environmental factors. Various morphophysiological traits contribute to grain yield in
heat stress conditions. Each of these
component traits has its own genetic systems.
Therefore, it is necessary to separate the total
variation into heritable and non-heritable
components with the help of genetic
parameters i.e. genotypic and phenotypic
coefficient of variation, heritability and
genetic gain (Kahrizi et al., 2010). The
phenotypic variance measures the magnitude
of variance arising due to genetic component
and environmental factors. The heritability is a
measure of the genetic relationship between
parents and progeny, hence considerable
research work has been carried out to
incorporate desirable genes in the present
wheat varieties to increase the productivity of
the crop (Memon et al., 2007). Here, Morphophysiological evaluation of wheat genotypes
was performed under late sown condition to
assess genetic variability and develop
selection
criteria
for
developing
thermotolerant cultivars.
Materials and Methods
A set 40 diverse wheat genotypes (Triticum
aestivum L.) were selected (Table 1) for field
experiments conducted at Dr. N.E. Borlaug
Crop Research Centre of GB Pant University
Agriculture and Technology, Pantnagar, India
in rabi season during 2017–2018. The plants
were sown in late planting (first fortnight of
December) to expose them to terminal heat
stress. The experiment was conducted in three
replicates; in randomized block design with
three rows and 23 cm inter row spacing. Seven
morphological traits i.e. days to heading, days
to maturity, grain filling duration, number of
tillers per plant, spike length, grain yield per
plant, 1000-kernel weight, CTD-I, CTD-II,
CTD-III, NDVI-I, NDVI-II, NDVI- III and
membrane thermostability. Nineteen morphophysiological traits i.e. days to heading, days
to maturity, grain filling duration, plant height,
peduncle length, number of tillers per plant,
spike length, total number of spikelets per ear,
biological yield per plant, grain yield per
plant, harvest index, 1000-kernel weight
Seven morphological traits i.e. days to
heading, days to maturity, grain filling
2717
Int.J.Curr.Microbiol.App.Sci (2018) 7(7): 2716-2726
duration, number of tillers per plant, spike
length, grain yield per plant, 1000-kernel
weight and three physiological traits i.e.
canopy temperature depression (CTD recorded
separately at three growth stages), Normalized
difference
vegetation
index
(recorded
separately at three growth stages) and
membrane thermostability were studied in late
sown conditions during rabi2017-18. The
method for recording these physiological traits
is described below.
Canopy temperature depression (CTD)
The ambient temperature and canopy
temperature of whole plant was taken between
1200 hours and 1400 hours at heading stage of
the crop. Canopy temperature depression
(CTD) is the difference between ambient
temperature and canopy temperature. CTD
was measured with the help of Infra-red
thermometer. Canopy temperature depression:
Canopy temperature depression was recorded
at 10 days interval. In which first reading was
recoded at 50 percent flowering (CTD-I),
second at 10 days after 50 percent flowering
(CTD-II) and third at 20 days after 50 percent
flowering (CTD-III),
Normalized difference vegetation index
(NDVI)
Observation collected using green seeker
instrument at different stages of the crop plant.
The observations were taken at 50% flowering
stage (NDVI-I), at 10 days after 50%
flowering stage (NDVI-II), at 20 days after
50% flowering stage (NDVI-III).
Membrane thermostability
Leaf samples were taken from the uppermost
fully expanded leaves and 3-5 cm long
segments were excised from each of 10
healthy seedlings from each replication per
genotype. For removal of any adherent these
samples were rinsed twice with deionized
water, and placed in 22×150 mm test tubes
with 10 ml of deionized water. The test tube
was covered with an aluminium foil. Severe
heat stress was applied by submerging test
tubes to a depth equal to the height of water in
tubes (about 4 cm) in a water bath at 49ºC for
30 minutes. After that, the test tubes were held
over night at room temperature. Very next
day, electrical conductivity of each test tube
sample was measured with an electrical
conductivity meter after standardizing it with a
KCl solution. Then the kill the leaf tissues of
the test tubes were then autoclaved for ten
minutes at 120ºC and 0.10 MPa and their
conductance was measured again as an
indication of the maximum potential leakage
from a given sample (Ibrahim et al., 2001)..
Membrane thermostability was calculated by
using the following formula (Sullivan 1972):
Where, T1 and T2 are the conductivity
readings before and after autoclaving,
respectively.
Observations were statistically analysed with
the help of OPSTAT for genetic variability
parameter
to
determine
allelic
diversity(Johnson et al., 1955; Burton 1952).
Results and Discussion
The analysis of variance for different morphophysiological characters is presented in Table
2. The results showed highly significant
difference for most of the characters under
study among twenty genotypes. This
suggested that there is an inherent genetic
difference among the genotypes.
Physiological
traits
revealed
relative
importance of their contribution towards
2718
Int.J.Curr.Microbiol.App.Sci (2018) 7(7): 2716-2726
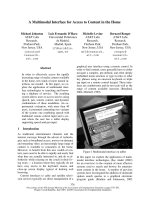
terminal heat tolerance. Canopy temperature
depression
and
normalized
difference
vegetation index exhibited the same trend with
respect to different growth stages (Singh and
Jaiswal, 2013; Abdipur et al., 2013) As the
crop matures the depression value goes on
decreasing because canopy gets hotter and
results in lower photosynthetic assimilation
which leads to lower yield (Fig. 1). NDVI
reflects the chlorophyll content in the plant.
As the crop matures or plant gets under heat
stress, there is breakdown of chlorophyll
present in the leaves (Dwivedi et al., 2003).
The genotypes showing higher NDVI values
will result in greater photosynthetic
accumulation and tolerance to heat stress (Fig.
2). Membrane thermostability represents the
ability of cell membrane to resist leakage of
solutes from the cells. The genotypes
exhibiting more leakage of solutes were
mainly heat sensitive genotypes (Reynoldas et
al., 1994, Abdipur et al., 2013; Rehman et al.,
2016).
An assessment of genetic variability revealed
that there was an ample amount of genetic
variation among the genotypes. In general
values of phenotypic coefficient of variation
(PCV) were found higher than their respective
genotypic coefficient of variation (GCV)
indicating the considerable influence of
environment in the performance of these
genotypes. For all characters under study,
PCV was found slightly higher than GCV in
each case, revealing the prominent role of
environment in the expression of these
characters. The estimates of range, mean,
PCV, GCV, heritability (broad sense) and
genetic advance are presented in Table 3. The
characters like canopy temperature depression
(I, II & III), exhibited higher values of
phenotypic variance while other traits also
showed similar trend. This suggests that there
is a good scope of selection for these factors
(Singh et al., 2007; Dwivedi et al., 2003). The
phenotypic coefficient of variation was higher
than their respective genotypic coefficient of
variation for all the traits (Dixit 1990; Singh et
al., 2008; Tripathi et al., 2015). Canopy
temperature depression showed maximum
phenotypic coefficient of variation. This
variation was minimum for days to maturity
(Porwal et al., 2006; Jaiswal et al., 2010).
Estimates of phenotypic variance (σ2p) were
higher than genotypic variance (σ2 g) (Table
2). A wide range of (σ2 p) was observed for
canopy temperature depression (I, II & III)
while moderate range of variance showed by
the traits number of tillers per plant spike
length, NDVI III and thermostability at
different physiological stages. The result of
phenotypic coefficient of variation revealed
that CTD-III exhibited highest phenotypic
coefficient of variation (43.37) followed by
CTD-II (33.21). Also CTD-I at different
stages showed wide phenotypic coefficient of
variation while, the remaining characters
showed moderate to low phenotypic
coefficient of variation.
Genotypic coefficient of variation was high
for CTD-III (33.99) followed by yield per
plant (26.61). Also chlorophyll content and
CTD at different stages showed wide
genotypic coefficient of variation. And
remaining characters showed moderate to low
genotypic coefficient of variation [Panwar and
Singh (2000); Ali et al., (2008), Arvind and
Raj (2015)]. The minimum value of genotypic
coefficient of variation was observed for days
to anthesis, days to maturity and CTD. Thus,
the traits with high GCV are to be considered
during selection (Arya and Jaiswal, 2015).
Similar studies with respect to PCV and GCV
were carried out by various workers.High
genotypic and phenotypic coefficient of
variation for canopy temperature depression
(at anthesis), canopy temperature depression
(at 10 days after anthesis) was also in
agreement with Gowda et al., (2011). The
2719
Int.J.Curr.Microbiol.App.Sci (2018) 7(7): 2716-2726
substantial differences observed between
genotypic and phenotypic coefficient of
variation showed the effect of environment in
determining the total phenotypic variation
Jaiswal et al., (2010). High estimates of
genotypic and phenotypic coefficient of
variation for canopy temperature depression
(III) suggest sufficient variability, therefore
offers scope of genetic improvement of the
character through selection.
The heritability ranged from 52.02 percent to
97.1 percent. High heritability estimate was
exhibited by membrane thermostability
(93.35), NDVI-III (87.10), NDVI-I (8.10) and
NDVI-II (85.77). The remaining traits showed
moderate levels of heritability (Dwivedi et al.,
2003; Atta et al., 2008; Zecevic et al., 2010).
The estimates of heritability alone cannot
predict the response to selection. Heritability
estimates appear to be more meaningful when
accompanied by the estimates of genetic
advance than alone (Johnson et al., 1955).
Thus genetic advance has an added edge over
heritability as a guiding factor to breeders in
various selection programmes. Genetic
advance expressed as a percentage of mean
was observed to be high (>50%) for canopy
temperature depression (CTD I) and
membrane thermostability (Zecevic et al.,
2010, Rehman et al., 2016). Genetic advance
coupled with high heritability was reported for
canopy temperature depression and membrane
injury percentage (Kumar et al., 2016; Gowda
et al., 2011), which is in conformity with the
present findings.
Table.1 List of wheat genotypes used in the experiment
S. No. Genotype
PBN-51
1
S. No. Genotype
15
HD2864
S. No. Genotype
IC252874
29
2
BWL-0814
16
RAJ4083
30
IC212185
3
BWL-1771
17
DBW-14
31
SALEMBO
4
BWL-9022
18
BARKAEE
32
ARIANA66
5
BWL-0924
19
Giza168
33
GIZA155
6
BWL-1793
20
IC32586
34
BACANORA88
7
CUS/79/PRULLA
21
K9465
35
IC118737
8
IEPACA RABE
22
RAJ4037
36
C-306
9
SIDS1
23
TEPOKO
37
HD2967
10
SUNSTAR
24
BABAX
38
PBW343
11
CHIRYA-3
25
OTHERI EGYPT
39
RAJ3765
12
DHARWAD DRY
26
IC532653
40
WH730
13
HD3086
27
SERI82
14
HI1563
28
SONORA64
2720
Int.J.Curr.Microbiol.App.Sci (2018) 7(7): 2716-2726
Table.2 Analysis of variance for different characters
Source
Character
Replication
Treatments
Error
Mean squares of morpho-physiological traits
d.f. DH
DM GFD
TILLER SL
GY
TKW
CTD I CTD II CTD III
2
1.13
2.16 1.26
1.98
0.01
2.06
1.56
0.54
2.29
2.21
39 3.87** 6.04* 8.05** 19.38** 8.27** 7.22** 31.45** 10.83** 8.48** 6.01**
78 0.7
1.55 1.16
1.74
0.93
1.07
1.13
1.9
1.99
1.04
NDVI I
1.76
56.98**
2.68
NDVI II
1.45
107.28**
5.62
NDV III
3.66
262.66**
2.62
MSI
0.82
205.88**
1.85
DH-Days to heading, DM- Days to maturity, GFD- Grain filling duration, TILLER- Number of tillers per plant, SLSpike length (cm), GY- Grain yield per plant (g)TKW-1000-kernel weight, MSI- Membrane thermostability
Table.3 Estimates of parameter of variability for wheat genotypes
Traits
Mean
S.E(m)
Range
DH
Max
Min
PCV (%)
GCV (%)
ECV (%)
Heritability h²bs (%)
Expected GA (%)
DM
GFD
78.07 111.17 33.10
0.48
0.42
0.62
75.33 108.67 29.12
84.67 118.33 39.33
1.71
1.39
5.63
1.32
1.22
4.59
1.08
0.67
3.26
60.15 76.83 66.46
2.11
2.21
7.70
TILLER
SL
GY
TKW CTD I CTD II
9.79
0.42
5.67
15.33
28.19
24.76
13.47
77.16
44.81
10.65
0.82
6.33
15.17
17.26
14.69
9.06
72.46
25.76
21.82
0.77
19.30
24.31
8.10
6.57
4.74
65.72
10.96
35.56
0.21
29.65
40.95
9.45
8.96
3.00
89.94
17.50
7.26
0.79
5.56
9.78
30.41
23.76
18.98
61.04
38.24
6.09
0.52
3.39
8.32
33.21
23.95
23.01
52.02
35.59
CTD III
NDVI I
3.83
0.12
0.58
6.97
43.37
33.99
26.94
61.42
54.87
0.75
0.47
0.67
0.83
6.05
5.65
2.17
87.10
10.86
NDVI
II
0.64
0.47
0.43
0.74
9.94
9.20
3.75
85.77
17.56
DH-Days to heading, DM- Days to maturity, GFD- Grain filling duration, TILLER- Number of tillers per plant, SLSpike length (cm), GY- Grain yield per plant (g)TKW-1000-kernel weight, MSI- Membrane thermostability
2721
NDV III
MSI
0.45
0.46
0.22
0.62
20.89
20.58
3.58
97.07
41.78
30.95
0.53
14.89
49.64
26.97
26.61
4.39
97.35
54.09
Int.J.Curr.Microbiol.App.Sci (2018) 7(7): 2716-2726
Fig.1 Comparative presentation of Canopy temperature depression at different growth
stages
Fig.2 Comparative presentation of chlorophyll content (NDVI value) at different growth
stages
2722
Int.J.Curr.Microbiol.App.Sci (2018) 7(7): 2716-2726
Moderate estimate of genetic advance (25%50%) was reported for number of tillers per
plant, NDVI I, CTD (I & II) and spike length,
whereas low estimate of genetic advance was
reported for rest of the traits like grain yield
per plant and 1000 kernel weight (Singh et
al., 2008; Tripathi et al., 2015; Zecevic et al.,
2010).To predict the reliable estimates of
additive or non-additive effects, heritability
should be considered in conjugation with
genetic advance (Burton 1952, Johnson et al.,
1955). High heritability with high genetic
advance
was
found
for
membrane
thermostability indicated the additive effect of
genes and selection may be effective for the
trait. High heritability with moderate genetic
advance was reported by NDVI, grain weight
per spike and flag leaf length, which revealed
the presence of both additive and non-additive
gene effects (Soumitra et al., 2016). However,
traits like 1000 kernel weight, NDVI (II &III)
with high heritability and low genetic advance
indicated the role of non-additive gene action
(Reynoldas et al., 1994). Thus improvement
of such traits was suggested through
hybridization followed by selection.
In conclusion, climate change and sustainable
development are interlinked problems that
pose a serious challenge to humanity. High
temperature stress in the recent years has been
major factor affecting the wheat productivity.
The selection of wheat genotypes with better
grain yield and tolerance is the principal aim
of wheat production. It can be concluded from
the above mentioned findings that the
genotypes used in the study exhibited
considerable variability for various morphophysiological traits under study, thus
providing the ample scope for selection of
elite genotypes which can be further utilised
for developing thermotolerant cultivars.
Physiological traits i.e. canopy temperature
depression,
chlorophyll
content
and
memberane thermostability exhibited higher
than their corresponding genotypic coefficient
of variation, it can be interpreted as less
difference in the estimates of genotypic and
phenotypic variance reflected little influence
of environment on these traits. Higher
genotypic
variances
compared
to
environmental variances for all the characters
suggested that the variability present among
the genotypes were mainly due to genetic
reason with minimum influence of
environment and hence heritable. These
physiological traits exhibited high genetic
gain, which indicates that these traits will
directly respond to selection due to presence
of additive genes. So, formulating a selection
criterion for developing thermotolerant
cultivars these physiological traits must be
kept in mind. These physiological traits can
be coupled in addition to morphological traits
for developing thermotolerant cultivars.
Acknowledgments
Authors are thankful to Director Research, G.
B. Pant University of Agriculture and
Technology, Pantnagar-263 145 (Uttaranchal,
India) for providing research facilities and
Washington State University, Pullman, USA
for sharing the research material. Work on
plant stress tolerance in laboratory is partially
supported by Department of Biotechnology
(DBT), Government of India.
References
Abdipur, M., Ramezani, H.R., Bavei, V. and
Talaee S. 2013. Effectiveness of
Canopy Temperature and Chlorophyll
Content Measurements at Different
Plant Growth Stages for Screening of
Drought Tolerant Wheat Genotypes.
American-Eurasian J. Agric. &
Environ. Sci., 13 (10): 1325-1338
Ali, Y., Atta, B.M., Akhter, J., Monneveux,
P., Zahid, L. 2008. Genetic variability,
association and diversity studies in
wheat
(Triticum
aestivum
L.)
2723
Int.J.Curr.Microbiol.App.Sci (2018) 7(7): 2716-2726
germplasm. Pakistan Journal of
Botany., 40(5): 2087-2097.
Almeselmani,
M.,
Deshmukh,
P.S.,
Chinnusamy, V. 2012. Effect of
prolong high temperature stress on
respiration, photosynthesis and gene
expression in wheat (Triticum
aestivum L.) varieties differing in their
thermotolerance. Plant Stress. 6:25–
32.
Arvind, K., Raj, S. 2015. Genetic variability
in relation to qualitative and
quantitative traits in wheat (Triticum
aestium L.). Agrica Journal 3(2): 2328.
Arya, M. and Jaiswal, J.P. 2015.Screening for
heat tolerance in wheat germplasm by
applying
physiological
and
biochemical
indices.
Electronic
Journal of Plant Breeding, 6(1): 341349
Atta, Y.A., Akhter, B.M.J,, Lateef, P.Z.
2008.Genetic variability, association
and diversity studies in wheat
(Triticum aestivum L.) germplasm.
Pakistan Journal of Botany 40(5):
2087-2097.
Burton, G.W. and Vane, E.W. 1953.
Estimating heritability in tall Fescue
(Festucaarund inacea) from replicated
colonal material. Agronomy Journal.
45: 478-481.
Dixit, S.K. 1990.Variability pattern in durum
wheat under different sowing path
analysis inland races of bread wheat
from South Western Iran. Euphytica
41: 183-190.
Dwivedi, V.K., Kumar, S., Tyagi, N.K.
2003.Genetic variability in some
metric traits and it contribution to
yield in wheat (Triticum aestivum L.).
Progressive Agriculture, 3(1/2): 152153.
Fischer, G., Shah, M. and Van, V. H. 2002.
Climate change and agricultural
vulnerability. World summit on
sustainable
development,
Johannesburg.
Gowda, D.S., Singh, G. P. and Singh, Anju
M. (2011). Relationship between
canopy
temperature
depression,
membrane stability, relative water
content and grainyield in bread wheat
(Triticum aestivum) under heat-stress
environments. Ind. J. Agri. Sc.
81(3):197-202.
Ibrahim, A. M. H., Quick, J. S.
2001.Heritability of heat tolerance in
winter and spring wheat. Crop Sci.,
41: 1401-1405.
ICAR-IIWBR, 2017.Director’s Report of
AICRP on Wheat and Barley
Improvement Project 2016-17. Ed: G.
P. Singh, ICAR-Indian Institute of
Wheat and Barley Research, Karnal,
India., P.87.
Intergovernmental Panel on Climate Change
(IPCC) Climate change 2007–The
physical science basis. In Contribution
of Working Group I to the Fourth
Assessment
Report
of
the
Intergovernmental Panel on Climate
Change; Cambridge University Press:
Cambridge, UK, 2007.
Jaiswal J.P., Arya M., Kumar A., Swati and
Rawat R.S. 2010. Assessing genetic
diversity for yield and quality traits in
indigenous bread wheat germplasm.
Electronic Journal of Plant Breeding,
1(4): 370-378.
Jaiswal, J.P., Bhowmick P.K. and Grover, A.
2010. Selection of bread wheat
genotypes for heat tolerance based on
physiological
traits
and
heat
shockproteins.8th International Wheat
Conference, June 1-4, St. Petersberg,
Russia.
Johnson, H.W., Robinson, H.F. and
Comstock, R.E. 1955. Estimates of
genetic and environmental variability
in soybeans. Agronomy Journal.47:
314-318
2724
Int.J.Curr.Microbiol.App.Sci (2018) 7(7): 2716-2726
Kahrizi, D., Cheghamriza, K., Kakaei, M.,
Mohammadi,
R.,
Ebadi,
A.
2010.Heritability and genetic gain of
some morpho-physiological variables
of durum wheat (Triticum turgidum
var. durum). Afr. J. Biotechnol., 9(30):
4687- 4691.
Kosina, P., Reynolds, M.P., Dixon, J., Joshi,
A. 2007.Stakeholder perception of
wheat production constraints, capacity
building
needs,
and
research
partnerships
in
developing
countries. Euphytica. 2007; 157: 475–
483.
Kumar, A., Swati, Jaiswal, J.P., Bharati, A.
and Goel, P. 2016.Characterization of
wheat genotypes using morphophysiological traits for heat tolerance.
Applied Biological Research, 18(2): 815.
Lane, A., Jarvis, A. 2007. Changes in Climate
will modify the Geography of Crop
Suitability: Agricultural Biodiversity
can help with Adaptation. eJournal. 4:
1–12
Memon, S.M., Qureshi, M.U., Ansari, B.A.
and
Sial,
M.A.
2007.Genetic
heritability for grain yield and its
related characters in spring wheat.
Pak. J. Bot. 39 (5):1503- 1509
Panwar, D., Singh, I. 2000. Genetic
variability and character association of
some yield components in winter x
spring nursery of wheat. Advances in
Plant Science, 8(1): 95-99.
Porwal, Y., Prasad, S.V.S., Billore, M.
2006.Association of path analysis for
grain yield, its components and quality
traits in bread wheat. National Journal
of Plant Improvement 8(1): 24-27.
Rane J, Shoran J, Nagarajan S.2000. Heat
stress environments and impact on
wheat
productivity
in
India:
Guestimate of losses. Indian Wheat
News Letter. 2000; 6:5–6.
Rehman, U.R., Muhammad, B., Rashid M.R.,
Tahir, M.N., Muhammad, K.N.S.,
Habtamu,
A.,
and Guijun,
Y.
2016.Cell membrane stability and
chlorophyll content variation in wheat
(Triticum aestivum) genotypes under
conditions of heat and drought. Crop
and Pasture Science. 67(7): 712-718.
Reynolds, M. P. 1994. Summary of data from
the 1st and 2nd International Heat
Stress Genotype Experiment. In :
Saunders, D. A. and Hettel, G. P. eds.
Wheat in Heat Stressed Environments:
Irrigated, Dry Areas and Rice Farming
Systems.
Proceedings
of
the
International Conference, Wheat in
Hot, Dry, Irrigated Environments.
Mexico, D.F.: CIMMYT.
Reynolds, M. P., Nagarajan, S., Razzaque, M.
A. and Ageeb, O.A. A. 2001. Heat
tolerance. In: Reynolds M P, Ortiz
Monasterio J I and McNab A(ed)
Application of Physiology in Wheat
Breeding. Pp. 124–35. CIMMYT,
Mexico.
Shiferaw, B., Smale, M., Braun, H.J.,
Duveiller, E., Reynolds, M., Muricho,
G. 2013. Crops that feed the world
10.Past
successes
and
future
challenges to the role played by wheat
in global food security. Food Security.
5: 291–317.
Singh, J.P, Prasadm, S., Singh, K.N., Singh,
R. 2007.Screening of heat tolerant
wheat varieties by membrane thermo
stability index in relation to yield and
yield attributing traits. International
Journal of Plant Sciences. 2(2): 159165.
Singh, N.B., Singh, Y.P., Tiwari, L.P., Bahar,
J., Singh, V.P.N., et al., (2008).
Morphophysiological traits as index of
screening wheat genotypes for
thermotolerance. Indian Journal of
Plant Physiology 13(3): 307-311
Singh, P. and Jaiswal, J.P. 2013. Assessment
of genetic diversity in Bread wheat
2725
Int.J.Curr.Microbiol.App.Sci (2018) 7(7): 2716-2726
(Triticumaestivum L. em. Thell),
genotypes
based
on
agromorphological
traits
using
Mahalanobis
‘D2’
statistic.
Environment and Ecology, 31(2A):
679-682.
Soumitra.M.,
Mukherjee,
S.,
Mukhopadhyaya, S. K., Dash, A. P.
2016.Genetic variability, correlation
and path analysis of bread wheat
(Triticum aestivum L.) Genotypes
under
terminal
heat
stress.
International Journal of Bio-Resource
& Stress Management .7(6): 12381245
Sullivan, C.Y. 1972.Mechanism of heat and
drought resistance in grain sorghum
and methods of measurement. In:
Sorghum in the seventies”, N. G. P.
Rao and L. R. House (eds.), Oxford
and IBH publishing Co. New Delhi,
India. 1972.
Tripathi, G.P., Parde, N.S., Zate, D.K., Lal,
G.M. 2015.Genetic variability and
heritability studies on bread wheat
(Triticum aestivum L.).International
Journal of Plant Sciences. 10(1/2): 5759.
USDA. 2017. World agricultural production.
Washington, DC, USA: UnitedStates
Department of Agriculture Foreign
Agricultural Service.
Wardlaw, I.F., Dawson, I.A., Munibi, P. and
Fewster, R. 1989. The tolerance of
wheat to high temperatures during
reproductive growth. I. Survey
procedures and general response
patterns. Aust J Agr Res., 40: 1-13.
Zecevic, V., Boskovic, J., Dimitrijevic, M.,
Petrovic, S. 2010.Genetic and
phenotypic variability of yield
components in wheat (Triticum
aestivum L.). Bulgarian Journal of
Agricultural Science 16(4): 4.
How to cite this article:
Devender Sharma, J.P. Jaiswal, N.K. Singh, Anjana Chauhan and NavinChanderGahtyari.
2018. Developing a Selection Criterion for Terminal Heat Tolerance in Bread Wheat Based on
Various Mopho-Physiological Traits. Int.J.Curr.Microbiol.App.Sci. 7(07): 2716-2726.
doi: />
2726