Impact of ‘Mgnregs’ on Income and employment of small farmers and labourers: A comparative study in telangana state, India
Bạn đang xem bản rút gọn của tài liệu. Xem và tải ngay bản đầy đủ của tài liệu tại đây (488.22 KB, 13 trang )
Int.J.Curr.Microbiol.App.Sci (2018) 7(7): 2236-2248
International Journal of Current Microbiology and Applied Sciences
ISSN: 2319-7706 Volume 7 Number 07 (2018)
Journal homepage:
Original Research Article
/>
Impact of ‘Mgnregs’ on Income and Employment of Small Farmers and
Labourers: A Comparative Study in Telangana State, India
D. Kumara Swamy*, C.V. Hanumanthaiah, P. Parthasarathy Rao,
K. Suhasini and V.V. Narendranath
Department of Agricultural Economics, College of Agriculture, Professor Jayashankar
Telangana State Agricultural University, Rajendranagar, Hyderabad – 500030, India
*Corresponding author
ABSTRACT
Keywords
MGNREGS,
Highest
Expenditure
Mandals (HEMs),
Lowest Expenditure
Mandals (LEMs),
Beneficiaries,
Income transition
and Wage rate).
Article Info
Accepted:
17 June 2018
Available Online:
10 July 2018
A study was conducted in former Karimnagar and Medak districts of Telangana state to
quantify the impact of Mahatma Gandhi National Rural Employment Guarantee Scheme
(MGNREGS) on small farmers and agricultural labourers by comparing the beneficiaries
with non beneficiaries. Results revealed that per farm income of non beneficiary group
farmers in Highest Expenditure Mandals (HEMs) of Karimnagar was highest i.e. ₹.42120.
Per family average income from livestock sources was highest for beneficiaries of HEMs
of Medak i.e ₹.4981 and lowest for beneficiaries of Lowest Expenditure Mandals (LEMs)
of Karimnagar i.e ₹.3025. The agricultural labourers livestock income was highest for
beneficiaries of HEMs of Medak i.e. ₹.5531 and lowest for non beneficiaries of HEMs of
Medak i.e ₹.1025. Income transition was clearly seen and majority of labourers crossed
poverty line in HEMs of Karimnagar. Beneficiary labourers in HEMs of Medak got
highest number of employment days in the study year (199.75 days) and non beneficiary
labourers in LEMs of Medak got lowest number of employment days (131.62 days) where
as non beneficiary farmers in LEMs of Karimnagar got highest number of employment
days (193.31 days) and beneficiary farmers in LEMs of Medak got lowest number of
employment days (145.06 days). Major discriminator between beneficiary and non
beneficiary farmers were total annual income (172.43%), expenditure on hired human
labour (80.59%), income from livestock (7.29%) and age of labourer (4.8%). Major
discriminating factors between beneficiaries and non beneficiary agricultural labourers
were total annual income (50.70%), social class (45.15%), total employment days got
(37.24%), family size (32.63%) and average wage rate (11.84%) respectively and 97.37 %
and 92.8% variation found in total annual income for farmers and labourers.
Introduction
Though Mahatma Gandhi National Rural
Employment Guarantee Scheme (MGNREGS)
was initiated with a specific goal of providing
minimum guarantee wage rate, employment
days, local employment etc., its ultimate
outcome on people is varied from place to
place and time to time. Few studies have
revealed a clear positive impact (Akthar,
2236
Int.J.Curr.Microbiol.App.Sci (2018) 7(7): 2236-2248
2009), a rise in real wages and number of
annual employment days available (Alha and
Yonzon, 2011) and few other studies revealed
that MGNREGS beneficiaries got low
incomes than non beneficiaries (Ahuja et al,
2011) and there was a significant difference in
income levels in areas where scheme was
implemented partially compared to full pledge
implemented areas (Reddy et al, 2016). In few
studies, actual incomes and total number of
annual employment days were also calculated.
The present study was aimed at the estimation
of total annual incomes of beneficiary and non
beneficiary famers and beneficiary and non
beneficiary labourers of MGNREGS, total
number of employment days available to these
groups, their income transition patterns, and
significant factors differentiating these two
groups (beneficiaries and non beneficiaries) of
farmers and labourers in selected mandals of
Karimnagar and Medak districts of Telangana
state during 2013-14 year.
From each selected mandal, two villages were
selected randomly and from each selected
village, eight beneficiaries and eight non
beneficiaries were selected of which 50%
(four) were small famers and 50% (four) were
labourers. Thus it made 64 small farmers and
64 labourers from each district and finally it
made a sample size of 256 respondents.
Data regarding net incomes and savings
thereafter were collected from sample farmers
and labourers as per the objectives of the study
by interview method. The data were obtained
by a pretested questionnaire specially
designed for the purpose. The data collected
thus were analyzed using different tabular and
statistical techniques, interpreted and drawn
conclusions (Table 1).
Results and Discussion
Impact of MGNREGS on income patterns
of the beneficiaries and non beneficiaries of
the scheme
Objectives
Two estimate the employment pattern of
sample MGNREGS beneficiary and non
beneficiary farmers and labourers in the study
area. Two estimate the income earning pattern
of sample MGNREGS beneficiary and non
beneficiary farmers and labourers in the study
area.
Materials and Methods
The present study was conducted in
Karimnagar and Medak districts of Telangana
state (formerly part of Andhra Pradesh) during
2013-14. In each district, two mandals were
selected purposively where comparatively
highest amount of money was spent for
MGNREGS by the government and two
mandals where lowest amount of money was
spent.
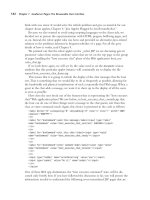
Income obtained by farmers as MGNREGS
beneficiaries and as non beneficiaries is
estimated in the study area (Fig. 1–6).
Income of the sample farmers from
agriculture
In both HEMs and LEMs, the average per
farm and per hectare incomes of the non
beneficiaries was found to be more than
beneficiaries in both Karimnagar and Medak
districts (Table 2).
The per farm income of the non beneficiaries
in HEMs of Karimnagar was more than the
beneficiaries (34.28 percent), while in LEMs,
the difference between beneficiaries and non
beneficiaries’ was 12.07 percent.
In HEMs of Medak district non beneficiaries
per farm income was 1.70 percent more than
2237
Int.J.Curr.Microbiol.App.Sci (2018) 7(7): 2236-2248
beneficiaries, while in LEMs the difference
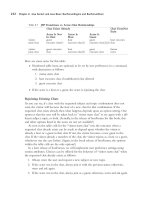
was 64.95 percent. In Karimnagar district, the
average per hectare income of the non
beneficiaries in HEMs was 38.11 percent
more than beneficiaries and in LEMs, it was
36.19 percent. The same trend was noticed in
Medak district also.
The difference in incomes between
beneficiaries and non beneficiaries were high
in both HEMs and LEMs in Karimnagar
district and it was low when compared to
Medak district. In Medak district, the
differences between HEMs and LEMs were
very large in income realization. This may be
due to the cropping pattern prevailed in HEMs
of Medak such as sugarcane, onion, zinger and
redgram crops in addition to rice.
Both per farm and per hectare annual incomes
of beneficiary farmers were less than the non
beneficiaries. This may be due to non
beneficiaries may have other good alternative
income sources or beneficiaries satisfied with
the less number of days of work available in a
year. However, it was confirmed that non
beneficiaries’ average annual income was
more than MGNRGES beneficiaries.
The results were appear to be quiet logical as
the beneficiary MGNREGS farmers made less
agricultural income and less than the non
beneficiaries and however it was found that
the beneficiary groups under HEMs and LEMs
in both Karimnagar and Medak districts
competed with non beneficiaries groups in
income realization. This phenomenon may be
attributed to more reasonable conclusion that
the MGNREGS impact on beneficiaries was
significant as the results show that beneficiary
groups’ incomes incurred to an extent on par
with non beneficiaries (Jha 2011).
Income pattern from livestock
Data related to livestock income on per family
and per animal basis (Table 2) indicated that
the per family income of sample farmers in
both the districts, beneficiaries in HEMs
obtained higher income from livestock than
non beneficiaries with 12.45 percent and
44.90, but in LEMs non beneficiaries income
from livestock was more than beneficiaries
with 30.16 percent and 45.41 percent in both
Karimnagar and Medak respectively.
This may be because of the reason that in
HEMs, more days of work available under
MGNREGS and so got more leisure time to
take care of their own livestock rearing
activities effectively or may due to availability
of increased amount of fodder and other
required greenery with the implementation of
MGNREGS which helped in soil conservation
and increased water table with higher
expenditure on the scheme.
The agricultural beneficiary labourers per
family income from livestock source in
Karimnagar district in both HEMs and LEMs,
the income from livestock for beneficiaries
was less than the non beneficiaries with 10.89
percent and 22.10 percent respectively. But in
Medak district, it was different as the
beneficiaries income from livestock was more
than non beneficiaries in both HEMs (39.63
per cent) and LEMs (51.77 per cent)
respectively.
The per animal income of beneficiary sample
farmers, in all the study area was lower than
non beneficiaries with 26.36, 90.24, 42.94 and
127.20 per cent for HEMs of Karimnagar,
LEMs of Karimnagar, HEMs of Medak and
LEMs of Medak respectively. The per animal
income of agricultural labourers in both HEMs
and LEMs of Karimnagar district was more
than the beneficiaries with 10.89 per cent and
30.82 per cent respectively, but in Medak
district, in both HEMs and LEMs,
beneficiaries per animal income was more
than non beneficiaries with 169.81 per cent
and 140.31 per cent respectively (Table 3).
2238
Int.J.Curr.Microbiol.App.Sci (2018) 7(7): 2236-2248
Hence, it is clear that in HEMs of both the
districts, beneficiary farmers’ livestock
income was higher than non beneficiary
farmers while in LEMs, non beneficiary
farmers’ livestock income was higher than
beneficiaries and there was no much
difference observed between beneficiaries and
non beneficiaries. Interestingly per animal
incomes of the non beneficiary sample farmers
was highest in the study area than the
beneficiaries. In the case of Karimnagar
district, the beneficiary agricultural labourers
in both highest and lowest expenditure
mandals on per family basis realized less
income when compared to non beneficiaries.
In the case of Medak district, the beneficiary
agricultural labours realized higher incomes
when compared to non beneficiaries. These
two contradicting results were logical as
beneficiary agricultural labours in Karimnagar
district, though earned low livestock income;
their incomes were on par with non
beneficiaries while in Medak district the
beneficiaries in both highest and lowest
expenditure mandals have earned high levels
of income on livestock compared to non
beneficiaries.
Livestock income depends on the availability
of fodder, management and willingness to
rear. So it can be said that the Medak
agricultural labour are more interested in
livestock rearing which fetched them more
income. The per animal data has indicated a
different trend in sample farmers and
agricultural labourers. The striking feature on
per animal basis in Medak district in both
highest and LEMs was that the beneficiaries’
incomes were higher than the non
beneficiaries.
Contribution of farm wages and nonfarm
wages
Small farmers beneficiary have realized more
farm wage incomes of ₹ 3672 when
compared to MGNREGS farm wage income
(₹ 3339) in the total annual average wage
income in HEMs while in LEMs the same
trend was noticed in the MGNREGS farm
wage income was more (₹ 3482) compared to
nonfarm wage small farmer group (₹2767).
Agricultural labourers farm wage incomes
were more (₹ 2244) when compared to
nonfarm wage incomes (₹ 2034) in HEMs of
Karimnagar. Similar trend was observed in
LEMs of Karimnagar district. In all the study
areas of Medak district, the same trend was
noticed in case of both farmers and
agricultural labourers.
In agricultural labourers group, the income
from farm wages accounted to 73.23 per cent
and 75.05 per cent of total income in
Karimnagar and Medak.
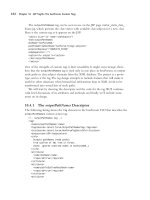
Share of MGNREGS income in total
income
The small farmers in HEM of Karimnagar
district have realized 25 percent of the
incomes from MGNREGS source while in
LEMs the incomes were on par with HEMs
with 25 percent again in Karimnagar district.
Table 4 depicts the share of income from
MGNREGS to the total income for the sample
beneficiaries in both the districts.
In Medak district, the HEMs indicated only 11
percent with respect to small farmers groups
while in LEMs incomes were 24 percent of the
incomes of small farmers.
The agricultural laborers’ data in HEMs of
Karimnagar district indicated that the
contribution of MGNREGS source was 72
percent to total incomes while it was 50
percent in LEMs. In Medak district
interestingly the LEMs pertaining to
agricultural labourer indicated that NREGS
contribution was 61 percent while that of
2239
Int.J.Curr.Microbiol.App.Sci (2018) 7(7): 2236-2248
HEMs (49 percent). Thus, it can be concluded
that both small farmers and agricultural
labourers have realized good percentage of
incomes which ranged between 11-25 percent
in small farmers groups while it was in the
range of 49-72 percent in agricultural
labourers to total incomes.
Total
annual
income
MGNREGS
beneficiary
beneficiaries
patterns
of
versus
non
expenditure mandals of Medak where
commercial crops are grown at large scale
compared to all other areas where food crops
are predominantly cultivated.
Income mobility pattern
The mobility or shift of the MGNREGS
beneficiaries with respect to income levels is
presented in the form of income transition
matrices or stochastic matrices
a. Small farmers
i) Income mobility of sample farmers
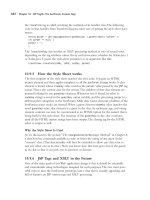
Except in HEMs of Medak district, in all other
cases non beneficiaries’ average annual
income is more than the beneficiaries. In
HEMs of Karimnagar, beneficiaries’ total
annual income is 27.95 per cent more than non
beneficiaries and LEMs, beneficiaries annual
income is 29.16 per cent more than non
beneficiaries.
In
HEMs
of
Medak,
beneficiaries total annual income is 60.15 per
cent more than non beneficiaries where as in
LEMs of Medak, non beneficiaries got more
income than beneficiaries by 4.76 per cent.
In Karimnagar, it was observed that majority
(31.25 per cent) of farmers were moved from
Rs. 40001 – 60000 income group to Rs.
60001-80000 income group in HEMs and in
LEMs a majority (25 per cent) were shifted
from Rs. 20001 – 40000 income group to Rs.
40001 – 60000 income group and another 25
per cent of farmers moved from Rs. < 20000
income group to Rs. 20001 – 40000 income
group.
b. Agricultural labourers
In case of agricultural labours, in all the areas
of two districts, except in highest expenditure
mandals of Karimnagar district the average
annual income of beneficiary labourers is
more than non beneficiaries (Akhtar and
Azeez 2012). In HEMs of Karimnagar, non
beneficiaries got 4.82 per cent more income
than beneficiaries and LEMs, beneficiary
labourers got 7.07 per cent more income than
non beneficiaries. In Medak, beneficiary
labourers on HEMs got 40.35 per cent more
income than non beneficiaries whereas in
LEMs, beneficiaries got 13.90 per cent more
income than non beneficiaries .
It was clear from the above discussion that in
all the areas, farmers income is higher than
labourers and this gap is very high in highest
In Medak, a majority (31.25 per cent) of
farmers in HEMs remained in the same
income group of Rs. < 50000 income group
inspite of additional income from MGNREGS.
In LEMs, majority (37.5 per cent) were moved
from a lower income group of Rs. < 20000 to
Rs. 20001 – 40000 income group.
ii) Income
labourers
mobility
of
agricultural
In Karimnagar, majority of agricultural
labourers (62.5 per cent) in HEMs moved
from Rs. < 10000 income group to Rs. 10001
– 20000 income group and LEMs, a majority
(37.5 per cent) moved from Rs. 10001- 20000
income group to Rs. 20001-30000 income
group.
In Medak, a majority (25 per cent) of
agricultural labourers in HEMs moved from
Rs. < 10000 income group to Rs. 10001-
2240
Int.J.Curr.Microbiol.App.Sci (2018) 7(7): 2236-2248
20000 income group and another 25 per cent
of labourers moved from two steps i.e to Rs.
20001 – 30000 income group and LEMs, a
majority (56.25 per cent) moved from Rs. <
10000 income group to Rs. 10001-20000
income group.
Regarding crossing poverty line, all the
sample farmers were found to be above
poverty line even without MGNREGS income
and in case of agricultural labourers about
81.25 per cent, 25 percent, 31.25 per cent and
75 per cent of beneficiary labourers crossed
poverty line in HEMs of Karimnagar, in
LEMs of Karimnagar, in HEMs of Medak and
in LEMs of Medak respectively (Thadathil
and Mohandas (2011)).
Impact of MGNREGS on employment of
sample beneficiaries and non beneficiaries
The MGNREGS programme main aim is to
provide man days of work on different areas
like farm, non farm and construction work for
both small farmers and agricultural labourers.
Accordingly the data was collected, analyzed
and presented in Table 5.
In HEMs of Karimnagar district, small
farmers were benefitted with 104.87 man days
in farm work followed by nonfarm (40.25 man
days) and construction work (30.18 man days)
while in LEMs, the farm work man days were
100 days and highest among all other work
man days. However, the farm work man days
were relatively high by 15 days in HEMs of
Karimnagar district while there was not much
difference in LEMs. The agricultural labourers
farm work man days in HEMs of Karimnagar
district were with 61.37 man days followed by
non farm work days 54 and construction work
48 days.
The same trend was noticed in LEMs. The
interesting feature was that with respect to
farm work days for both small farmers and
agricultural labourers in HEMs and LEMs of
Karimnagar district were highest in relative
terms compared to the MGNREGS works.
Thus, it can be concluded that the government
intervention of MGNREGS implementation
has fulfilled as it catered the specific needs of
rural population in providing farm work that
helped agricultural development which
reflected in terms of more man days to farm
work on relative terms of other MGNREGS
works (Alha and Yonzon 2011).
Significant difference between beneficiaries
and non beneficiaries in case of Total
annual employment days
Using the paired 2 sample t – test, it was
found that for both farmers and labourers in all
the areas of two districts, there was no
significant
difference
between
the
beneficiaries and non beneficiaries in case of
total number of employment days. Hence, we
accept the null hypothesis (there is no much
difference between the beneficiary and non
beneficiaries’ total number of employment
days).
However, though there was no significant
between beneficiaries and non beneficiaries, a
clear absolute difference was found.
Factors affecting the total annual incomes
i) Farmers
To study the influence of various factors
effecting on total annual incomes of
beneficiary and non beneficiary farmers of
highest and lowest expenditure mandals of
Karimnagar and Medak districts, multiple
regression analysis was carried out after
confirming that there was no multicolinearity
among the identified variables.
2241
Int.J.Curr.Microbiol.App.Sci (2018) 7(7): 2236-2248
Table.1 Sample villages selection procedure
Maddur
Mirzapur
Gottimukkala
Kollapalle
Itkepally
Raikode
Abbenda
Nrayankhed
Manala
Mallial
Sulthanpoor
Chinthakani
Eligaid
Kataram
Village
Mutharam
Mandal
KARIMNAGAR
MEDAK
Highest Expenditure Lowest Expenditure Highest
Expenditure Lowest
Expenditure
Mandals (HEMs)
Mandals (LEMs)
Mandals (HEMs)
Mandals (LEMs)
Mutharam Kataram Eligaid
Mallial Narayankhed Raikode
Shankaram
Shankaram
pet (A)
pet(R)
Kankunoor
Dist
Criteria
Table.2 Average annual income of the sample farmers from agricultural crops (Rs/year)
S.No
Karimnagar
HEMs
LEMs
B
NB
B
NB
Particulars
Per farm
31366.99
42120.05
Medak
B
HEMs
NB
LEMs
B
NB
26151.46
29308.96
96779.22
98431.78
32130.66
53000.18
Per hectare
17393.43 24023.06 13057.35
(B = Beneficiary, NB = Non Beneficiary)
17783.36
58417.41
61382.95
21314.48
36715.38
Table.3 Average annual income from livestock for sample respondents in the study area (in
Rs/year)
S.No
Group
Karimnagar
HEMs
1
2
Per
family
B
3893.75
Sample
farmers
1606.25
Agri nlabourers
2307.40
Per
Sample
animal
farmers
2570.00
Agri labourers
(B = Beneficiaries, NB = Non Beneficiaries)
Medak
NB
3462.50
LEMs
B
NB
3025.00 3937.50
HEMs
B
4981.25
NB
3437.50
LEMs
B
NB
3093.75 4498.75
1781.25
2915.78
1781.25
2547.36
2175.00
4846.15
5531.25
2748.27
1025.00
3928.57
3206.25
1980.00
2112.50
4498.75
2850.00
1900.00
2485.71
4916.66
1822.22
4275.00
1778.94
Table.4 Average annual income of beneficiaries from MGNREGS in Karimnagar and Medak
districts (Rs / year)
Particulars
Small
Farmers
Karimnagar
HEMs
LEMs
Income
Total
Income
Total
from
income
from
income
NREGS
NREGS
14443.62
56715.30
11793.37 47219.27
(25.46)
(24.97)
Agricultural
15009.81
20893.87
12058.87 23984.81
Labours
(71.83)
(50.27)
Note: Figures in parenthesis indicates percentage to the total.
2242
Medak
HEMs
LEMs
Income
Total
Income
Total
from
income
from
income
NREGS
NREGS
13549.87 121400.59
12483.0 51751.56
(11.16)
(24.12)
14826.12
(49.43)
29991.18
13125.5
(61.94)
21189.87
Int.J.Curr.Microbiol.App.Sci (2018) 7(7): 2236-2248
Table.5 Work done pattern by small farmers and agricultural labourers in the study period
(number of days in year)
Karimnagar
S.No
Group
HEMs
LEMs
B
NB
B
NB
1
104.87
90.75
99.68
100.62
Small
Farm work
(59.82) (52.81) (56.58) (52.05)
farmers
40.25
48
39.93
57.37
Non farm work
(22.95) (27.93) (22.66)
(29.6)
30.18
33.06
36.56
35.31
Construction
(17.21) (19.24) (20.75) (18.26)
work
175.31
171.81
176.18
193.31
Total
(100)
(100)
(100)
(100)
2
61.37
69.5
76.56
53.06
Agri
Farm work
(37.50) (40.49) (43.42) (32.05)
labours
54.25
52.31
60.81
55.37
Non farm work
(33.15) (30.48) (34.49) (33.92)
48
49.81
38.93
54.81
Construction
(29.33) (29.02) (22.08) (33.57)
work
163.62
171.62
176.31
163.25
Total
(100)
(100)
(100)
(100)
Note: Figures in parenthesis indicates percentage to the total.
Medak
HEMs
B
NB
113.56
111.5
(72.50) (62.11)
29.37
54.62
(18.75) (33.43)
13.68
13.37
(8.73)
(7.45)
156.62
179.5
(100)
(100)
101.93
59.12
(51.03) (35.51)
65.68
91.87
(32.88) (55.18)
32.12
15.5
(16.08)
(9.30)
199.75
166.5
(100)
(100)
LEMs
B
NB
75.68
83.5
(52.17) (52.06)
38.62
47
(26.62) (29.30)
30.75
29.87
(21.19) (18.62)
145.06
160.37
(100)
(100)
80.43
56.37
(52.53) (42.83)
53.68
39.43
(35.06) (29.96)
19
35.81
(12.40) (27.20)
153.12
131.62
(100)
(100)
Table.6 Regression analysis for sample farmers
S.No
1
2
3
4
5
6
7
8
Area
Beneficiaries in HEMs
Karimnagar
Non
beneficiaries
HEMs Karimnagar
Beneficiaries in LEMs
Karimnagar
Non
beneficiaries
LEMs of Karimnagar
Beneficiaries in HEMs
Medak
Non
beneficiaries
HEMs of Medak
Beneficiaries in LEMs
Medak
Non
beneficiaries
LEMs of Medak
Regression equation
in
of
in
of
in
of
in
Y = - 23013.4 + 21.80X1 – 1777.8X2 – 936.18X3 – 1156.99X4
+ 0.95X5 + 39.06X6 + 392.73X7 + 1.08X8**.
Y = -5780.31 – 12.84X1 – 3148.95X2 + 1073.33X3 –
3950.98X4 + 0.82X5 + 155.86X6 + 122.48X7 + 0.93X8**
Y = 81369.1 – 398.36X1 – 16603.2X2*+ 481.89X3 6962.58X4 + 0.27X5 + 49.68X6 - 127.32X7 + 1.03X8**
Y = - 42509.3 + 324.25X1 + 116.77X2 - 2482.52X3 +
1800.2X4 + 0.93X5* + 126.7X6* + 171.07X7 + 1.11X8**.
Y = 11334.95 + 133.21X1 – 2647.42X2 + 259.79X3 - 32.95X4
+ 1.11X5* – 2.46X6 + 26.96X7 + 1.00X8**.
Y = –1789.32 - 37.14X1 + 622.85X2 - 722.94X3 + 1029.1X4
+ 1.30X5* + 27.72X6 + 75.42X7 + 0.98X8**.
Y = - 19030.9 + 286.93X1 + 3334.35X2 + 2126.61X3 2474.89X4 + 1.69X5* + 75.26X6 + 63.03X7 + 1.01X8**.
Y = - 51949.9 – 461.79X1 - 9688.03X2 + 2796.02X3 +
1417.97X4 – 3.52X5** + 74.26X6 – 491.15X7 – 0.10X8.
2243
R2
Value
Average total
annual
income(In ₹.)
56715.30
Standard
Error
0.969
4510.55
62409.73
0.986
4723.96
47219.27
0.954
4895.61
48082.64
0.977
4763.28
121400.59
0.999
4102.13
112850.35
0.998
4096.53
51751.56
0.990
4303.46
18602.68
0.917
8274.32
Int.J.Curr.Microbiol.App.Sci (2018) 7(7): 2236-2248
Table.7 Regression analysis for sample agricultural labourers
S.No
Area
Regression equation
1
Beneficiaries in
HEMs
Karimnagar
Non
beneficiaries in
HEMs
Karimnagar
Beneficiaries in
LEMs
of
Karimnagar
Non
beneficiaries in
LEMs
of
Karimnagar
Beneficiaries in
HEMs
of
Medak
Non
beneficiaries in
HEMs
of
Medak
Beneficiaries in
LEMs
of
Medak
Non
beneficiaries in
LEMs
of
Medak
Y = - 19634.3 – 56.62X1 + 120.09X2 + 991.29X3 +
0.93X4** + 103.55X5* + 177.78X6**
2
3
4
5
6
7
8
R2
Value
Average total
annual
income(In ₹.)
20893.87
0.929
1836.19
Y = -22609.8 – 18.64X1 + 134.04X2 + 2.32X3 +
0.93X4** + 117.64X5** + 192.70X6**
21902.43
0.996
485.39
Y = - 14186.1 – 95.07X1 – 698.31X2 – 974.17X3 +
0.96X4** + 116.28X5** + 187.01X6**
23984.81
0.956
1429.04
Y = -19378.5 – 13.80X1 – 126.96X2 + 236.1X3 +
1.01X4** + 121.42X5** + 158.54X6**
22400.12
0.996
449.50
Y = -22753.8 – 27.54X1 + 315.30X2 – 49.59X3 +
0.99X4** + 124.32X5** + 185.99X6**
29991.18
0.995
1127.53.
Y = 48130.23 + 45.82X1 + 2783.88X2 + 735X3 +
1.07X4 – 50.32X5 – 201.57X6*.
22367.5
0.573
3300.48
Y = 3319.45 – 13.24X1 - 722.56X2 – 539.04X3 +
1.04X4** + 106.31X5** + 12.68X6.
21189.87
0.982
1257.91
Y = -15906.8 - 8.93X1 – 227.86X2 + 39.83X3 +
0.97X4** + 125.61X5** + 133.37X6
18602.68
0.997
326.55
Figure.1 Incomes of the sample farmers on
per family basis
Standard
Error
Figure.2 Incomes of sample farmers on per
hectare basis
Where, KHM = Karimnagar Highest Expenditure Mandals
KLM = Karimnagar Lowest Expenditure Mandals
MHM = Medak Highest Expenditure Mandals
MLM = Medak Lowest Expenditure Mandals
2244
Int.J.Curr.Microbiol.App.Sci (2018) 7(7): 2236-2248
Figure.3 MGNREGS beneficiary farmer’s
incomes
Figure.4 MGNREGS beneficiary labourers
incomes
Figure.5 Average total annual income of small farmers
Figure.6 Average total annual incomes of agricultural labourers
Beneficiaries
30000
20000
10000
0
2245
Non beneficiaries
Int.J.Curr.Microbiol.App.Sci (2018) 7(7): 2236-2248
The dependent and independent variables
considered in case of farmers were
Y = Total annual income,
X1 = Age,
X2 = Education,
X3 = Land holding,
X4 = Family size,
X5 = Income from live stock,
X6 = Total number of employment days,
X7 = Average wage rate,
X8 = Income from agriculture,
* Significant at 5 % level
** Significant at 1 % level
To know the factors affecting the total annual
incomes, the following equations were fitted
(Table 6) and found that income from
agriculture is the variable found significant at
1% and 5% in all the cases and the standard
error varied between 4096.53 and 8274.32
ii) Agricultural labourers
To study the influence of various factors
effecting on total annual incomes of
beneficiary and non beneficiary labourers of
highest and lowest expenditure mandals of
Karimnagar and Medak districts, multiple
regression analysis was carried out after
confirming that there was no multicolinearity
among the identified variables.
The dependent and independent variables
considered in case of labourers were
Y = Total annual income,
X1 = Age,
X2 = Education,
X3 = Family size,
X4 = Income from livestock,
X5 = Total number of employment days,
X6 = Average wage rate.
* Significant at 5 % level
** Significant at 1 % level
To know the factors affecting the total annual
incomes, the following equations were fitted
(Table 7) and found that income from
livestock, total number of employment days,
average wage rate was the variables found
significant at 1% and 5% in majority of the
cases and the standard error varied between
326.55 and 3300.48.
Summery and conclusion of the studies are as
followed
Impact of MGNREGS on income pattern
Per farm income of beneficiary group farmers
in highest expenditure mandals of Karimnagar
was ₹ 42120 while in Medak the non
beneficiary group farmers in highest
expenditure mandals was - 98431. The
agricultural labourers livestock income
among non beneficiary group was - 2175 in
Karimnagar while in Medak, among
beneficiary group, the highest expenditure
mandals realized -5531. Though there was no
statistically significant difference between
beneficiaries and non beneficiaries in income,
but in all the cases an absolute difference was
observed.
Impact of MGNREGS on employment
pattern
Beneficiary farmers in HEMs of Karimnagar
got 175.31 days of total work while non
beneficiary farmers got 171.81 days.
Beneficiary farmers in LEMs of Karimnagar
got a total of 176.18 days and non
beneficiaries got 193.31 days. In Medak,
beneficiary farmers in HEMs got 156.62 days
of total work and 179.5 days in case of non
beneficiaries. In LEMs, beneficiary farmers
got 146.06 days and non beneficiaries got
160.37 days. Here also, though there was no
statistically significant difference between
beneficiaries and non beneficiaries in
employment days, but in all the cases an
absolute difference was observed.
2246
Int.J.Curr.Microbiol.App.Sci (2018) 7(7): 2236-2248
Income mobility among beneficiaries
Income transition was clearly seen in case of
farmers and agricultural labourers due to
MGNREGS income and majority of farmer’s
income ranges were higher than agricultural
labourers. Majority of labourers crossed
poverty line in HEMs of Karimnagar with the
help of income from MGNREGS.
Linear regression analysis
Major discriminator between beneficiary and
non beneficiary farmers were total annual
income (172.43%), expenditure on hired
human labour (80.59%), income from
livestock (7.29%) and age of labourer (4.8%).
Major discriminating factors between
beneficiary and non beneficiary agricultural
labourers were total annual income (50.70%),
social class (45.15%), total employment days
(37.24%), family size (32.63%) and average
wage rate (11.84%). In case of linear
regression analysis, the identified independent
variables explained about 97.37 per cent and
92.8 per cent variation in total annual incomes
of farmers and labourers respectively. Income
from agriculture and income from livestock
found to be significant in case of farmers and
in case of labourers, the total employment
days and average wage rate were found
significant.
References
Ahuja, U. R., Tyagi, D., Chauhan, S. and
Chaudhary, K.R. 2011. Impact of
MGNREGA on rural employment and
migration: a study in agriculturally
backward and agriculturally advanced
districts of Haryana. Agricultural
Economics Research Review. 24
(Conference number):495-502.
Akthar, S.M.J and Azeez, N.P.A. 2012.
Budgetary allocation and its utilization
MGNREGSa
view
point.
Kurukshetra. 60(6):19-22.
Akthar, Y. 2009. NREGA – case study.
Kurukshetra. 58(1):20.
Alha, A and Yonzon, B. 2011. Recent
development
in
farm
labour
availability in India and reasons
behind its short supply. Agricultural
Economics
Research
Review.
24(Conference number):381-390.
Basavaraj, G. 2011. Impact and implications
of MGNREGA on labour supply and
income generation for agriculture in
central dry zone of Karnataka.
Agricultural Economics Research
Review. 24 (Conference number):485494.
Divakar Reddy, P., Vijay Kumar, N., Dinesh,
T.M. and Shruthi, K. 2016. Impact of
MGNREGA on income, expenditure,
savings pattern of beneficiaries in
North-Eastern Karnataka. Economic
Affairs 61(1):101-106.
Jha, R.R. 2011. Impact of MGNREGA on
wage employment and income
generation: a case study of Darbhanga
district
in
Bihar.
Agricultural
Economics
Research
Review.
24(Conference number):557.
Kumar, T and Vora, Y. 2012. Reforms under
MGNREGS in Rajasthan. Yojana.
56(11):31-34.
Pattanaik, B.K and Lal, H. 2011. Mahatma
Gandhi NREGA and social audit
system
of
village
panchayats.
Kurukshetra. 59(3):23-25.
Sarkar, P., Kumar, J and Supriya. 2011.
Impact of MGNREGA on reducing
rural
poverty
and
improving
socioeconomic status of rural poor: a
study in Burdwan district of West
Bengal.
Agricultural
Economics
Research Review. 24(Conference
number):437-448.
Srivastava, N and Srivasatava, R. 2010.
Women, Work and Employment
2247
Int.J.Curr.Microbiol.App.Sci (2018) 7(7): 2236-2248
outcomes in Rural India. Economic
and Political Weekly. 45(28):49-60.
Thadathil, M.S. and Mohandas, V. 2011.
Impact of MGNREGS on labour
supply in the agricultural sector of
Wayanad district, Kerala. Agricultural
Economics Research Review. 24
(Conference number):560.
www.nrega.nic.in
How to cite this article:
Kumara Swamy, D., C.V. Hanumanthaiah, P. Parthasarathy Rao, K. Suhasini and
Narendranath, V.V. 2018. Impact of ‘Mgnregs’ on Income and Employment of Small Farmers
and Labourers: A Comparative Study in Telangana State. Int.J.Curr.Microbiol.App.Sci. 7(07):
2236-2248. doi: />
2248