Transcriptome and comparative gene expression analysis of Phyllostachys edulis in response to high light
Bạn đang xem bản rút gọn của tài liệu. Xem và tải ngay bản đầy đủ của tài liệu tại đây (2.73 MB, 17 trang )
Zhao et al. BMC Plant Biology (2016) 16:34
DOI 10.1186/s12870-016-0720-9
RESEARCH ARTICLE
Open Access
Transcriptome and comparative gene
expression analysis of Phyllostachys edulis in
response to high light
Hansheng Zhao1,2†, Yongfeng Lou1,2†, Huayu Sun1,2, Lichao Li1,2, Lili Wang1,2, Lili Dong1,2 and Zhimin Gao1,2*
Abstract
Background: Photosynthesis plays a vital role as an energy source for plant metabolism, and its efficiency may be
drastically reduced owing to abiotic stresses. Moso bamboo (Phyllostachys edulis), is a renewable and versatile
resource with significant ecological and economic value, which encounters high light stress with large amplitude in
natural environment. However, the gene expression profiles in response to high light were elusive in bamboo.
Results: We firstly performed physiological experiments on moso bamboo leaves treated with high light
(1200 μmol · m−2 · s−1). Based on the physiological results, three samples of leaves treated with high light for 0 h
(CK), 0.5 h (0.5H), and 8 h (8H) were selected to perform further high-throughput RNA sequencing (RNA-Seq),
respectively. Then, the transcriptomic result demonstrated that the most genes were expressed at a statistically
significant value (FPKM ≥ 1) and the RNA-Seq data were validated via quantitative real time PCR. Moreover, some
significant gene expression changes were detected. For instance, 154 differentially expressed genes were detected
in 0.5H vs. CK, those in 8H vs. CK were 710, and 429 differentially expressed genes were also identified in 0.5H
vs.8 H. Besides, 47 gene annotations closely related to photosynthesis were refined, including 35 genes annotated
as light-harvesting chlorophyll a/b-binding (LHC) proteins, 9 LHC-like proteins and 3 PsbSs. Furthermore, the
pathway of reactive oxygen species (ROS) in photosynthesis was further analyzed. A total of 171 genes associated
with ROS-scavenging were identified. Some up-regulated transcript factors, such as NAC, WRKY, AR2/ERF, and bHLH,
mainly concentrated in short-term response, while C2H2, HSF, bZIP, and MYB were largely involved in short and
middle terms response to high light.
Conclusion: Based on the gene expression analysis of moso bamboo in response to high light, we thus identified
the global gene expression patterns, refined the annotations of LHC protein, LHC-like protein and PsbS, detected
the pathway of ROS as well as identified ROS-scavenging genes and transcription factors in the regulation of
photosynthetic and related metabolisms. These findings maybe provide a starting point to interpret the molecular
mechanism of photosynthesis in moso bamboo under high light stress.
Keywords: Moso bamboo, RNA-Seq, Photosynthesis, Gene expression, Transcript factors
Background
The woody bamboo classified in the grass family Poaceae, Bambusoideae, tribe Bambusease, was considered
as one of the most important non-timber forest resources in the world. In the recent years, the woody
* Correspondence:
†
Equal contributors
1
State Forestry Administration Key Open Laboratory on the Science and
Technology of Bamboo and Rattan, Beijing 100102, China
2
Institute of Gene Science for Bamboo and Rattan Resources, International
Center for Bamboo and Rattan, Beijing 100102, China
bamboo had received much attention in the ecological
and economic aspects, since it has diverse advantages,
such as fast-growth, high strength-to-weight ratio,
strongly lignified culms, and strongly carbon fixation
capability. The woody bamboo is one of the best agents
for carbon sequestration in the subtropical areas of
China, which is 2 to 4 times more effective than Chinese
fir and pines [1]. Photosynthesis plays essential roles in
supplying carbon-hydrates for the exhibition of bamboo
characteristics. However, the study on spectroscopic features, capacity of forming homotrimers and structural
© 2016 Zhao et al. Open Access This article is distributed under the terms of the Creative Commons Attribution 4.0
International License ( which permits unrestricted use, distribution, and
reproduction in any medium, provided you give appropriate credit to the original author(s) and the source, provide a link to
the Creative Commons license, and indicate if changes were made. The Creative Commons Public Domain Dedication waiver
( applies to the data made available in this article, unless otherwise stated.
Zhao et al. BMC Plant Biology (2016) 16:34
stabilities of different bamboo isoforms (Lhcb1-3) showed
that they possess similar characteristics as those in other
higher plants in spite of small differences [2], which means
that bamboo may have a special mechanism in the processes of light utilization and regulation for its fast growth
though it is unknown.
The comprehensive gene expression profiles of bamboo involved in photosynthesis are significant to understand the molecular basis and dynamic gene expression
in response to high light. As one of essential nextgeneration sequencing technology, the high-throughput
RNA sequencing (RNA-Seq) is capable to reveal a snapshot of RNA presence and quantity from a genome at a
given moment in time [3, 4]. Relying on the accomplishment of the draft genome sequence of moso bamboo
[5], RNA-Seq data will help reasonably interpret the
functional elements of the genome and reveal the molecular composition under light stress. Previous studies
of expression profiles mainly focused on different tissues
[6–9]. To date, the genome-wide expression profile of
photosynthesis-related genes in response to high light
still remains elusive.
To provide a genome-wide insight into the molecular
and regulated mechanism in response to high light, the
Chinese endemic bamboo species, moso bamboo (Phyllostachys edulis) was focused in further analysis. Based
on the analysis of photosynthetic physiology, three samples including leaves treated with high light (1200 μmol ·
m−2 · s−1) for 0 h (CK), 0.5 h (0.5H) and 8 h (8H) were
used for RNA isolation, respectively. We identified a
large number of expressed genes in deeply sequencing
pool based on RNA-Seq data from the three samples
using the Illumina HiSeq 2000 sequencing platform. The
further analysis of gene clustering, gene expression patterns, differentially expressed genes and transcript factors
Page 2 of 17
was conducted, the results facilitated our understanding
of the photosynthesis, reactive oxygen species (ROS), and
non-photochemical quenching (NPQ) in response to high
light. This maybe provide a resource of expression profiles
for further experimental design as well as serve as a foundation for further studies on function of genes and regulated network under light stress, particularly the transcript
factors involved in response to high light.
Results and discussion
Photosynthetic physiology analysis of bamboo
The chlorophyll fluorescence kinetics technique is referred
to as a quick and nonintrusive probe in the studies of plant
photosynthetic function. Among the fluorescence parameters, NPQ kinetics is frequently used as a tool to
characterize the non-photochemical quenching processes,
and the maximal photochemical efficiency (Fv/Fm) is an
index to estimate the degree of photoinhibition [10].
Therefore, NPQ kinetics and Fv/Fm were investigated in
moso bamboo leaves under high light (1200 μmol · m−2 · s
−1
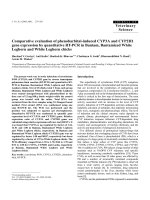
) for up to 12 h, respectively. Thus, the results in Fig. 1
depicted the distribution of Fv/Fm and NPQ in moso bamboo leaves based on treatments of the same light intensity
at different time. The maximal Fv/Fm appeared in 0 h, then
it decreased almost linearly with the increased time under
high light. The value of Fv/Fm at 12 h was decreased by ~
44.11 % compared to the control (0 h). These indicated
that photoinhibition under high light was targeted in moso
bamboo leaves, and the degree had constantly enhanced
with the increased time of high light. Similarly, NPQ was
activated by high light and increased rapidly during the
first 0.5 h, and then decreased slowly, finally tended to be
stable after 8 h. Taken together, we selected three representative samples, including 0 h (CK), 0.5 h (0.5H) and 8 h
(8H), to further perform a series of transcriptomic analysis.
Fig. 1 Distribution of NPQ kinetics and Fv/Fm. X-axes represented light time. Error bars indicate standard deviation in NPQ kinetics and Fv/Fm
Zhao et al. BMC Plant Biology (2016) 16:34
Overview of the bamboo transcriptome and validation of
RNA-Seq data by qRT-PCR
In view of natural daily stress of high light less than
8 hours, three RNA libraries of moso bamboo leaves
were selected on the basis of photosynthetic physiological experiments. These libraries were constructed
and then pair-end sequenced based on Illumina
Highseq-2000 in order to help comprehensively understand a global atlas of the transcriptome in response to
high light. After preprocessing and quality control for
raw data of RNA-Seq, the clean reads were aligned to
the reference genome sequence from Bamboo Genome
Database [11] (www.bamboogdb.org, version 1) to estimate the profile of expressed genes in each library. The
software of TopHat was employed and core parameters
were set based on transcriptome feature and genomic
architecture. As shown in Additional file 1, about 321
million reads (~32 Gb) high quality reads, with an average of 107 million reads (~10 Gb) per sample, were finally acquired as all clean reads. Approximately 75.04 %
and 6.76 % of total reads were considered as unique
reads and multi-position reads, which represented the
number of reads mapped to the reference genome with
unique position and multi-position, respectively. Because
multi-position reads will eventually map into one position of reference genome randomly based the complexity of reference genome as well as the limitation of
sequencing and alignment methods, it inevitably has
some biases in the analysis of gene expression level. The
result of more unique reads and less multi-position
reads in our study, therefore, will contribute to produce
more reliable alignment data to facilitate the follow-up
expression analysis.
To properly verify the expressed genes based on RNASeq, qRT-PCR assays were performed using independently
collected samples, which were in the same developmental
stage as those used for the RNA-Seq analysis. We selected
17 genes from a larger number of genes associated with
photosynthesis. These contained 14 genes belonging to
light-harvesting chlorophyll a/b binding (LHC) protein
superfamily (10 genes encoding LHC proteins and 4 genes
encoding early light-induced proteins) and 3 genes of
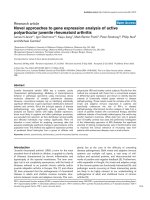
aquaporin protein family possibly involving in the regulation of stomatal numbers and sizes. Based on validating a subset of RNA-Seq by qRT-PCR, the comparative
results of Fig. 2 demonstrated similar expression patterns between RNA-Seq and qRT-PCR, which proved
the reliable of RNA-Seq data. Detailed results appeared
in Additional file 2.
Analyzing of expressed genes in bamboo
FPKM, also known as Fragments Per Kilobase of gene
per Million mapped fragments, was widely utilized in
RNA-Seq analysis, aiming to quantify analysis of gene
Page 3 of 17
expression levels. To determine which genes were
expressed in each sample, the statistic in the distribution
of gene expression values was fulfilled among the three
samples (Fig. 3 and Additional file 3). The results revealed that all genes in the three libraries of moso bamboo shared similar distribution of gene expression
(Additional file 4). Besides, the genes with FPKM > 0
accounted for ~90 % genes of the total annotated genes as
well as the number of genes with moderate expression
values (1 < FPKM ≤ 100) and high expression values (FPKM
>100) accounted for ~68 % of total annotated genes. However, approximately 22 % of the expressed genes were considered as low expression values (0 < FPKM ≤ 1).
Moreover, to explore the conservatively biological function for 19,059 expressed genes in within individual sample (marked as within-sample), the enrichment analysis of
Gene Ontology (GO) terms was performed using all bamboo genes as the background (Additional file 5). In total,
131 GO terms, “biological process” (80), “molecular function” (22), and “cellular component” (29), were detected as
significant GO terms with adjusted p-value <0.01. The results of “biological process” terms illustrated that these
expressed genes were highly enriched in the processes associated with “translation (GO:0006412)”, “organ nitrogen
compound metabolic process (GO:1901564)”, and “small
molecule metabolic process (GO:0044281)”. In the “molecular function” terms, “structural constituent of ribosome (GO:0003735)” and “RNA binding (GO:0003723)”
were mainly enriched. Ultimately, some enrichment GO
terms in the “cellular component” involved in “cytoplasm
(GO:0005737)”, “cytoplasmic part (GO:0044444)” and “ribonucleoprotein complex (GO:0030529)”.
Clustering affinity search reveals dynamic changes of
expressed genes in three samples
The clustering affinity search technique (CAST) was
broadly applied to elucidating dynamic changes in the
transcriptome during different samples [12]. The clustering results utilized by CAST in this study showed 19,059
expressed genes in within-sample were clustered into 5
groups, with the gene numbers within clusters ranging
from 337 to 6564. As shown in Fig. 4, five groups of
expressed genes shared differentially expressed patterns
according to the cluster analysis results. The same pattern
contained similar trend of expressed genes, indicating that
these genes maybe participate in similar or related biological process. As the biggest group, cluster 1 was of most
interest one because a large number of genes associated
with photosynthesis were detected, such as 26 genes of
chlorophyll a/b binding protein and 16 genes involved in
photosystem. The result indicated that the number of
genes associated with photosynthesis in cluster 1 were
more than other clusters, suggesting these genes maybe
play crucial roles in response to high light.
Zhao et al. BMC Plant Biology (2016) 16:34
Page 4 of 17
Fig. 2 Comparison of relative expression of 17 selected genes based on RNA-Seq data and qRT-PCR data. A histogram of gene expression
combined RNA-Seq data and qRT-PCR. X-axes represented 17 selected genes randomly. Y-axes represented log2 (relative expression). a 0.5H vs.
CK; b 8H vs. CK; c 8H vs.0.5H. Error bars indicate standard deviation in qRT-PCR data
Besides, to better understand and unveil expression
characteristics of clustering genes, the analysis of GO
terms enrichment was employed. For example, the gene
expression in cluster 1 was decreased continuously with
the increasing time of light treatment between 0.5H and
8H. GO enrichment also illustrated the terms of “photosynthesis (GO:0015979)”, “photosystem (GO:0009521)”
and “transporter activity (GO:0005215)” were enrichment in cluster 1. On the contrary, the gene expression
was increased continuously between 0.5H and 8H with
the increased light time. The mainly significant GO terms,
such as “protein catabolic process (GO:0030163)”, “RNA
binding (GO:003723)”, and “ribosome (GO:0030529)”,
were enrichment in cluster 2. Compared with CK in the
cluster 3, similar expression level appeared in 8H, prior to
increased expression level between 0.5H and CK. Major
significant GO terms in molecular function, “nucleic acid
binding transcription factor activity (GO:0001071)”,
“sequence-specific DNA binding transcription factor
(GO:0003700)” and “calcium ion binding (GO:0005509)”,
Zhao et al. BMC Plant Biology (2016) 16:34
Page 5 of 17
“sequence-specific DNA binding transcription factor activity (GO:0003700)”, were enriched in the dataset of
DGEs in 0.5H vs. CK (Fig. 6). Another example was that
17 significant GO terms, accounting for more than 50 %
of the total, were involved in photosystems and related
pathways in the dataset of down-regulated DGEs in 8H
vs. CK, such as “photosystem I (GO:0009522)”, “photosystem (GO:0009521)”, “thylakoid (GO:0009579) and
“photosynthesis (GO:0015979)”.
Identification and analysis of the LHC protein family in
bamboo
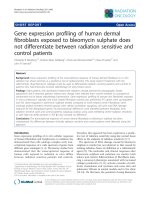
Fig. 3 Venn diagram of expressed genes with FPKM ≥ 1 in three
samples. There was 20,434, 20,956, and 20,929 expressed genes with
FPKM ≥ 1 in CK, 0.5H and 8H, respectively. The number of 19,059
expressed genes in three samples. The number of 781 expressed
genes between 0.5H and 8H. The number of 588 expressed genes
between CK and 0.5H. The number of 373 expressed genes between
CK and 8H. The number of 414 expressed genes include exclusively
in CK. The number of 528 expressed genes included exclusively in
0.5H. The number of 716 expressed genes included exclusively in
8H. Detailed information of expressed gene in Venn diagram was
attached in Additional file 3
indicating some TFs and calcium maybe participate in this
process. In addition, since a few data addressed the criteria, a few or none of significant GO terms were identified in cluster 4 and 5. The lists of genes and significant
GO terms in each group were stored in Additional file 6.
Analyzing of differentially expressed genes in three
samples
According into the pair-wise comparison between samples, 1,293 differentially expressed genes (DEGs) were
identified utilizing the following cutoff: log2FC ≥ 2 or ≤
−2, FDR < 0.01 (Table 1). The number of 154 genes that
differed in 0.5H vs. CK, included 132 up-regulated genes
and 22 down-regulated genes. The number of 710 genes
that differed in 8H vs. CK, composed of 435 upregulated genes and 275 down-regulated genes. Ultimately, of the 429 genes that differed in 0.5H vs. 8H, 337
genes were up-regulated and 92 genes were downregulated. Consequently, to vividly illustrate the expression profiles in the identified 1,293 DEGs, the heatmap
and plot were drawn in Fig. 5.
Besides, we fulfilled GO enrichment analysis to investigate the functional distribution in differentially
expressed genes (Additional file 7). The results revealed
some significant GO terms with similar function were
concentered in certain datasets. For example, GO terms
related to transcription factors, including “nucleic acid
binding transcription factor activity (GO:0001071)” and
Photosynthesis provides chemical energy for almost all
life on earth. The primary event in photosynthesis involves the absorption of solar energy from sunlight to
create electronic excitations in the peripheral antenna of
photosynthetic systems and the subsequent transfer of
the excitations to a reaction center [13]. An efficient lightharvesting step is critical for the success of photosynthesis.
In addition, the LHC proteins, also known as lightharvesting antenna, are the centerpiece of eukaryotic
photosynthesis and comprise of the LHC family and
several families associated with phtotoprotection, such as
the three-helix early light-inducible proteins (ELIPs), twohelix stress-enhanced proteins (SEPs), one-helix lightinducible proteins (OHPs), and the photosystem II subunit S (PsbS) [14, 15]. Based on genome-wide analysis, the
LHC proteins and ELIPs in Arabidopsis thaliana and
Oryza sativa were analyzed [16]. However, the genomewide study of LHC proteins was still unavailable in
bamboo. We identified and refined the LHC protein
superfamily in moso bamboo on the basis of comparative
genomic analysis and RNA-Seq in Table 2.
In total, 42 genes in moso bamboo genome were annotated as LHC and LHC-like genes, including 38 LHC genes
and 4 ELIP genes [11]. Here, we verified and refined 35, 9
and 3 genes as LHC, LHC-like, and PsbS genes in moso
bamboo, respectively, based on (i) sequence analysis of reciprocal best gene with A. thaliana and O. sativa, (ii) secondary structure prediction, (iii) sequence motifs, (iv)
domain search of KEGG, and (v) genome-wide transcriptome. For example, five genes without detailed annotation
in moso bamboo genome were refined. The refined
annotation of PH01002445G0060 was “one-helix protein
1”. The updated annotation of PH01000097G0840 and
PH01000213G0560 was “stress-enhanced protein 1”. The
refined annotation of PH01003491G0150 and PH010
00280G1190 was “stress-enhanced protein 2” and “stressenhanced protein 3”, respectively. Besides, three gene annotations, PH01000004G0130, PH01000293G0420, and
PH01000845G0420, were updated to “non-photochemical
quenching (NPQ) 4, photosystem II subunit” instead of
initial annotation “chlorophyll a/b-binding protein”.
Zhao et al. BMC Plant Biology (2016) 16:34
Page 6 of 17
Fig. 4 Cluster analysis of expressed genes in moso bamboo. The five groups were identified via the average value of log2 (FPKM + 1). The
number of gene in each groups was showed in bracketed. Significantly GO terms were depicted based on three GO categories, BP: biological
process, CC: cellular component, and MF: molecular function
Notably, the initial annotation of PH01001205G0190
with “chlorophyll a/b-binding protein” maybe have problematic, not only because of the unavailable result in sequence comparative analysis of DNA and protein, such as
nucleotide BLAST in nucleotide collection of NCBI and
protein domain search, but also because of the unavailable
expression value in this study. In addition, the expression
value of PH01001205G0190 was also undetectable in some
previous studies of moso bamboo transcriptome [8, 9, 17].
Thus, we suggested that there may be a mistake in the annotation of PH01001205G0190 initially, owing to the complexity of sequencing and assembling in moso bamboo.
There are 35 genes which encode for chlorophyll a/bbinding proteins in moso bamboo, higher than 23 genes
Table 1 Summary of differentially expressed genes in 0.5H, 8H
and CK
Samples
Up-regulated genes
Down-regulated genes
0.5H vs. CK
132
22
8H vs. CK
435
275
0.5H vs. 8H
337
92
in A. thaliana and 17 genes in O. sativa. Similarly, there
are 12 genes which encode for LHC-like and PsbS in
bamboo. Those in A. thaliana and O. sativa were 7 and
11, respectively. More copies of LHC genes indicated
more energy may be required in the fast-growth stage of
moso bamboo. The FPKM result indicated that the expression of major LHC genes was sequentially reduced
with the increased light time. Meanwhile, the expression
values of four ELIP genes appeared a large rise, consistent with the previous reports that ELIPs accumulated
during early thylakoid development and light stress. In
addition, the previous studies also confirmed that the
primary function of LHC protein was the absorption of
light through chlorophyll excitation and transfer of
absorbed energy to photochemical reaction centers,
while members of LHC-like and PsbS families were
likely involved in stress protection [18–21].
Genes related to reactive oxygen species in bamboo
Illumination of high light has possible trigging to overexcite the photosynthetic pigments and the electron
transport chain [22]. When this exceeds the requirement
Zhao et al. BMC Plant Biology (2016) 16:34
Page 7 of 17
Fig. 5 The statistics of differential expression genes. a The heatmap based on the log2 of FPKM for each gene used for hierarchical analysis at
each sample. b MA and volcano plots of significant expressed genes for a pair of samples, in 8H vs. 0.5H, 8H vs. CK and 0.5H vs. CK, respectively.
Red dot: significant expression, black dot: no significant expression, FDR: false discovery rate, FC: fold change
of normal metabolism, it arises an excess of excitation
energy in the photosystems. High energy states may be
dissipated by NPQ and/or alternative processes (such as
photorespiratory metabolism), and may be transferred to
oxygen, thus generated toxic reactive oxygen species
(ROS) [23]. To avoid damaging cellular components and
even oxidative destruction of cells, ROS must be detoxified by ROS-scavenging pathway, which contained major
enzymes, such as superoxide dismutase (SOD), ascorbate
peroxidase (APX), catalase (Cat), glutathione peroxidase
(GPX) and so on (Additional file 8). Based on bamboo
annotation and the results of reciprocal best genes with
Arabidopsis and O. sativa, we found a large number of
ROS-scavenging enzymes in moso bamboo and their
expressions were increased under high light, among
which the maximum almost appeared in 8H, such as
PH01000083G1490, PH01001010G0010, and PH0100
1942G0260.
Besides, the results of RNA-Seq data also depicted the
average value of gene expression in Calvin cycle and
photorespiratory metabolism was both declined under
high light (Additional file 9). One possible reason was
that CO2 diffusion, ATP synthesis and reluctant status,
high light maybe negatively affect the Calvin cycle by reducing the content and activity of photosynthetic carbon
reduction cycle enzymes. The limited CO2 assimilation,
thus, leaded to the decreased gene expression in
photorespiratory metabolism. Therefore, the levels of
expressed genes in Calvin cycle and photorespiratory
metabolism were suppressive under high light.
ROS signal transduction pathway fulfilled fundamental
roles in ROS signal detecting, reception and delivering
in order to regulate ROS-scavenging pathways. The results of DGEs analysis confirmed the genes in ROS signal transduction pathway were up-regulated under
high light. However, the plant heat stress transcription
factor (HSF) in the DGE dataset were more concentrated in 0.5H than 8H. High expressed genes, such as
PH01000000G3800 and PH01000546G0840, were detected in 0.5H. These indicated HSF as one of ROS signals, maybe play essential roles in early stage of high
light stress. In addition, the up-regulated genes annotated
with HSP and HSP20/alpha crystalline family protein were
detected as DGEs, such as PH01003771G0070, PH01
000906G0020, PH01000967G0270 and so on, indicating
they maybe associate with not only heat stress, but also
ROS signal sensing.
Moreover, ROS signaling event was also associated with
Ca2+ and Ca2+-binding proteins [24, 25], such as calmodulins. The up-regulated calmodulins were detected in 0.5H
and 8H, and those in 0.5H were more than in 8H. Besides,
a Ca2+ transporter, PH01000251G0960, was found as an
up-regulated gene in 0.5H. Integrated with the previous
results of redox-sensitive HSF and Ca2+, their signals
Zhao et al. BMC Plant Biology (2016) 16:34
Page 8 of 17
Fig. 6 Significant molecular functional terms for the up-regulated genes in 0.5H vs. CK. The GO terms were analyzed using an adjusted FDR value
≤0.01 as the cutoff for significant GO categories. The deeper the color, the less the value of adjusted FDR
maybe appear in preliminary stage of high light-induced,
and some of their transporters may be involved in ROS
signaling transduction in bamboo.
As one of significant ROS sensing, serine/threonine
protein kinase (OXI1) was reported previously [26, 27],
which played a central role in the activation of mitogenactivated-protein kinase (MAPK) 3 and 6 associated with
Ca2+. In this study, the up-regulated OXI1 genes, such
as PH01000015G0230, PH01000016G0280 and PH01
001215G0410, were found in 0.5H and 8H, suggesting
OXI1 maybe play a key role in ROS signal transmission
of bamboo under high light. As controlling the activation of different TFs associated with various defense
mechanisms in response to ROS stress, the MAPK3/6
was not enlisted in DEG output, but the FPKM of
MAPK3/6 was higher expression in 0.5H and 8H, and
the maximum mainly appeared in 0.5H, which maybe
depict MAPK3/6 signaling was strengthened in early
stage of high light treatment. Taken together, as a crucial
network of ROS signal transduction, including redoxsensitive HSF, Ca2+, OXI1, MAPK3/6 and some TFs, this
pathway (Fig. 7) was activated under high light and the
peak signal was appeared in the initial stage. As another
ROS signal pathway, the phosphatases was suppressed
by ROS, then inhibited phosphatases promoted the expression of OXI1 and MAPK3/6 [28]. Subsequently,
MAPK3/6 activated many TFs participated in ROSscavenging. Some down-regulated phosphatase genes
concentrated in 8H, such as lipid phosphatase gene
(PH01000297G0870), HAD superfamily phosphatase
gene (PH01001136G0170), and phosphate transporter
gene (PH01000381G0230). Therefore, the phosphatases
in ROS signal pathway maybe play a considerable role in
ROS signal transferring under high light treatment for a
relatively long time.
Potential roles of TFs in regulating ROS
To protect cells and sustain growth under high light,
bamboo responded to unfavorable changes in their environments through developmental, physiological and biochemical ways. These responses required some genes
expressed in response to light stress, which were regulated by a network of transcript factors (TFs) [23].
In the ROS signal networks, TFs played critical roles
in response to high light stress though regulating the
gene expression, by which TF was capable of binding
Type
LHC
protein
Locus Tag
Initial Annotation
Refined Annotation
Isoelectric
Point
Amino
Acids
Reciprocal best gene
Oryza sativaa
Arabidopsisb
LHCB1.2
27941.94
5.1540
264
LOC_Os01g41710
AT2G34420
Light-harvesting complex II chlorophyll a/b
binding protein 1 subunit 1
LHCB1.1
27801.90
5.1540
262
LOC_Os01g41710
AT2G34430
PH01000046G0840 Chlorophyll a/b-binding protein
Light-harvesting complex II chlorophyll a/b
binding protein 1 subunit 2
LHCB1.2
26038.72
5.0049
242
LOC_Os09g17740
AT2G34420
PH01000653G0680 Chlorophyll a/b-binding protein
Light-harvesting complex II chlorophyll a/b
binding protein 1 subunit 3
LHCB1.3
28081.26
5.4594
265
LOC_Os01g41710
AT1G29930
PH01001378G0550 Chlorophyll a/b-binding protein
Light-harvesting complex II chlorophyll a/b
binding protein 1
LHCB1.2
28107.30
5.2905
265
LOC_Os01g41710
AT2G34420
PH01004107G0040 Chlorophyll a/b-binding protein
Light-harvesting complex II chlorophyll a/b
binding protein 1 subunit 1
LHCB1.1
24516.04
8.5532
222
LOC_Os01g52240
AT2G34430
PH01000120G1210 Chlorophyll a/b-binding protein
Light-harvesting complex I chlorophyll a/b
binding protein 3
LHCA3
29564.98
7.8679
271
LOC_Os02g10390
AT1G61520
PH01002466G0350 Chlorophyll a/b-binding protein
Light-harvesting complex I chlorophyll a/b
binding protein 3
LHCA3
29512.88
7.8784
270
LOC_Os02g10390
AT1G61520
PH01000173G0670 Chlorophyll a/b-binding protein
Light-harvesting complex I chlorophyll a/b
binding protein 5
LHCA5
28131.71
6.7543
260
LOC_Os02g52650
AT1G45474
PH01000184G0790 Chlorophyll a/b-binding protein
Light-harvesting complex II chlorophyll a/b
binding protein 2 subunit 2
LHCB2.2
28531.46
5.6232
263
LOC_Os03g39610
AT2G05070
PH01000848G0570 Chlorophyll a/b-binding protein
Light-harvesting complex II chlorophyll a/b
binding protein 2 subunit 2
LHCB2.2
28502.42
5.4743
263
LOC_Os03g39610
AT2G05070
PH01000625G0360 Chlorophyll a/b-binding protein
Light-harvesting complex II chlorophyll a/b
binding protein 6
LHCB6
27233.50
8.7520
254
LOC_Os04g38410
AT1G15820
PH01004502G0160 Chlorophyll a/b-binding protein
Light-harvesting complex II chlorophyll a/b
binding protein 6
LHCB6
23571.17
8.8298
213
LOC_Os04g38410
AT1G15820
PH01003036G0080 Chlorophyll a/b-binding protein
Light-harvesting complex I chlorophyll a/b
binding protein 1
LHCA1
26527.45
6.2137
246
LOC_Os06g21590
AT3G54890
PH01000198G1100 Chlorophyll a/b-binding protein
Light-harvesting complex II chlorophyll a/b
binding protein 4
LHCB4
31873.19
5.3334
293
LOC_Os07g37240
AT5G01530
PH01000198G0580 Chlorophyll a/b-binding protein
Light-harvesting complex II chlorophyll a/b
binding protein 3
LHCB3
28704.91
5.6423
267
LOC_Os07g37550
AT5G54270
PH01003394G0090 Chlorophyll a/b-binding protein
Light-harvesting complex II chlorophyll a/b
binding protein 3
LHCB3
28784.91
5.2473
267
LOC_Os07g37550
AT5G54270
PH01000086G1040 Chlorophyll a/b-binding protein
Light-harvesting complex I chlorophyll a/b
binding protein 2
LHCA2
27826.79
5.6561
259
LOC_Os07g38960
AT3G61470
PH01000008G1530 Chlorophyll a/b-binding protein
Light-harvesting complex I chlorophyll a/b
binding protein 4
LHCA4
26759.65
6.5941
244
LOC_Os08g33820
AT3G47470
Synonym
PH01002452G0070 Chlorophyll a/b-binding protein
Light-harvesting complex II chlorophyll a/b
binding protein 1 subunit 2
PH01005133G0020 Chlorophyll a/b-binding protein
Page 9 of 17
Molecular
Weight
Annotation
Zhao et al. BMC Plant Biology (2016) 16:34
Table 2 The genes of light-harvesting complex genes of photosystem I and II, and light-inducible genes in bamboo
LHC-like
protein
Light-harvesting complex I chlorophyll a/b
binding protein 4
LHCA4
26941.80
6.5167
248
LOC_Os08g33820
AT3G47470
PH01005293G0040 Chlorophyll a/b-binding protein
Light-harvesting complex I chlorophyll a/b
binding protein 4
LHCA4
27144.08
7.8137
247
LOC_Os08g33820
AT3G47470
PH01000242G0150 Chlorophyll a/b-binding protein
Light-harvesting complex II chlorophyll a/b
binding protein 1 subunit 2
LHCB1.2
28137.19
5.1442
265
LOC_Os09g17740
AT2G34420
PH01001205G0170 Chlorophyll a/b-binding protein
Light-harvesting complex II chlorophyll a/b
binding protein 5
LHCB5
30184.53
5.4954
283
LOC_Os11g13890
AT4G10340
PH01003298G0130 Chlorophyll a/b-binding protein
Light-harvesting complex II chlorophyll a/b
binding protein 5
LHCB5
39648.83
6.5328
373
LOC_Os11g13890
AT4G10340
PH01000262G1270 Chlorophyll a/b-binding protein
Light-harvesting complex II chlorophyll a/b
binding protein 1 subunit 3
LHCB1.3
12744.85
9.2059
122
N.A.c
N.A.
PH01001205G0190 Chlorophyll a/b-binding protein
N.A.
N.A.
18690.99
11.6682
177
N.A.
N.A.
PH01002467G0130 Chlorophyll a/b-binding protein
chlorophyll a/b-binding protein
N.A.
18553.35
8.4212
171
N.A.
N.A.
PH01000848G0670 Chlorophyll a/b-binding protein
Light-harvesting complex I chlorophyll a/b
binding protein 5
LHCA5
21104.52
9.1401
189
N.A.
N.A.
PH01000234G1250 Chlorophyll a/b-binding protein
chlorophyll a/b-binding protein
20461.82
9.3290
195
N.A.
N.A.
PH01000947G0680 Chlorophyll a/b-binding protein
Light-harvesting complex II chlorophyll a/b
binding protein 6
LHCB6
11791.44
5.2976
106
N.A.
N.A.
PH01001974G0230 Chlorophyll a/b-binding protein
Light-harvesting complex I chlorophyll a/b
binding protein 1
LHCA1
11230.86
7.6956
105
N.A.
N.A.
PH01238153G0010 Chlorophyll a/b-binding protein
chlorophyll a/b-binding protein
13078.84
5.1662
115
LOC_Os07g37240.1 N.A.
PH01000903G0290 Chlorophyll a/b-binding protein
Light-harvesting complex II chlorophyll a/b
binding protein 7
LHCB7
18099.21
4.7718
167
LOC_Os09g12540.1 N.A.
PH01000948G0030 Chlorophyll a/b-binding protein
chlorophyll a/b-binding protein
N.A.
13657.46
9.7935
119
N.A.
N.A.
PH01003299G0020 Chlorophyll a/b-binding protein
Light-harvesting complex II chlorophyll a/b
binding protein 1
LHCB1
12117.37
4.8291
112
N.A.
N.A.
PH01001858G0020 Early light-induced protein,
chloroplast precursor
Early light-inducible protein 2
ELIP2
16699.45
11.4600
165
LOC_Os01g14410
N.A.
PH01001936G0100 Early light-induced protein,
chloroplast precursor
Early light-inducible protein 3
ELIP3
19715.93
11.8726
184
LOC_Os07g08160
N.A.
PH01002764G0110 Early light-induced protein,
chloroplast precursor
Early light-inducible protein 3
ELIP3
18684.59
7.8882
182
LOC_Os07g08160
N.A.
PH01002764G0170 Early light-induced protein,
chloroplast precursor
Early light-inducible protein 3
ELIP3
18616.46
6.2846
182
LOC_Os07g08160
N.A.
PH01002445G0060 Expressed protein
One-helix protein 1
Ohp1
11717.95
10.5866
110
LOC_Os12g29570
N.A.
PH01000097G0840 Expressed protein
Stress-enhanced protein 1
SEP1
11329.31
10.4135
111
LOC_Os10g25570
N.A.
PH01000213G0560 Expressed protein
Stress-enhanced protein 1
SEP1
13876.24
11.4910
136
LOC_Os10g25570
N.A.
PH01003491G0150 Expressed protein
Stress-enhanced protein 2
SEP2
19931.82
4.9638
188
LOC_Os04g54630
AT2G21970
Page 10 of 17
PH01000177G0160 Chlorophyll a/b-binding protein
Zhao et al. BMC Plant Biology (2016) 16:34
Table 2 The genes of light-harvesting complex genes of photosystem I and II, and light-inducible genes in bamboo (Continued)
PsbS
a
b
c
PH01000280G1190 Expressed protein
Stress-enhanced protein 3
SEP3
27405.31
5.2585
248
LOC_Os02g03330
N.A.
PH01000004G0130 Chlorophyll a/b-binding protein
Non-photochemical quenching (NPQ) 4,
Photosystem II subunit
PsbS
27916.47
7.8877
268
LOC_Os01g64960
N.A.
PH01000293G0420 Chlorophyll a/b-binding protein
Non-photochemical quenching (NPQ) 4,
Photosystem II subunit
PsbS
28036.82
8.9657
269
LOC_Os01g64960
AT1G44575
PH01000845G0420 Chlorophyll a/b-binding protein
Non-photochemical quenching (NPQ) 4,
Photosystem II subunit
PsbS
39164.92
5.9226
377
LOC_Os04g59440
N.A.
The annotation of bamboo and Reciprocal best genes with O. sativa were from BambooGDB
The annotation of bamboo and Reciprocal best genes with A. thaliana were from BambooGDB
N/A represent no available
Zhao et al. BMC Plant Biology (2016) 16:34
Table 2 The genes of light-harvesting complex genes of photosystem I and II, and light-inducible genes in bamboo (Continued)
Page 11 of 17
Zhao et al. BMC Plant Biology (2016) 16:34
Page 12 of 17
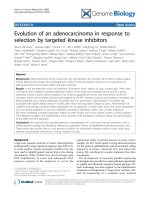
Fig. 7 Generalized model of reactive oxygen species (ROS) pathway in bamboo. A large amount of high light (HL) produced an excess of
excitation energy in the light reaction. Some of high energy maybe transferred to oxygen, thus generated toxic ROS. ROS can be detected by
one of mechanisms, redox sensitive transcription factors. Phosphatidic acid and Ca2+ activate the serine/threonine protein kinase (OXI1). Then, the
activation of OXI1 activated the mitogen-activated-protein kinase (MAPK) cascade (MAPK3/6) and these induced or activated short/mid-term
response transcription factors that regulated the ROS-scavenging and related pathways. In the ROS-scavenging, main ROS enzymes, reaction
equation and reaction location were listed in moso bamboo. Abbreviations: HL, high light; PSII, photosystem II; PSI, photosystem I; Chl, chlorophyll; PC,
plastocyanin; Cyt, cytochrome; PQ, plastoquinone; 3PGA, 3-phosphoglycerate; RuBP, ribulose-1,5-biphosphate; ROS, reactive oxygen species; SOD,
superoxide dismutase; APX, ascorbate peroxidase; MDAR, monodehydroascorbate reductase; GR, glutathione reductase; Cat, catalase; GPX, glutathione
peroxidase; AOX, alternative oxidase; PrxR, peroxiredoxin; Trx, thioredoxins; GLR, glutaredoxin; chl, chloroplast; cyt, cytosol; mem, membrane; mit,
mitochondria; nuc, nuclei; per, peroxisomes
the cis-acting elements present in the promoter of a
target gene.
As previous studies indicated, many TFs maybe involve in ROS signal networks under high light stress.
Firstly, HSF, as one of key regulators in heat shock response, will up-regulate heat shock proteins (HSPs) [29].
HSPs not only can be activated and expressed during
normal conditions, such as the cell growth and developments, but also can be induced by some stresses, such as
heat shock, infection and heavy metals [30]. Secondly,
NAC was associated with the induction of genes related
to flavonoid biosynthesis, leading to the accumulation of
Zhao et al. BMC Plant Biology (2016) 16:34
anthocyanin in response to high light stress [31–41].
Thirdly, MYB played important roles in both stomatal
and non-stomatal responses by the regulation of stomatal numbers and sizes, and metabolic components, respectively, in the regulation of photosynthetic and
related metabolism [42, 43]. Fourthly, AP2/ERF was a
large family of plant-specific TFs that regulated the expression of abiotic stress responsive gene. Finally,
WRKY, as one of plant-specific TFs, contained one large
family of regulatory protein in plants [44–46], which
participated in various biotic stress response and several
developmental and physiological processes [47–52].
Some WRKYs in A. thaliana were significantly enhanced
by H2O2, which was one specific ROS [53–60]. These indicated WRKY maybe perform an important role under
oxidative stress.
Therefore, combined with the previous studies and
RNA-Seq data, the results illustrated many bamboo TFs,
such as HSF, MYB, bZIP, AR2/ERF, NAC, and WRKY,
maybe also involve in ROS signal networks under high
light (Table 3) and play crucial roles in regulating, acclimating, and modulating gene expression in photosynthesis process in response to high light. Besides, based
on the analysis of expression data and DGEs, the TFs of
NAC, WRKY, AR2/ERF, and bHLH might fulfill important roles in short-term (0.5H), while those of C2H2, HSF,
bZIP, and MYB might perform vital roles both in shortterm (0.5H) and mid-term (8H) in response to high
light.
Conclusions
A global view of gene expression profiles and a largescale stage-specific transcriptome profile in leaves of
moso bamboo provided more accurate insights into the
gene and gene regulation in response to high light based
on deeply sequencing technology. In total, 1,293 genes
were identified as differentially expressed genes and 47
gene annotations for LHC protein superfamily members
in moso bamboo were refined. In addition, the pathway
of ROS, including ROS signal transduction and ROSscavenging, was detected. Meanwhile, 171 genes involved in ROS-scavenging were identified. Besides, some
essential expressed genes and transcript factors were
found, which played crucial roles in different regulated
processes under high light. These results may provide a
key resource for further experimental research on function of some proteins involved in light stress, and expand our knowledge of the mechanisms in bamboo
under light stress.
Page 13 of 17
light/8 h dark) at 25 °C, with a light intensity of
200 μmol · m−2 · s−1. The air relative humidity was about
50 %. For high light stress, one-year-old seedlings were
moved from normal light condition (200 μmol · m−2 · s−1)
to high light (1200 μmol · m−2 · s−1) provided by cool
white fluorescent tubes. The third leaf on the top of
seedlings were selected for the measurement of chlorophyll fluorescence parameters after 0 h, 0.5 h, 1 h, 2 h,
4 h, 8 h and 12 h high light treatments, respectively.
Measurement of chlorophyll fluorescence parameters
In vivo chlorophyll fluorescence parameters of leaves
from one-year-old seedling of moso bamboo were measured with Dual PAM-100 fluorometer (Walz, Effeltrich,
Germany). The following parameters were calculated:
the maximum quantum yield of PSII Fv/Fm = (Fm-Fo)/Fm
and the non-photochemical quenching of NPQ was calculated as (Fm –Fm’)/ Fm’[10], where Fo is the minimum
fluorescence in the dark-adapted state, Fm and Fm’ are
the darkness-adapted and light-adapted maximum fluorescence upon illumination of pulse (0.6 s) of saturating
light, respectively. Fo and Fm were determined after
20 min dark adaptation. Each parameter was measured
with ten replicates per treatment. All data were statistically analyzed using SPSS software.
RNA isolation, cDNA library construction, and RNA
sequencing
Of the previous materials, three samples of moso bamboo, containing the leaves under high light (1200 μmol ·
m−2 · s−1) for 0 h (CK), 0.5 h (0.5H), and 8 h (8H) were
collected, respectively. Each sample was collected from
at least three individual bamboos randomly selected in
genetically distinct, and the mixed bundle was quickly
frozen in liquid nitrogen for RNA isolation. The total
RNA was isolated from samples of all selected bamboo
tissues using TRIZOL Reagent Solution (Invitrogen,
Carlsbad, CA, USA) on the basis of the manufacturer’s
instructions. The extracted RNA was treated with
RNase-free DNase I for 30 min at 37 °C in order to remove the residual DNA. The quality and quantity of
RNA were detected using a NanoDrop 2000 spectrophotometer. Reverse transcription was conducted with Reverse Transcription System (Promage, USA) [61]. The
cDNA library construction and normalization were performed as previously described [62]. Then the pooled libraries were sequenced by the Illumina HiSeqTM 2000
platform (Illumina, San Diego, CA, USA).
Bioinformatics analysis
Methods
Plant materials and high light treatment
Moso bamboo (Phyllostachys edulis) seedlings were potted in our laboratory under long-day conditions (16 h
Firstly, adaptor sequences and low quality sequences
were trimmed using Trimmomatic [62]. Secondly, to accurate align clean reads to the reference bamboo genome and explore unannotated gene, insert size of cDNA
Differentially expressed genes
Samples
Up/down-regulated
Number
bHLH
0.5H vs. CK
Up
11
PH01000179G0630,PH01000260G1030,PH01000323G0290,PH01000783G0460,PH01001228G0390,PH01001641G0420,PH01002972G0210,
PH01002972G0240,PH01003790G0150,PH01005158G0070,PH01103680G0010
8H vs. CK
Down
3
PH01000105G0060,PH01000110G0500, PH01000331G0630
0.5H vs. CK
Up
1
PH01000242G0910
8H vs. CK
Down
2
PH01000105G1660,PH01000145G1240
0.5H vs. CK
Up
10
PH01000040G0510,PH01001038G0420,PH01001038G0430,PH01001065G0460,PH01001535G0570,PH01001743G0120,PH01001743G0130,
PH01002187G0020,PH01002335G0340,PH01005966G0040
0.5H vs. CK
Down
2
PH01000140G0830,PH01000021G0290
8H vs. CK
Up
2
PH01000054G1270,PH01000673G0600
0.5H vs. CK
Up
22
PH01000046G1730,PH01000084G1170,PH01000129G0360,
PH01000131G1230,PH01000131G1240,PH01000343G0330,PH01000437G0390,PH01000543G0370,PH01000559G0630,PH01000573G0670,
PH01000668G0390,PH01000841G0400,PH01000842G0220,PH01000890G0360,PH01001360G0530,PH01001480G0410,PH01000034G0340,
PH01002169G0130,PH01002648G0300,PH01002733G0270,PH01003475G0200,PH01007432G0010
8H vs. CK
Up
2
PH01000016G1360,PH01000018G0790
8H vs. CK
Down
2
PH01000038G0910,PH01001704G0270
0.5H vs. CK
Up
7
PH01000081G0140,PH01000174G0590,PH01000314G0470,PH01000546G0840,PH01002606G0040,PH01003169G0070,PH01000000G3800
8H vs. CK
UP
1
PH01000701G0030
0.5H vs. CK
Up
14
PH01000004G1580,PH01000043G2100,PH01000169G1060,PH01000302G0910,PH01000309G0470,PH01000415G0090,PH01000515G0560,
PH01002987G0150,PH01000617G0820,PH01000688G0030,PH01000912G0430,PH01001208G0070,PH01001287G0090,PH01001996G0370
0.5H vs. CK
Down
3
PH01007341G0010,PH01002611G0010,PH01007341G0010
8H vs. CK
Up
2
PH01003809G0130,PH01003918G0100
8H vs. CK
Down
3
PH01000604G0860,PH01000383G0320,PH01000931G0030
0.5H vs. CK
Up
11
PH01000004G1630,PH01000053G1650,PH01000112G0050,PH01000122G1000,PH01000261G0890,PH01000309G0360,PH01000877G0160,
PH01001177G0140,PH01001669G0130,PH01001843G0210,PH01002777G0100
8H vs. CK
Down
1
PH01003138G0210
0.5H vs. CK
Up
17
PH01000046G1680,PH01000112G1290,PH01000182G0790,PH01000534G0230,PH01000659G0050,PH01000735G0110,PH01001037G0370,
PH01001737G0080,PH01001777G0070,PH01002011G0380,PH01002018G0330,PH01002744G0230 PH01000009G2100,PH01002800G0110,
PH01003110G0050,PH01003922G0080,PH01004940G0100
8H vs. CK
Down
3
PH01003579G0140,PH01000823G0340,PH01002022G0200
bZIP
C2H2
AP2/ERF
HSF
MYB
NAC
WRKY
TF list
Page 14 of 17
TF
family
Zhao et al. BMC Plant Biology (2016) 16:34
Table 3 Transcript factors maybe involve in response to high light stress in moso bamboo
Zhao et al. BMC Plant Biology (2016) 16:34
libraries and de novo assembly of the clean reads were
performed by Trinity software [63]. Then, as the reference genome, the genome sequences and annotation of
moso bamboo (version 1) was downloaded from Bamboo Genome Database (www.bamboogdb.org) [11]. The
filtered sequences were mapped to the reference bamboo
genome using TopHat2 [64]. Subsequently, the aligned
read files were processed by Cufflinks [65]. After reads
were assembled into transcripts, their abundance was estimated and normalized using the number s of reads per
kilobase of exon sequence in a gene per million mapped
reads [66]. In the analysis of functional and structural
annotation, GO enrichment was carried out using Ontologizer [67].
Primer design and validation of RNA-Seq data
The primer pairs for flanking sequences of each unique
gene were designed automatically using the Primer3
(Additional file 10). All primers were tested with rTaq
(TaKaRa, Japan) before quantitative real time PCR (qRTPCR) performed. The qRT-PCR reactions were performed on Qtower (analyticjena, Germany) with Roche
LightCycler 480 SYBR Green I Master Kit. The reaction
volume was 10 μL and contained 5.0 μL 2 × SYBR Green
I Master Mix, 0.8 μL cDNA, 0.2 μL forward primer and
reverse primer each (5 μM), and 3.8 μL ddH2O. All reactions were repeated three times. The qRT-PCR procedure consisted of 95 °C for 10 min and 50 cycles of 95 °C
for 10 s, 60 °C for 10 s. For each condition, the qRTPCR experiments were performed as biological triplicates. The relative gene expression level was calculated
with the 2-△△Ct method [68] using NTB as the reference
gene [69].
Accession numbers
All sequence data for three samples from this article
have been deposited in the Short Read Archive (SRA) at
the NCBI database under the following accession numbers: SRR2035212, SRR2035263, and SRR2035327.
Additional files
Additional file 1: Differential samples isolated from moso bamboo
for RNA-Seq analysis. (XLSX 10 kb)
Additional file 2: Relative expression values of RNA-Seq and qRTPCR in selected 17 genes. (XLSX 12 kb)
Additional file 3: The list of expressed genes with FPKM ≥1 in Venn
diagram. (XLSX 289 kb)
Additional file 4: Distribution of gene expression values among
samples. (XLSX 10 kb)
Additional file 5: The significant GO terms in within-sample. (XLSX
20 kb)
Additional file 6: The list of genes and significant GO terms in five
groups based on clustering affinity search technique. (XLSX 293 kb)
Page 15 of 17
Additional file 7: The list of differentially expressed genes in three
samples. (XLSX 135 kb)
Additional file 8: Gene and expression of the reactive oxygen
species scavenging in moso bamboo. (XLSX 29 kb)
Additional file 9: The values of gene expression in Calvin cycle and
photorespiratory metabolism. (XLSX 12 kb)
Additional file 10: Primers of 17 selected genes from moso bamboo
utilized in qRT-PCR. (XLSX 11 kb)
Abbreviations
APX: ascorbate peroxidase; BLAST: basic local alignment search tool;
CAST: clustering affinity search technique; Cat: catalase; DEG: differentially
expressed gene; ELIPs: early light-inducible proteins; FPKM: fragments per
kilobase of gene per million mapped fragments; GO: gene ontology;
GPX: glutathione peroxidase; HSF: heat stress transcription factor;
KEGG: kyoto encyclopedia of genes and genomes; LHC: light-harvesting
chlorophyll a/b-binding; MAPK: mitogen-activated-protein kinase; NPQ:
non-photochemical quenching; OHPs: one-helix light-inducible proteins;
PsbS: photosystem II subunit S; qRT-PCR: quantitative real time PCR; RNASeq: RNA sequencing; ROS: reactive oxygen species; SEPs: stress-enhanced
proteins; SOD: superoxide dismutase; TF: transcript factor.
Competing interests
The authors declare that they have no competing interests.
Authors’ contributions
HSZ designed the experiment, carried out the mainly bioinformatics
analyses, drafted the manuscript. YFL designed and carried out the
measurement of chlorophyll fluorescence parameters. HYS participated in
the design of the study. LCL carried out the validated experiments by
quantitative real time PCR. LLW performed the statistical analysis. LLD
performed figure assembly. ZMG designed the bench validation, revised the
manuscript. All authors read and approved the final manuscript.
Acknowledgements
Funding
The work was supported by the Sub-Project of National Science and
Technology Support Plan of the Twelfth Five-Year in China [No. 2015BAD04B03
and No. 2015BAD04B01], and Fundamental Research Funds for International
Center for Bamboo and Rattan [No. 1632015008], and the National Science
Foundation of China [No. 31400557 and No. 31370588].
Received: 13 August 2015 Accepted: 21 January 2016
References
1. Zhou G, Wu J, Jiang P. Effects of different management models on carbon
storage in Phyllostachys pubescens forests. J Beijing Forestry Uni (in
Chinese). 2006;28(6):51.
2. Jiang Z, Peng Z, Gao Z, Liu C, Yang C. Characterization of different isoforms
of the light-harvesting chlorophyll a/b complexes of photosystem II in
bamboo. Photosynthetica. 2012;50(1):129–38.
3. Metzker ML. Sequencing technologies-the next generation. Nat Rev Genet.
2010;11(1):31–46.
4. Schuster SC. Next-generation sequencing transforms today’s biology. Nat
Methods. 2008;5(1):16–8.
5. Peng Z, Lu Y, Li L, Zhao Q, Feng Q, Gao Z, et al. The draft genome of the
fast-growing non-timber forest species moso bamboo (Phyllostachys
heterocycla). Nat Genet. 2013;45(4):456–61.
6. Peng Z, Lu T, Li L, Liu X, Gao Z, Hu T, et al. Genome-wide characterization
of the biggest grass, bamboo, based on 10,608 putative full-length cDNA
sequences. BMC Plant Biol. 2010;10:116.
7. Gao ZM, Li CL, Peng ZH. Generation and analysis of expressed sequence
tags from a normalized cDNA library of young leaf from Ma bamboo
(Dendrocalamus latiflorus Munro). Plant Cell Rep. 2011;30(11):2045–57.
8. Gao J, Zhang Y, Zhang C, Qi F, Li X, Mu S, et al. Characterization of the floral
transcriptome of Moso bamboo (Phyllostachys edulis) at different flowering
Zhao et al. BMC Plant Biology (2016) 16:34
9.
10.
11.
12.
13.
14.
15.
16.
17.
18.
19.
20.
21.
22.
23.
24.
25.
26.
27.
28.
29.
30.
31.
32.
33.
developmental stages by transcriptome sequencing and RNA-seq analysis.
PLoS One. 2014;9(6), e98910.
Peng Z, Zhang C, Zhang Y, Hu T, Mu S, Li X, et al. Transcriptome
sequencing and analysis of the fast growing shoots of moso bamboo
(Phyllostachys edulis). PLoS One. 2013;8(11), e78944.
Maxwell K, Johnson GN. Chlorophyll fluorescence–a practical guide. J Exp
Bot. 2000;51(345):659–68.
Zhao H, Peng Z, Fei B, Li L, Hu T, Gao Z, et al. BambooGDB: a bamboo
genome database with functional annotation and an analysis platform.
Database (Oxford). 2014;2014:bau006.
Saeed AI, Sharov V, White J, Li J, Liang W, Bhagabati N, et al. TM4: a free,
open-source system for microarray data management and analysis.
Biotechniques. 2003;34(2):374–8.
Cheng YC, Fleming GR. Dynamics of light harvesting in photosynthesis.
Annu Rev Phys Chem. 2009;60:241–62.
Engelken J, Brinkmann H, Adamska I. Taxonomic distribution and origins of
the extended LHC (light-harvesting complex) antenna protein superfamily.
BMC Evol Biol. 2010;10:233.
Green BR. Was “molecular opportunism” a factor in the evolution of
different photosynthetic light-harvesting pigment systems? Proc Natl Acad
Sci U S A. 2001;98(5):2119–21.
Umate P. Genome-wide analysis of the family of light-harvesting chlorophyll
a/b-binding proteins in Arabidopsis and rice. Plant Signal Behav. 2010;5(12):
1537–42.
He CY, Cui K, Zhang JG, Duan AG, Zeng YF. Next-generation sequencingbased mRNA and microRNA expression profiling analysis revealed pathways
involved in the rapid growth of developing culms in Moso bamboo. BMC
Plant Biol. 2013;13:119.
Montané M-H, Kloppstech K. The family of light-harvesting-related proteins
(LHCs, ELIPs, HLIPs): was the harvesting of light their primary function?
Gene. 2000;258(1):1–8.
Adamska I. The Elip family of stress proteins in the thylakoid membranes
of pro-and eukaryota. In: Regulation of Photosynthesis. Springer. 2001. p.
487–505.
Dolganov N, Bhaya D, Grossman AR. Cyanobacterial protein with similarity
to the chlorophyll a/b binding proteins of higher plants: evolution and
regulation. Proc Natl Acad Sci U S A. 1995;92(2):636–40.
Li X-P, Björkman O, Shih C, Grossman AR, Rosenquist M, Jansson S, et al. A
pigment-binding protein essential for regulation of photosynthetic light
harvesting. Nature. 2000;403(6768):391–5.
Goss R, Lepetit B. Biodiversity of NPQ. J Plant Physiol. 2015;172:13–32.
Saibo NJ, Lourenco T, Oliveira MM. Transcription factors and regulation of
photosynthetic and related metabolism under environmental stresses. Ann
Bot. 2009;103(4):609–23.
Bowler C, Fluhr R. The role of calcium and activated oxygens as signals for
controlling cross-tolerance. Trends Plant Sci. 2000;5(6):241–6.
Knight H, Knight MR. Abiotic stress signalling pathways: specificity and
cross-talk. Trends Plant Sci. 2001;6(6):262–7.
Nakagami H, Pitzschke A, Hirt H. Emerging MAP kinase pathways in plant
stress signalling. Trends Plant Sci. 2005;10(7):339–46.
Wang H, Ngwenyama N, Liu Y, Walker JC, Zhang S. Stomatal development
and patterning are regulated by environmentally responsive mitogenactivated protein kinases in Arabidopsis. Plant Cell. 2007;19(1):63–73.
Mittler R, Vanderauwera S, Gollery M, Van Breusegem F. Reactive oxygen
gene network of plants. Trends Plant Sci. 2004;9(10):490–8.
Scharf KD, Berberich T, Ebersberger I, Nover L. The plant heat stress
transcription factor (Hsf) family: structure, function and evolution. Biochim
Biophys Acta. 2012;1819(2):104–19.
Westerheide SD, Raynes R, Powell C, Xue B, Uversky VN. HSF transcription
factor family, heat shock response, and protein intrinsic disorder. Curr
Protein Pept Sci. 2012;13(1):86–103.
Gong W, Shen Y-P, Ma L-G, Pan Y, Du Y-L, Wang D-H, et al. Genome-Wide
ORFeome Cloning and Analysis of Arabidopsis Transcription Factor Genes.
Plant Physiol. 2004;135(2):773–82.
Souer E, Van Houwelingen A, Kloos D, Mol J, Koes R. The no apical
meristem gene of Petunia is required for pattern formation in embryos and
flowers and is expressed at meristem and primordia boundaries. Cell. 1996;
85(2):159–70.
Vroemen CW, Mordhorst AP, Albrecht C, Kwaaitaal MACJ, De Vries SC. The
CUP-SHAPED COTYLEDON3 Gene Is Required for Boundary and Shoot
Meristem Formation in Arabidopsis. Plant Cell. 2003;15(7):1563–77.
Page 16 of 17
34. Xie Q, Frugis G, Colgan D, Chua N-H. Arabidopsis NAC1 transduces auxin
signal downstream of TIR1 to promote lateral root development. Genes
Dev. 2000;14(23):3024–36.
35. Tran L-SP, Nakashima K, Sakuma Y, Simpson SD, Fujita Y, Maruyama K, et al.
Isolation and Functional Analysis of Arabidopsis Stress-Inducible NAC
Transcription Factors That Bind to a Drought-Responsive cis-Element in the
early responsive to dehydration stress 1 Promoter. Plant Cell. 2004;16(9):
2481–98.
36. Fujita M, Fujita Y, Maruyama K, Seki M, Hiratsu K, Ohme‐Takagi M, et al. A
dehydration‐induced NAC protein, RD26, is involved in a novel ABA‐
dependent stress‐signaling pathway. Plant J. 2004;39(6):863–76.
37. Aida M, Ishida T, Fukaki H, Fujisawa H, Tasaka M. Genes involved in organ
separation in Arabidopsis: an analysis of the cup-shaped cotyledon mutant.
Plant Cell. 1997;9(6):841–57.
38. Xiong Y, Liu T, Tian C, Sun S, Li J, Chen M. Transcription factors in rice: a
genome-wide comparative analysis between monocots and eudicots. Plant
Mol Biol. 2005;59(1):191–203.
39. Morita Y, Saitoh M, Hoshino A, Nitasaka E, Iida S. Isolation of cDNAs for
R2R3-MYB, bHLH and WDR Transcriptional Regulators and Identification of c
and ca Mutations Conferring White Flowers in the Japanese Morning Glory.
Plant Cell Physiol. 2006;47(4):457–70.
40. Feild TS, Lee DW, Holbrook NM. Why Leaves Turn Red in Autumn. The Role
of Anthocyanins in Senescing Leaves of Red-Osier Dogwood. Plant Physiol.
2001;127(2):566–74.
41. Morishita T, Kojima Y, Maruta T, Nishizawa-Yokoi A, Yabuta Y, Shigeoka S.
Arabidopsis NAC Transcription Factor, ANAC078, Regulates Flavonoid
Biosynthesis under High-light. Plant Cell Physiol. 2009;50(12):2210–22.
42. Singh K, Foley RC, Onate-Sanchez L. Transcription factors in plant defense
and stress responses. Curr Opin Plant Biol. 2002;5(5):430–6.
43. Lockhart J. Frenemies: Antagonistic bHLH/bZIP Transcription Factors
Integrate Light and Reactive Oxygen Species Signaling in Arabidopsis. Plant
Cell. 2013;25(5):1483.
44. Weigel D. The APETALA2 domain is related to a novel type of DNA binding
domain. Plant Cell. 1995;7(4):388.
45. Shigyo M, Hasebe M, Ito M. Molecular evolution of the AP2 subfamily. Gene.
2006;366(2):256–65.
46. Magnani E, Sjolander K, Hake S. From endonucleases to transcription factors:
evolution of the AP2 DNA binding domain in plants. Plant Cell. 2004;16(9):
2265–77.
47. Hennig L. Plant gene regulation in response to abiotic stress. Biochim
Biophys Acta. 2012;1819(2):85.
48. Chen L, Song Y, Li S, Zhang L, Zou C, Yu D. The role of WRKY transcription
factors in plant abiotic stresses. Biochim Biophys Acta. 2012;1819(2):120–8.
49. Eulgem T, Rushton PJ, Robatzek S, Somssich IE. The WRKY superfamily of
plant transcription factors. Trends Plant Sci. 2000;5(5):199–206.
50. Johnson CS, Kolevski B, Smyth DR. TRANSPARENT TESTA GLABRA2, a
trichome and seed coat development gene of Arabidopsis, encodes a WRKY
transcription factor. Plant Cell. 2002;14(6):1359–75.
51. Lagace M, Matton DP. Characterization of a WRKY transcription factor
expressed in late torpedo-stage embryos of Solanum chacoense. Planta.
2004;219(1):185–9.
52. Pandey SP, Somssich IE. The role of WRKY transcription factors in plant
immunity. Plant Physiol. 2009;150(4):1648–55.
53. Miao Y, Zentgraf U. The antagonist function of Arabidopsis WRKY53 and
ESR/ESP in leaf senescence is modulated by the jasmonic and salicylic acid
equilibrium. Plant Cell. 2007;19(3):819–30.
54. Zhou X, Jiang Y, Yu D. WRKY22 transcription factor mediates dark-induced
leaf senescence in Arabidopsis. Mol Cells. 2011;31(4):303–13.
55. Chen L, Zhang L, Yu D. Wounding-induced WRKY8 is involved in basal
defense in Arabidopsis. Mol Plant Microbe Interact. 2010;23(5):558–65.
56. Vanderauwera S, Zimmermann P, Rombauts S, Vandenabeele S,
Langebartels C, Gruissem W, et al. Genome-wide analysis of hydrogen
peroxide-regulated gene expression in Arabidopsis reveals a high lightinduced transcriptional cluster involved in anthocyanin biosynthesis. Plant
Physiol. 2005;139(2):806–21.
57. Rizhsky L, Davletova S, Liang H, Mittler R. The zinc finger protein Zat12 is
required for cytosolic ascorbate peroxidase 1 expression during oxidative
stress in Arabidopsis. J Biol Chem. 2004;279(12):11736–43.
58. Davletova S, Schlauch K, Coutu J, Mittler R. The zinc-finger protein Zat12
plays a central role in reactive oxygen and abiotic stress signaling in
Arabidopsis. Plant Physiol. 2005;139(2):847–56.
Zhao et al. BMC Plant Biology (2016) 16:34
Page 17 of 17
59. Xiao H, Tang J, Li Y, Wang W, Li X, Jin L, et al. STAMENLESS 1, encoding a
single C2H2 zinc finger protein, regulates floral organ identity in rice. Plant J.
2009;59(5):789–801.
60. Wang Y, Dou D, Wang X, Li A, Sheng Y, Hua C, et al. The PsCZF1 gene
encoding a C2H2 zinc finger protein is required for growth, development
and pathogenesis in Phytophthora sojae. Microb Pathog. 2009;47(2):78–86.
61. Dasgupta P, Kinkade R, Joshi B, Decook C, Haura E, Chellappan S. Nicotine
inhibits apoptosis induced by chemotherapeutic drugs by up-regulating
XIAP and survivin. Proc Natl Acad Sci U S A. 2006;103(16):6332–7.
62. Severin AJ, Woody JL, Bolon YT, Joseph B, Diers BW, Farmer AD, et al. RNASeq Atlas of Glycine max: a guide to the soybean transcriptome. BMC Plant
Biol. 2010;10:160.
63. Haas BJ, Papanicolaou A, Yassour M, Grabherr M, Blood PD, Bowden J, et al.
De novo transcript sequence reconstruction from RNA-seq using the Trinity
platform for reference generation and analysis. Nat Protoc. 2013;8(8):1494–512.
64. Trapnell C, Pachter L, Salzberg SL. TopHat: discovering splice junctions with
RNA-Seq. Bioinformatics. 2009;25(9):1105–11.
65. Trapnell C, Roberts A, Goff L, Pertea G, Kim D, Kelley DR, et al. Differential
gene and transcript expression analysis of RNA-seq experiments with
TopHat and Cufflinks. Nat Protoc. 2012;7(3):562–78.
66. Mortazavi A, Williams BA, McCue K, Schaeffer L, Wold B. Mapping and
quantifying mammalian transcriptomes by RNA-Seq. Nat Methods. 2008;5(7):
621–8.
67. Bauer S, Grossmann S, Vingron M, Robinson PN. Ontologizer 2.0–a
multifunctional tool for GO term enrichment analysis and data exploration.
Bioinformatics. 2008;24(14):1650–1.
68. Livak KJ, Schmittgen TD. Analysis of relative gene expression data using
real-time quantitative PCR and the 2− ΔΔCT method. Methods. 2001;25(4):
402–8.
69. Fan C, Ma J, Guo Q, Li X, Wang H, Lu M. Selection of reference genes for
quantitative real-time PCR in bamboo (Phyllostachys edulis). PLoS One. 2013;
8(2), e56573.
Submit your next manuscript to BioMed Central
and we will help you at every step:
• We accept pre-submission inquiries
• Our selector tool helps you to find the most relevant journal
• We provide round the clock customer support
• Convenient online submission
• Thorough peer review
• Inclusion in PubMed and all major indexing services
• Maximum visibility for your research
Submit your manuscript at
www.biomedcentral.com/submit