Phytohormone balance and stress-related cellular responses are involved in the transition from bud to shoot growth in leafy spurge
Bạn đang xem bản rút gọn của tài liệu. Xem và tải ngay bản đầy đủ của tài liệu tại đây (3.77 MB, 21 trang )
Chao et al. BMC Plant Biology (2016) 16:47
DOI 10.1186/s12870-016-0735-2
RESEARCH ARTICLE
Open Access
Phytohormone balance and stress-related
cellular responses are involved in the
transition from bud to shoot growth in
leafy spurge
Wun S. Chao*, Münevver Doğramaci, David P. Horvath, James V. Anderson and Michael E. Foley
Abstract
Background: Leafy spurge (Euphorbia esula L.) is an herbaceous weed that maintains a perennial growth pattern
through seasonal production of abundant underground adventitious buds (UABs) on the crown and lateral roots.
During the normal growing season, differentiation of bud to shoot growth is inhibited by physiological factors
external to the affected structure; a phenomenon referred to as paradormancy. Initiation of shoot growth from
paradormant UABs can be accomplished through removal of the aerial shoots (hereafter referred to as
paradormancy release).
Results: In this study, phytohormone abundance and the transcriptomes of paradormant UABs vs. shoot-induced
growth at 6, 24, and 72 h after paradormancy release were compared based on hormone profiling and RNA-seq
analyses. Results indicated that auxin, abscisic acid (ABA), and flavonoid signaling were involved in maintaining
paradormancy in UABs of leafy spurge. However, auxin, ABA, and flavonoid levels/signals decreased by 6 h after
paradormancy release, in conjunction with increase in gibberellic acid (GA), cytokinin, jasmonic acid (JA),
ethylene, and brassinosteroid (BR) levels/signals. Twenty four h after paradormancy release, auxin and ABA levels/
signals increased, in conjunction with increase in GA levels/signals. Major cellular changes were also identified in
UABs at 24 h, since both principal component and Venn diagram analysis of transcriptomes clearly set the 24 h
shoot-induced growth apart from other time groups. In addition, increase in auxin and ABA levels/signals and the
down-regulation of 40 over-represented AraCyc pathways indicated that stress-derived cellular responses may be
involved in the activation of stress-induced re-orientation required for initiation of shoot growth. Seventy two h
after paradormancy release, auxin, cytokinin, and GA levels/signals were increased, whereas ABA, JA, and ethylene
levels/signals were decreased.
Conclusion: Combined results were consistent with different phytohormone signals acting in concert to direct cellular
changes involved in bud differentiation and shoot growth. In addition, shifts in balance of these phytohormones at
different time points and stress-related cellular responses after paradormancy release appear to be critical factors
driving transition of bud to shoot growth.
Keywords: Dormancy, Hormone profiling, Leafy spurge, RNA-seq, Vegetative growth
* Correspondence:
USDA-Agricultural Research Service, Biosciences Research Laboratory, 1605
Albrecht Boulevard, Fargo, ND 58102-2765, USA
© 2016 Chao et al. Open Access This article is distributed under the terms of the Creative Commons Attribution 4.0
International License ( which permits unrestricted use, distribution, and
reproduction in any medium, provided you give appropriate credit to the original author(s) and the source, provide a link to
the Creative Commons license, and indicate if changes were made. The Creative Commons Public Domain Dedication waiver
( applies to the data made available in this article, unless otherwise stated.
Chao et al. BMC Plant Biology (2016) 16:47
Background
Leafy spurge (Euphorbia esula L.) is an herbaceous perennial weed that causes major economic losses in the
Upper Great Plains of the United States [1, 2]. It maintains its perennial growth cycle through the seasonal
production of abundant underground adventitious buds
(UABs) on the crown and lateral roots (often referred to
as crown and root buds). Dormancy in these UABs inhibits initiation of new vegetative growth under favorable or unfavorable environmental conditions and is an
important survival mechanism [3]. Leafy spurge UABs
are capable of manifesting the three well-defined phases
of para-, endo-, and eco-dormancy [4]. Paradormancy is
growth cessation controlled by physiological factors external to the affected structure, endodormacy is growth
cessation controlled by internal physiological factors,
and ecodormancy is growth cessation controlled by external environmental factors [5].
Signals originating from environmental and physiological factors during plant development are involved in
facilitating the different phases of dormancy [6, 7]. Environmental signals such as temperature and light play
crucial roles in regulating induction and release of bud
dormancy, though the extent of their effects and the
crosstalk between temperature- and light-regulated
signaling pathways appear to be species dependent [7].
Physiological signals, including phytochrome, sugar,
and phytohormones, are basically associated with direct phenotypic changes when plants perceive environmental signals.
Phytohormones that have been associated with bud
growth and development include abscisic acid (ABA), ethylene, gibberellic acid (GA), cytokinin, brassinosteroids (BR),
and auxin. ABA is involved in stress responses, bud development, and bud maturation [8–10] and may contribute to the
suppression of growth during bud formation [9] and the development of endodormancy [11, 12]. Ethylene facilitates
short day photoperiod-induced terminal bud formation, as
well as normal endodormancy development [13, 14]. Ethylene is also required for ABA accumulation [13, 15] and may
interact with ABA and auxin signaling pathways for apical
dominance [14]. GA alone or in combination with
other hormones regulates many aspects of plant
growth and development [16] including vegetative bud
growth (cell elongation) following dormancy release
[6]. Cytokinins control cell division, shoot meristem
initiation, leaf and root differentiation, and various aspects of plant growth and development [17]. Cytokinins also function as key regulatory signals promoting
axillary bud outgrowth when the apical meristem is
removed [18]. BRs are a class of naturally-occurring
steroid phytohormones regulating essential physiological processes during plant growth and development. BR signaling interacts with light, GA and auxin
Page 2 of 21
pathways to regulate different aspects of photomorphogenesis [19, 20].
Auxin regulates numerous plant developmental and
physiological processes [21], and auxin signaling has
been well studied in paradormant buds. In general, auxin
is synthesized in the primary shoot apex, moves basipetally through the stem, and inhibits axillary bud outgrowth [22]. Basipetal movement of auxin in the stem
also affects the acropetal movement of cytokinin and
strigolactone (secondary messengers), which promotes
and inhibits bud outgrowth, respectively [23–26]. It is
thought that the involvement of ABA on strigolactone
biosynthesis could contribute to regulation of paradormancy in vegetative buds [27]. In addition, auxinregulated strigolactone depletion is a major cause of
branching after removal of the growing shoot apices
[28]. Paradormancy in leafy spurge inhibits UABs from
developing into new shoots through auxin and sugar signals generated from the actively growing aerial portion
of the plant [29–32].
Leafy spurge has been used as a model perennial to
investigate well-defined phases of dormancy in UABs
[4, 33–36]. Further, development of an EST database
[37] provided opportunities to study the transcriptome of leafy spurge UABs following paradormancy
release [38]. Early results, obtained using a 2654-element
Euphorbiaceae cDNA microarray, identified several
differentially-regulated genes. For example, genes encoding putative homologues of asparagine synthase, a
phosphate-inducible protein, and a curculin-like (mannose
binding) lectin family protein were rapidly upregulated and genes involved in flavonoid biosynthesis
were rapidly down-regulated upon loss of paradormancy. To further investigate the regulation of gene
expression during paradormancy release and initiation
of shoot growth from crown buds following aerial
stem removal, we compared the transcriptome of
paradormant and growth-induced UABs based on
RNA-seq data.
In this research, crown buds were harvested from
paradormant leafy spurge plants (0 h) and also from
plants post-decapitation of all aerial tissues (6, 24, and
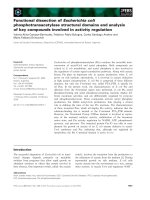
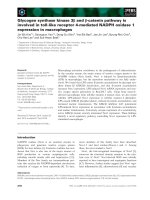
72 h). Daily growth of a crown bud after shoot removal
is shown in Fig. 1. These UABs were also used for hormone measurements and preparation of RNA samples
for RNA-seq and RT-qPCR analyses. Based on the analyses of RNA-seq, RT-qPCR, and hormone profiling
data, our results were consistent with different phytohormone signals acting in concert to direct cellular
changes involved in growth; in addition, shifts in balance among these phytohormones at different time
points and stress-related cellular responses after paradormancy release appear to be critical factors driving
transition of bud to shoot growth.
Chao et al. BMC Plant Biology (2016) 16:47
Day 0
Day 4
Day 1
Day 5
Day 2
Day 6
Day 3
Day 7
Fig. 1 Growth of a crown bud after shoot removal. The arrow (Day 0)
indicates where the shoot was excised
Results
Principal component analysis indicates 24 h as the most
active period of cellular changes during paradormancy
release
RNA-seq technology was used to identify signaling pathways and differences in transcript profiles in leafy spurge
crown buds during the transition from paradormancy to
shoot-induced growth. Of the 569,227 contigs present in
our assembly, between 220,164 (72 h, rep4) and 292,399
(24 h, rep 2) primary contigs (components) were represented among the 15 libraries (Additional file 1: Table S1).
Among all primary contigs, 388,193 (representing 98,254
genes) were present in at least one sample. However,
164,810 contigs (representing 18,414 genes) were expressed
at levels greater than 10 transcripts per million (TPM, see
Additional file 2: RNA-seq master file). From these contigs,
7855 genes had differential transcript abundance (posterior
probability of being differentially expressed (PPDE) ≥ 0.95)
Page 3 of 21
based on the EBseq program (see Methods section) of the
four bud sampling time points (0, 6, 24, and 72 h). Principal
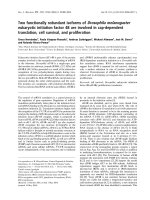
component analysis of these 7855 genes revealed similarities and differences between the physiological states (Fig. 2).
The first dimension of the analysis, the X-component, explained 68 % of the variance and clearly distinguished 24 h
growth-induced buds from other time points (0 h, 6 h, and
72 h). The Y-component explained 17 % of the variance, indicating that the physiological state of the 72 h buds was
similar to both 0 h and 6 h buds, whereas 0 h and 6 h buds
were not as similar to each other as to 72 h buds (higher Y
variance). Nevertheless, principal component analysis
clearly separated these 4 groups of buds, indicating divergent physiological states among them.
Using paradormant (0 h) buds as a baseline, statistical
analyses were performed to compare buds from various
growth-induced time points; i.e., 6 h vs. 0 h, 24 h vs. 0 h,
and 72 h vs. 0 h. Analysis indicated 3404, 6988, and
2850 genes had differential transcript abundance for the
6 h vs. 0 h, 24 h vs. 0 h, and 72 h vs. 0 h comparisons,
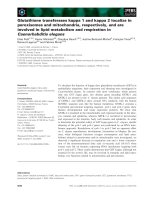
respectively. The distribution of genes associated with
transcripts that are unique and common among three
comparisons is shown in the Venn diagram (Fig. 3 and
Additional file 2: RNA-seq master file – Pattern key).
The results indicate that 217 out of 3404 genes with differential transcript abundance were unique for 6 h vs.
0 h, 3099 out of 6988 were unique for 24 h vs. 0 h, and
300 out of 2850 were unique for 72 h vs. 0 h. The 3099
unique gene set for 24 h vs. 0 h supports the results
obtained in principal component analysis (Fig. 2) that
the physiological states of 24 h growth-induced buds
were most dissimilar among 4 time points. There were
1689 genes common in transcript abundance between
6 h vs. 0 h and 24 h vs. 0 h, 1052 common between 24 h
vs. 0 h and 72 h vs. 0 h, 350 common between 72 h vs.
0 h and 6 h vs. 0 h, and 1148 common among the three
comparisons.
RT-qPCR
RT-qPCR was used to validate the transcriptomics data
obtained from RNA-seq. Fifty seven genes involved in
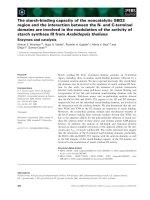
growth, hormone, light, and temperature response/regulation (Fig. 4 and Additional file 3: Table S2) were examined. The results demonstrate that transcript abundance
generated by RT-qPCR and RNA-seq was very similar
(Fig. 4, see also Additional file 3: Table S2 for numeral
values). Overall, correlation analysis between RNA-seq
and RT-qPCR expression analyses for this set of selected
genes indicated that the 6 h, 24 h and 72 h time points
had a correlation coefficient of 0.78, 0.61, and 0.80 respectively. In addition, the expression intensity appears
similar between these two systems. For example, 6 h,
24 h, and 72 h after paradormancy release, the increased
folds (based on log2) in transcript abundance of a
Chao et al. BMC Plant Biology (2016) 16:47
Page 4 of 21
Fig. 2 Principal component analysis applied to 7855 differentially-regulated genes (PPDE ≥ 0.95) based on RNA-seq analyses of underground
adventitious buds at 0, 6, 24, and 72 h after released from paradormancy by shoot removal
putative leafy spurge CHLOROPHYLL A/B-BINDING
PROTEIN (CAB) were 0.91, 2.29, and 2.63 for RT-qPCR
and 0.93, 1.63, 2.17 for RNA-seq (Fig. 4, #1), respectively. The increased abundance of CAB transcript was
among the fastest responses observed and reflected the
Fig. 3 Venn diagram showing the distribution of differentially-expressed
genes that are unique or common among three comparisons: 6 h vs.
0 h, 24 h vs. 0 h, and 72 h vs. 0 h
bud’s prompt photosynthetic response to perceiving a
growth-inducing signal. Similar observation also applies
to decreased folds in transcript abundance for a putative leafy spurge CHALCONE SYNTHASE (CHS), which
were −2.24, −1.78, and −0.64 for RT-qPCR and −1.79,
−2.22, and −0.87 for RNA-seq (Fig. 4, #46), respectively.
The differential abundance of other transcripts correlated well with the physiological status for crown buds
after paradormancy release. The abundance of a putative
ELONGATED HYPOCOTYL 5 (HY5) transcript increased between 6 and 24 h after paradormancy release
(Fig. 4, #2, #3, & #4). In Arabidopsis, HY5 is a bZIP transcription factor required for photomorphogenesis and is
regulated by crosstalk between GA and the CONSTITUTIVE PHOTOMORPHOGENESIS1 ubiquitin pathway
[39]. The transcript profile of HY5 was very similar to
that of CAB mentioned above. These results suggest that
signaling mechanisms involved in paradormancy release
may also play a role in activation of photosynthetic machinery. In accordance with this observation, the abundance of transcript with similarity to a GA receptor,
GIBBERELLIN INSENSITIVE DWARF1 (GID1), increased 6 h after paradormancy release, and reached
peak levels at 24 h time point (Fig. 4, #7). The abundance of a transcript with similarity to GA INSENSITIVE1 (GAI1) (a negative regulator of the GA signaling
pathway) decreased 24 h after paradormancy release
Chao et al. BMC Plant Biology (2016) 16:47
Page 5 of 21
Fig. 4 Heat map diagram showing changes in gene expression obtained by RT-qPCR vs. RNA-seq analysis. Each column represents a treatment
starting from paradormant control buds (0 h) to buds at 6, 24, and 72 h post-shoot removal. Fold difference in transcript abundance is designated
as log2. Red color indicates up-regulated genes and green color indicates down-regulated genes as compared to control, which was set to zero
(black). The primer pair number for RT-qPCR is shown within the parentheses
(Fig. 4, #53). In addition, abundance of transcripts with
similarity to cell division related genes, CYTOKININ OXIDASE 1 (CKX1), CKX7, and CYCLIN D3-1 (CYCD3-1),
increased 24 through 72 h after paradormancy release
(Fig. 4, #5, #6, & #10); in contrast, a transcript similar to
an ABA biosynthetic gene, 9-CIS-EPOXYCAROTENOID
DIOXYGENASE 3 (NCED 3), decreased 6 h and 72 h after
paradormancy release (Fig. 4, #52). These data indicate
that distinct cellular responses occurred during the transition from paradormancy to shoot-induced growth.
Differential abundance of hormone-related transcripts is
overrepresented
Since phytohormones play critical roles in the regulation of bud growth and development, the abundance
of hormone-related transcripts were determined using
the RNA-seq data. There were 373 transcripts annotated as hormone-related genes (genes with known
roles in synthesis, catabolism, transport, or direct
positive or negative signaling roles). Of these, 185 had
differential transcript abundance and were significantly over-represented (p = 0.001) (Table 1 and Additional file 4: Table S3). Transcripts associated with
ABA were most over-represented with a hypergeometric p-value of 0.009 (Table 1). Of the 6 transcripts
associated with negative ABA signaling (Fig. 5, #3 to
#8), three had peak abundance at 24 h and 5 had minimum abundance at 72 h after paradormancy release.
Also, a majority of the 17 transcripts associated with
positive ABA signaling (Fig. 5, #9 to #25) had the
greatest abundance at 6 h after paradormancy release,
although no obvious pattern was observed for the
Chao et al. BMC Plant Biology (2016) 16:47
Page 6 of 21
timing of minimum abundance. This observation indicated a shift in ABA levels and/or signals during these
three time points. Among the 6 putative ABA
synthesis-encoding genes (Fig. 5, #26 to #31), most
had decreased transcript abundance at 6–72 h compared to paradormant buds, whereas 4 of the 6 putative ABA transport-encoding transcripts (Fig. 5, #32 to
#37) had maximum abundance at the 6 to 24 h.
Auxin was the second most over-represented with a
hypergeometric p-value of 0.017 (Table 1). Among 13
transcripts associated with auxin catabolic process (Fig. 6,
#1 to #13), most had low abundance in paradormant
UABs (0 h time point) compared to other time points, and
4 of the 5 transcripts associated with auxin synthetic
process (Fig. 6, #37 to #41) were less abundant at the 24 h
time point compared to paradormant UABs. Although no
strong patterns were observed for transcripts associated
with positive regulation of auxin signaling, all three transcripts with similarity to auxin receptor-encoding genes
(TIR1s; Fig. 6, #23 to #25) had increased abundance at the
6 h time point after paradormancy release. Of the 11 transcripts with similarity to negative regulators (Fig. 6, #26 to
#36), 9 had their lowest abundance at 24 h after paradormancy release. No obvious patterns of abundance were
noted for the transcripts with putative similarity to
transporters.
Transcripts associated with cytokinin levels/signaling
were not significantly over-represented with a hypergeometric p-value of 0.112 (Table 1). However, it should be
noted that transcripts associated with cytokinin catabolic
processes (CKX1 & 7; Fig. 7, #1 and #2) and synthesis
(IPT3 & 5 and LOG5; Fig. 7, #18 to #20) had increased
abundance after paradormancy release. The differences between them were that transcripts associated with cytokinin synthesis were less abundant at 72 h whereas
transcripts associated with cytokinin catabolic processes
stayed abundant. It is known that cytokinin induces
Table 1 Hypergeometric distribution of over-represented
hormone-related genes
Hormone related genes Total population size Significant
p value
population size
Total number
373
185
0.001
ABA
66
37
0.009
Auxin
97
50
0.017
BR
38
19
0.085
Cytokinin
44
20
0.112
Ethylene
22
12
0.090
GA
28
12
0.151
JA
55
25
0.099
SA
23
10
0.166
total
18,415
7855
1
multiple CKXs in Arabidopsis [40]. The concurrent increased abundance of transcripts associated with both
cytokinin catabolic and synthetic processes may imply
that both are needed to maintain an optimal cytokinin concentration.
Transcripts associated with GA biosynthesis/signaling processes were not over-represented (Table 1). However, it
should be noted that transcripts with similarity to GA receptors (GID1A and GID1B) had peak abundance at 24 h after
paradormancy release (Additional file 4: Table S3;
hormone GA, #5 to #7). Among the JA-associated
transcripts that also missed the 0.05 over-representation
cutoff for significance (Table 1), 10 of the 14 transcripts associated with JA synthesis were highly abundant at 0 or 6 h
time point and their abundance gradually decreased thereafter (Additional file 4: Table S3; hormone JA, #12 to #25).
Gene set- and sub-network- enrichment analysis
We performed GSEA using the RNA-seq data to
identify metabolic processes in crown buds during the
transition from paradormancy to shoot-induced
growth based on AraCyc pathways (see Methods section). GSEA determined over-represented sets of transcripts with increased or decreased abundance for
comparisons 6 h vs. 0 h, 24 h vs. 0 h, and 72 h vs.
0 h. The GSEA results are summarized in Table 2
and the subsequent sections. Up and down regulated
gene lists (indicated by arrows) are growth-induced
(6 h, 24 h, and 72 h) compared with 0 h time point.
Pathway descriptions, genes, and additional data for
each comparison are available in Additional file 5:
Table S4. Most pathways were among either up- or
down-regulated gene lists; still, some pathways were
over-represented among both up- and down-regulated
gene lists. SNEA identified expression targets and
small molecules as central hubs for over-represented
transcripts of a given dataset. Table 3 shows expression targets and small molecules identified as central
hubs for comparisons 6 h vs. 0 h, 24 h vs. 0 h, and
72 h vs. 0 h (also see Additional file 6: Table S5).
6 h vs. 0 h: Forty five AraCyc pathways were overrepresented 6 h after paradormancy release (Table 2).
Among them, 16 pathways were up-regulated, 25 were
down-regulated, and 4 were associated with both up- and
down-regulated genes. Most of the up-regulated pathways
were biosysynthetic pathways, and were involved in JA
(13-LOX and 13-HPL pathway), beta-alanine, BR, coumarin, cutin, glucose (gluconeogenesis), leucodelphinidin,
and phenylpropanoid biosynthesis. The rest of the upregulated pathways included photorespiration, photosynthesis, and some degradation pathways such as cyanate,
galactose (galactose degradation II, III), homogalacturonan, and triacylglycerol degradation pathways. These upregulated pathways likely imply that buds detect sudden
Chao et al. BMC Plant Biology (2016) 16:47
Page 7 of 21
Fig. 5 Profile of ABA-related transcripts obtained from crown buds of leafy spurge between 0 and 72 h post-shoot removal. Fold difference in
transcript abundance is designated as log2, which is the average of 3 or 4 biological replicates. Red color indicates up-regulated genes and green
color indicates down-regulated genes as compared to 0 h control, which was set to zero (black)
physiological changes in response to shoot removal and
prepare for growth by synthesizing new hormones and cell
wall materials.
Similar to up-regulated pathways, most of the downregulated pathways were biosynthesis pathways, and they
were involved in cuticular wax, fatty acid (also include very
long chain fatty acid), flavonoid, glucosinolate (total 5
groups), hydroxyjasmonate sulfate, IAA, starch, suberin,
anthocyanin, phenylalanine, tyrosine, trehalose, triacylglycerol, and zeaxanthin biosynthesis. The rest of the downregulated pathways were involved in galactose and starch
degradation, glycolipid desaturation, methyl indole-3-acetate
interconversion, phospholipid desaturation, and sucrose and
starch metabolism II (photosynthetic tissue). The 4 pathways
associated with up- and down-regulated genes included glucosinolate biosynthesis from phenylalanine, glucosinolate
biosynthesis from tryptophan, salicylic acid (SA) biosynthesis,
and superpathway of sucrose and starch metabolism. Many
over-represented pathways at this time point (6 h) are involved in defense responses, and may have been altered due
to the wounding caused by excision of the aerial shoot.
SNEA of up-regulated genes 6 h after dormancy release
(Table 3) identified ETHYLENE INSENSITIVE4 (EIN4),
EIN2, EXORIBONUCLEASE4 (XRN4), EIN3, MYC2, CORONATINE-INSENSITIVE 1 (COI1), CIRCADIAN CLOCK
ASSOCIATED 1 (CCA1), and CONSTITUTIVE PHOTOMORPHOGENESIS 1 (COP1) as central hubs for expression targets. A notable feature with these hubs is that they
have been reported to play key roles in wounding responses [41, 42] and photomorphogenesis [43] in other
organisms. In addition, salicylate, JA, and cytokinin were
the major hubs for small molecules as judged by their
Chao et al. BMC Plant Biology (2016) 16:47
Page 8 of 21
Fig. 6 Profile of auxin-related transcripts obtained from crown buds of leafy spurge between 0 and 72 h post-shoot removal. Fold difference in
transcript abundance is designated as log2, which is the average of 3 or 4 biological replicates. Red color indicates up-regulated genes and green
color indicates down-regulated genes as compared to 0 h control, which was set to zero (black)
number of neighbors (Table 3). Small molecules provide
information about the physiological and molecular state of
buds and often bind to specific receptors to initiate signaling cascades.
SNEA of down-regulated genes 6 h after dormancy release (Table 3) identified HEAT SHOCK FACTOR (HSF),
PRODUCTION OF ANTHOCYANIN PIGMENT1 (PAP1),
ABSCISIC ACID INSENSITIVE3 (ABI3), and photoreceptors as central hubs for expression targets, and the major
hubs for small molecules were MeJA and NO. PAP1, also
called MYB75, is a regulator of the anthocyanin branch of
the phenylpropanoid pathway and secondary cell wall formation in Arabidopsis [44].
24 h vs. 0 h: Fifty five AraCyc pathways were overrepresented 24 h after paradormancy release (Table 2).
Among them, 9 pathways were up-regulated, 40 were
down-regulated pathways, and 6 were associated with
both up- and down-regulated genes. Up-regulated pathways include coumarin, IAA, and phenylpropanoid biosynthesis; leucine, oxidative ethanol, and phenylalanine
degradation; photorespiration; photosynthesis; and pyridine nucleotide cycling (plants). A notable feature among
Chao et al. BMC Plant Biology (2016) 16:47
Page 9 of 21
Fig. 7 Profile of cytokinin-related transcripts obtained from crown buds of leafy spurge between 0 and 72 h post-shoot removal. Fold difference
in transcript abundance is designated as log2, which is the average of 3 or 4 biological replicates. Red color indicates up-regulated genes and
green color indicates down-regulated genes as compared to 0 h control, which was set to zero (black)
up-regulated pathways is that IAA biosynthesis pathway
(IAA biosynthesis I) was up-regulated at this time point.
Among 40 down-regulated pathways, most of which
were involved in biosynthesis, and these were cellulose,
chlorophyll a, choline, chorismate, ethylene, flavonoid, flavonol, homogalacturonan, JA, methionine, methylquercetin,
phosphatidylcholine, plastoquinone(−9), quercetinsulphates,
starch, acetyl-CoA, choline, lysine, threonine, phenylalanine,
tyrosine, tryptophan, phosphatidylcholine, trehalose,
ubiquinone-9, UDP-D-xylose, and vitamin E biosynthesis.
The rest of down-regulated pathways included homogalacturonan degradation, starch degradation to pyruvate,
sucrose degradation to pyruvate, glycolysis I and II, methionine salvage, methyl indole-3-acetate interconversion,
phospholipases, rubisco shunt, SAM cycle, Smethylmethionine cycle, sucrose and starch metabolism,
and UDP-sugars interconversion. The large numbers of
down-regulated pathways relative to up-regulated pathways is notable. Pathways associated with up- and downregulated included Calvin cycle, gluconeogenesis, leucodelphinidin biosynthesis, photosynthesis, sucrose degradation to ethanol and lactate, and superpathway of
cytosolic glycolysis, pyruvate dehydrogenase and TCA
cycle. Most of these pathways are related to carbon and
energy use.
SNEA of up-regulated genes 24 h after paradormancy
release (Table 3) identified only one central hub, SHOOT
MERISTEMLESS (STM), for expression targets, which
may be associated with cell proliferation. The major hubs
for small molecules were JA and GA. SNEA of downregulated genes 24 h after dormancy release (Table 3)
identified E2F, E2F3, PAP1, and basic-helix-loop-helix
(bHLH) protein. The major hubs for small molecules were
MeJA, carbohydrates, and anthocyanins.
72 h vs. 0 h: Forty AraCyc pathways were overrepresented 72 h after paradormancy release (Table 2).
Among them, 13 pathways were up-regulated, 14 were
down-regulated pathways, and 13 were up- and downregulated. Most of the up-regulated pathways were biosysynthetic pathways, and were involved in chlorophyllide a,
coumarin, cutin, cysteine, glucose, trehalose, and xylan
biosynthesis. The rest of the up-regulated pathways were
photosynthesis and several degradation pathways such as
2,4,6-trinitrotoluene, homogalacturonan, and sucrose degradation. The notable feature among up-regulated pathways
is that they were involved in growth and development.
Most of the down-regulated pathways were also involved in
biosynthesis, and they were JA (13-LOX and 13-HPL pathway), cuticular wax, ethylene, flavonoid, IAA, sphingolipid,
starch, suberin, and choline biosynthesis. The rest of the
down-regulated pathways were methyl indole-3-acetate
interconversion, phospholipases, starch degradation, and
sucrose and starch metabolism. The notable feature of these
pathways is that many hormone biosynthetic pathways were
Chao et al. BMC Plant Biology (2016) 16:47
Page 10 of 21
Table 2 AraCyc pathways that are over-represented for comparisons 6 h vs. 0 h, 24 h vs. 0 h, and 72 h vs. 0 h based on Gene Set
Enrichment Analysis
AraCyc pathways
13-LOX and 13-HPL pathway
6 h vs. 0 h
24 h vs. 0 h
72 h vs. 0 h
↑
↑
2,4,6 trinitrotoluene degradation
↑
Abscisic acid glucose ester biosynthesis
↑
↓
Ajugose biosynthesis (galactinol-dependent)
↑
↓
↑
↓
Ajugose biosynthesis II (galactinol-independent)
Beta-alanine biosynthesis I
↑
Brassionosteriod biosynthesis II
↑
↑
Calvin cycle
↓
Cellulose biosynthesis
↓
Chlorophyll a biosynthesis II
↓
↑
Chlorophyllide a biosynthesis
choline biosynthesis II
↓
Chloline biosynthesis III
↓
Chorismate biosynthesis
↓
Coumarin biosynthesis (via 2-coumarate)
↑
↑
↑
↓
Cuticular wax biosynthesis
Cutin biosynthesis
↑
Cyanate degradation
↑
↓
↑
Cysteine biosynthesis
↑
Cytokinins 7-N-glucoside biosynthesis
↑
↓
Cytokinins 9-N-glucoside biosynthesis
↑
↓
Cytokinins-O-glucoside biosynthesis
↑
↓
Ethylene biosynthesis from methionine
Fatty acid biosynthesis-initial steps
↓
Flavonoid biosynthesis
↓
↓
↓
↓
↓
Flavonol biosynthesis
↓
Galactose degradation I
Galactose degradation II (III)
↓
↑
↑
Galactosylcyclitol biosynthesis
Gluconeogenesis
↑
↑
Glucosinolate biosynthesis from dihomomethionine
↓
Glucosinolate biosynthesis from hexahomome thionine
↓
↑
↓
Glucosinolate biosynthesis from tetrahomomethionine
↓
Glucosinolate biosynthesis from trihomomethionine
↓
Glucosinolate biosynthesis from tryptophan
↑
↓
↓
Glycolipid desaturation
Glycolysis I (plant cytosol)
↓
Glycolysis II (plant plastids)
↓
↓
Homogalacturonan biosynthesis
Homogalacturonan degradation
↑
↓
Glucosinolate biosynthesis from pentahomomethionine
Glucosinolate biosynthesis from phenylalanine
↓
↑
↓
↑
↓
Chao et al. BMC Plant Biology (2016) 16:47
Page 11 of 21
Table 2 AraCyc pathways that are over-represented for comparisons 6 h vs. 0 h, 24 h vs. 0 h, and 72 h vs. 0 h based on Gene Set
Enrichment Analysis (Continued)
↓
Hydroxyjasmonate sulfate biosynthesis
↑
IAA biosynthesis I
↓
IAA biosynthesis II
↓
IAA biosynthesis VII
↑
IAA degradation IV
Jasmonic acid biosynthesis
↑
↓
↑
↑
↓
Methionine biosynthesis
↓
Methionine salvage pathway
↓
↓
Methylindole-3-acetate interconversion
↓
Monolignol glucosides biosynthesis
↑
↓
↑
↓
↑
Oxidative ethanol degradation I
Pelargonidin conjugates biosynthesis
↑
Phenylalanine degradation III
↑
↑
↓
Phosphatidylcholine biosynthesis IV
↓
Phospholipases
↓
↓
Phospholipid desaturation
Photorespiration
↑
↑
Photosynthesis
↑
↑
Photosynthesis, light reaction
↑
↑
↓
↑
↑
↓
Plastoquinone-9 biosynthesis
↑
Pyridine nucleotide cycling (plants)
↑
Quercetin glucoside biosynthesis
Quercentinsulphates biosynthesis
↓
Rubisco shunt
↓
Salicylic acid biosynthesis
↓
↓
Methylquercetin biosynthesis
Phenylpropanoid biosynthesis
↑
↓
S-methylmethionine cycle
↓
↓
Sphingolipid biosynthesis (plants)
Starch biosynthesis
↓
Starch degradation
↓
Suberin biosynthesis
↓
↓
↓
↓
↑
↓
Superpathway of acetyl-CoA biosynthesis
↓
↓
Superpathway of choline biosynthesis
↑
Superpathway of cytosolic glycolysis (plants),pyruvate dehydrogenase and TCA cycle
Superpathway of lysine, threonine, and methionine biosynthesis
↓
↓
↑
Sucrose degradation to ethanol and lactate (anaerobic)
Superpathway of fatty acid biosynthesis
↓
↓
SAM cycle
Superpathway of anthocyanin biosynthesis (from cyanidin and cyanidin3-O-glucoside)
↓
↑
Leucine degradation
Leucodelphin biosynthesis
↓
↑
Kaempferol glucoside biosynthesis (Arabidopsis)
↓
↓
↓
↓
↓
Chao et al. BMC Plant Biology (2016) 16:47
Page 12 of 21
Table 2 AraCyc pathways that are over-represented for comparisons 6 h vs. 0 h, 24 h vs. 0 h, and 72 h vs. 0 h based on Gene Set
Enrichment Analysis (Continued)
↓
Superpathway of phenylalanine and tyrosine biosynthesis
↓
Superpathway of phenylalanine, tyrosine and tryptophan biosynthesis
↓
Superpathway of phosphatidylcholine biosynthesis
↓
Superpathway of plastoquinone biosynthesis
↓
Superpathway of starch degradation to pyruvate
↓
Superpathway of sucrose and starch metabolism I (non-photosynthetic tissue)
↑
↓
↓
↓
↓
Superpathway of sucrose and starch metabolism II (photosynthetic tissue)
Superpathway of sucrose degradation to pyruvate
↓
Trehalose biosynthesis
↓
↑
↓
↑
↓
Triacylglycerol biosynthesis
↑
Triacylglycerol degradation
↑
Ubiquinone-9 bipsynthesis (eukaryotic)
↓
UDP-D-xylose biosynthesis
↓
↓
↓
UDP-sugars interconversion
↓
Very long chain fatty acid biosynthesis
↓
Vitamin E biosynthesis
↑
Xylan biosynthesis
↓
Zeaxanthin biosynthesis
Up and down arrows indicate the direction of regulation in the former part of the comparison (i.e., 6 h vs. 0 h: up means up in 6 h). Genes and additional data
within each pathway for each comparison are available in Additional file 5: Table S4
down-regulated. Up- and down-regulated pathways
included many biosynthesis pathways such as ABA
glucose ester, ajugose (galactinol-dependent and
galactinol-independent), cytokinins 7-N-glucoside,
cytokinins 9-N-glucoside, cytokinins-O-glucoside,
galactosylcyclitol, kaempferol glucoside, monolignol
glucosides, pelargonidin conjugates, and quercetin
glucoside biosynthesis pathways, and two degradation
pathways that were involved in IAA and triacylglycerol
degradation. Overall, these pathways reflected that
activities for various phytohormones were altered at
this time point.
SNEA of up-regulated genes 72 h after dormancy release (Table 3) identified only EIN3 and DNA-directed
RNA polymerase central hubs for expression targets.
The major hubs for small molecules were salicylate,
cytokinin, D-glucose (Table 3). SNEA of down-regulated
genes at this time point identified EIN3, ZEITLUPE
(ZTL), ABI1, and RGA1 (Table 3). EIN3 was also identified as a central hub of transcripts with increased abundance (see above). The major hubs for small molecules
were ethylene, NaCl, and Ca2+. Overall, SNEA suggests
that hormone and light signaling were altered when
buds initiated growth.
Phytohormone levels after paradormancy release
ABA, cytokinins, auxins, and GA levels were measured in
paradormant crown buds before and after paradormancy
Table 3 Expression targets and small molecules identified as central hubs for comparisons 6 h vs. 0 h, 24 h vs. 0 h, and 72 h vs. 0 h
based on sub-network enrichment analyses
Expression targets_up
Expression
targets_down
Small molecules_up
Small molecules_down
6h
vs.
0h
EIN4, EIN2, XRN4, EIN3,
MYC2, COI1, CCA1, COP1
HSF, PAP1, ABI3,
photoreceptor
salicylate, carbohydrates, JA, cytokinin,
diuron, phytohormone, Na+, H2O, Grelutin
NO, MeJA, Cu2+, Cd2+, brassinosteroids,
chitosan
24 h
vs.
0h
STM
E2F, E2F3, PAP1, basichelix-loop- helix protein
JA, sulfur, N- Benzyladenine, H2SO4,
Grelutin, L-glutamine, gibberellin
Mitomycin, carbohydrates, EGTA,
anthocyanins, hydroxyurea, MeJA,
Paclobutrazol
72 h
vs.
0h
EIN3, DNA- directed RNA
polymerase
EIN3, ZTL, ABI1, RGA1
cytokinin, lincomycin, CO2, salicylate, NO,
Geldanamycin, tunicamycin, D- glucose
ethylene, Ca2+, H2O, NaCl, NADP+, NO, Dmannitol
Genes and additional data for each comparison are available in Additional file 6: Table S5
Chao et al. BMC Plant Biology (2016) 16:47
release (Fig. 8). Among 4 time points, ABA levels were
greatest in paradormant buds (0 h); ABA content of these
buds was 221 ng g−1 DW (dry weight). Six h after paradormancy release, ABA content dropped to 65 ng g−1 DW
and then increased to 174 ng g−1 DW between 6 and 24 h,
after which ABA content diminished again towards 72 h.
ABA metabolite dihydrophaseic acid (DPA) contents were
Page 13 of 21
relatively high in bud samples but had similar trends in
concentration as that of ABA; the greatest DPA level
(1245 ng g−1 DW) was observed at 24 h, and the least
(552 ng g−1 DW) was at 6 h. Trans-ABA (t-ABA) levels, a
product of isomerization of natural ABA under UV light,
did not show significant changes after paradormancy release (Fig. 8a).
a
b
c
Fig. 8 Profiles of ABA (a), cytokinin (b), and IAA (c) levels measured from crown buds of leafy spurge between 0 and 72 h post-shoot removal. These profiles represent the average of four biological replicates ± SE. Means labeled by the same letter are not significantly different (P < 0.1)
Chao et al. BMC Plant Biology (2016) 16:47
The levels of most biologically active free base cytokinins were too low to allow reliable measurement; only
trans-zeatin (t-Z) was detected definitively 72 h after
paradormancy release, and it was present in a small
amount (3 ng g−1 DW). However, the levels of their biosynthetic precursors, cis-zeatin riboside (c-ZR) and
trans-zeatin riboside (t-ZR), were relatively high in
crown bud samples. While the levels of c-ZR were not
significantly different due to high variations in the biological replicates of paradormant buds, t-ZR levels increased dramatically between 0 h to 72 h at 5 and
46 ng g−1 DW, respectively. Another biosynthetic precursor, isopentenyladenine riboside (iPR), did not show
significant changes after paradormancy release (Fig. 8b).
Auxins are mainly represented by biologically active
indole-3-acetic acid IAA and its conjugates with aspartic acid
N-(indole-3-yl-acetyl)-aspartic acid (IAA-Asp) [21]. Our results indicated that IAA levels were relatively high (107 ng g
−1
DW) in paradormant buds and declined almost 2-fold 6 h
after shoot removal (56 ng g−1 DW). It appeared that buds
synthesized IAA after the transition from dormancy to
growth since IAA levels increased dramatically from 24 to
72 h at 63 and 168 ng g−1 DW, respectively. IAA-Asp levels
also declined from 0 to 6 h at 18 and 7 ng g−1 DW, respectively. IAA-Asp had a constant increase towards 24 h
(65 ng g−1 DW) and 72 h (50 ng g−1 DW), at levels significantly higher than that of 0 h time point (Fig. 8c).
We also attempted to measure GA levels, and traces
of GA3, GA19, and GA24 were detected at later time
points but could not be reliably quantified (data not
shown). Nevertheless, our results suggest that GA levels
were generally low but were increasing as UABs transitioned from paradormancy to shoot-induced growth.
Discussion
This study compared phytohormone abundance and the
transcriptomes of paradormant UABs vs. shoot-induced
growth at 6, 24, and 72 h after paradormancy release
based on hormone profiling and RNA-seq analyses. The
assembled transcriptome was annotated against the nonredundant and TAIR Arabidopsis database. The expression data (in transcripts per million) were further
subjected to principal component analysis and gene setand sub-network- enrichment analysis. The results
showed that differential abundance of transcripts associated with hormone signaling, the high number of overrepresented ontologies associated with specific phytohormones or hormone processes, and the concurrent
changes in phytohormone levels are all well correlated.
Combined, these observations suggest that signals induced by the loss of the aerial shoots altered phytohormone abundance/perception and led to transcriptome
changes, which facilitated cellular changes requisite for
Page 14 of 21
paradormancy release and differentiation to shoot
growth.
ABA, IAA, and flavonoids appear to maintain
paradormancy in UABs
Hormones, particularly auxin and ABA, have long been
associated with regulating bud outgrowth following loss
of growing shoot apices [12] and contributing to paradormancy maintenance in vegetative buds [27, 45].
Thus, it was not surprising to find that these hormones
were implicated with maintenance of paradormancy in
this study and support the validity of our transcriptome
results. Relatively high levels of ABA were found in
paradormant buds (0 h, before removal of aerial shoots)
(Fig. 8a). The decrease in ABA levels after paradormancy
release seems consistent with the abundance of ABArelated transcripts. For example, a transcript associated
with ABA biosynthesis, NCED3 (Fig. 4, #52 and Fig. 5,
#31), was less abundant 6 h after paradormancy release
(Fig. 5). NCED is involved in catalyzing the rate-limiting
step in ABA biosynthesis [46]. Similar results were also
obtained for other transcripts involved in ABA biosynthesis such as ABA DEFICIENT1, 2, & 4 (ABA1, 2, & 4;
Fig. 5, #26 to #30). Although ABA biosynthesis appeared
to be decreased at the 6 h time point, as indicated by the
significant reduction of ABA and DPA (Fig. 8a), abundance
of transcripts involved in ABA catabolism (cytochrome
P450 CYP707A1 and CYP707A4) were less abundant 6 h
after paradormancy release (Fig. 5, #1 and #2). In Arabidopsis, CYP707A encodes ABA 8′-hydroxylases, which catalyze
the hydroxylation of ABA at the C-8′ to form unstable 8′hydroxy ABA molecules [47].
Abscisic Acid Responsive Elements (ABREs) are the
major cis-regulatory element for ABA-responsive gene expression, and ABRE-binding factors (ABFs) are transcription factors that regulate ABRE-dependent gene expression.
In Arabidopsis, ABF4 can be induced by dehydration, high
salinity and ABA treatment in vegetative tissues [48]. Two
putative leafy spurge ABF4 transcripts were less abundant
in crown buds of leafy spurge at the 6 h time point (Fig. 5,
#9 and #10). Because ABA is known to inhibit bud growth
[9] and some putative ABF4 transcripts were less abundant
during paradormancy release, it appears that ABA and
ABA-related signaling may play an important role in maintenance of paradormancy in UABs of leafy spurge.
Relatively high levels of IAA were also observed in paradormant buds (Fig. 8c). Higher auxin levels in paradormant
buds are consistent with the conventional view that IAA is
the key factor for paradormancy maintenance [49–51].
Still, this observation is somewhat surprising given that
auxin is generally produced more in growing shoot tips
rather than in dormant buds [52]; in addition, the
current dogma indicates that once buds are released
from paradormancy, bud outgrowth should be accompanied
Chao et al. BMC Plant Biology (2016) 16:47
by increased auxin production and export [23, 24]. High
auxin levels prior to paradormancy release might result from
low auxin export because putative auxin transporters LAX3
(Fig. 6, #44 and #45), NRT1.1 (#46) and PIN1 (#47 and #48)
all had low baseline transcript abundance at 0 h compared
to later time points. Similarly, of the 9 transcripts with differential abundance for transporters (Fig. 6. #42 to #50), only
ABCB4 (#43) and PIN5 (#49) had a significant decrease at
6–72 h compared to 0 h.
GH3 genes are auxin-inducible and encode enzymes
that catalyze IAA conjugates (inactive forms) to control
the intracellular IAA level through a homeostatic feedback regulatory loop [21]. Abundance of putative transcripts to GH3 (Fig. 6, #1 to #7) were, in general, greater
6 h after paradormancy release with the exception of #1
and #7. Thus, reduced auxin levels following paradormancy release might be due to a feedback regulation in
auxin production. Alternatively, the chosen time points
were too early to detect an expected increase in auxin
production or that basal auxin production is sufficient to
maintain the required export needed to ensure bud
outgrowth.
Perhaps a more intriguing observation is the rapid decrease in abundance of transcripts involved in the flavonoid
biosynthesis pathway after paradormancy release (Table 2).
A transcript (CHS) involved in flavonoid biosynthesis had
relatively high baseline abundance in paradormant buds
(0 h) compared to the other three time points (Fig. 4, #46).
Because flavonoids are known to inhibit auxin transport
[53], these results could suggest that increased levels of cellular flavonoids act to inhibit bud growth by impinging on
auxin transport. This hypothesis is consistent with aforementioned findings that transcripts for putative auxin transporters were less abundant in paradormant buds. These
results are also consistent with previous studies that implicated a similar response during paradormancy release [38].
Paradormancy release caused rapid alteration of
phytohormone profiles
Within 6 h after paradormancy release, a sharp drop
in ABA and IAA levels was observed (Fig. 8a and c).
This sudden physiological change did not appear to
be a stress response, since stress generally stimulates
ABA biosynthesis [10]. At the molecular level, cellular
responses were also consistent with decreased ABA
levels or signaling; for example, the down-regulation
of the zeaxanthin biosynthesis pathway (Table 2). A
transcript with similarity to an Arabidopsis ABA biosynthetic gene (ABA1) also decreased its abundance
(Fig. 4, #20 & #21). ABA1 encodes zeaxanthin epoxidase, which plays a role in the epoxidation of zeaxanthin to antheraxanthin and all-trans-violaxanthin in
the ABA biosynthetic pathway. Correlated with these
Page 15 of 21
results, SNEA identified putative ABI3 as a central
hub for expression targets of transcripts with decreased abundance (Table 3). It is important to note
that ABI3 is a transcription factor similar to maize
VP1 [54], which positively regulates ABA signaling
[55].
In contrast, the 13-LOX and 13-HPL pathway and the JA
biosynthesis pathway, in general, appeared to be upregulated at the 6 h time point (Table 2). In addition, SNEA
identified two JA-related central hubs, MYC2 and COI1, for
expression targets (Table 3) among transcripts with increased abundance. MYC2 is a versatile basic helix-loophelix (bHLH) transcription factor that, in Arabidopsis, regulates JA signaling and crosstalk with other phytohormone
signaling pathways such as ABA, SA, GA, and auxin [56].
COI1 is an F-box protein and component of the SCFCOI1
complex that targets JASMONATE-ZIM DOMAIN proteins (a negative regulator of JA signaling) for ubiquitination and proteasome degradation in other species [57], and
plays an important role in control of jasmonate-regulated
plant development and defense [58]. Because JA has been
associated with wounding responses in plants [41], the upregulation of these JA-related pathways and central hubs
could indicate JA synthesis and/or signaling was enhanced
at the 6 h time point; potentially, as part of a woundinginduced defense response.
SNEA of up-regulated genes also identified ETHYLENE
INSENSITIVE2 (EIN2), EIN3, and EIN4 as central hubs for
expression targets at 6 h (Table 3). EIN4 is a membrane receptor that binds to ethylene through its N-terminal domain. EIN2, also a membrane protein, regulates the
accumulation of a key transcription factor EIN3, which in
turn activates many downstream inducible genes in the
ethylene signaling pathway in Arabidopsis [59, 60]. Similar
to JA, ethylene has also been associated with wounding and
defense responses in plants [41]. The up-regulation of these
hubs may indicate increased levels of ethylene and/or ethylene signaling at this time point, possibly due to the excision
of the aerial plant tissues. However, it should be noted that
these same signals could be important for subsequent
downstream signaling caused by paradormancy release.
Besides the above-mentioned hormone related pathways
and genes, salicylate, JA, and cytokinin were also identified
as major hubs of small molecules. Moreover, SA and BR biosynthesis pathways and pathways related to cell wall development were over-represented at 6 h time point. The SA
pathway is often associated with defense response in plants,
and cytokinin and BR are known to regulate plant growth
and development [61]. Overall, it appears that 6 h after removal of aerial shoot tissues, UABs sensed and responded to
a variety of signals including wounding and defense, which
induced a myriad of pathways impacting hormones such as
JA, ethylene, SA, and BR; these hormones, in turn, likely
acted to stimulate growth response signals.
Chao et al. BMC Plant Biology (2016) 16:47
More recently, Mason et al. showed that redistribution
of sugar to the axillary buds following loss of the growing shoot apices was associated with initiation of bud
outgrowth in pea [62]. In addition, Kebrom and Mullet
[63] showed that leaf-derived metabolic factors such as
sucrose played critical role in sorghum tiller bud outgrowth. Their results differed greatly from the findings
in paradormant UABs of leafy spurge where sucrose appeared to inhibit bud growth. Chao et al. [32] demonstrated that both glucose and sucrose caused
suppression of UAB growth at concentrations of 30 mM.
They further determined that UABs of intact paradormant plants contained the highest level of starch (32.4 ±
0.85 mg g−1 fresh weight [fwt]) and sucrose (9.41 ±
0.11 mg g−1 fwt) compared to UABs harvested 1, 3, and
5 day after decapitation; sucrose levels were all around
5 mg g−1 fwt after shoot removal. In contrast, fructose
levels increased dramatically during bud growth, and a
3.5 and 7.6-fold increase in fructose level was observed
at day 3 and 5, respectively, after shoot removal [32].
The discrepancies in the function of sugar reported in
pea and sorghum [62, 63] and this study could be due to
differences in the physiology of these buds – axillary and
tiller buds vs. UABs and/or due to species-specific effects. Nevertheless, previous carbohydrate measurements obtained from UABs did not include a 6 h time
point, which may be needed to properly address the
interplay between hormones and carbohydrates.
The down regulation of starch biosynthesis (Table 2)
is consistent with findings that UABs of intact leafy
spurge plants contained the highest level of starch,
which decreased quickly after shoot removal [32]. Although sugar levels in the paradormant UABs of leafy
spurge generally had a negative impact on bud outgrowth, differential abundance for a large number of
putative sugar transporters was observed following
shoot removal. Indeed, of the 24 putative sugar transporters with differential abundance, 17 had increased
abundance and 10 of those had the greatest abundance 6 h after paradormancy release (Additional file 7:
Table S6). These observations imply that dynamic transporter activity could occur at this time point. Thus, we hypothesized that sugar molecules generated from starch
degradation and/or other processes were transported
across cell membranes and quickly metabolised after
shoot removal.
Transition from paradormancy to growth at 24 h may be
the result of stress responses
Both principal component analysis (Fig. 2) and Venn
diagram (Fig. 3) clearly set apart 24 h growthinduced buds from other groups. These results suggest that major cellular changes occurred 24 h after
Page 16 of 21
removal of the aerial shoot tissues. Although not obvious from the list transcripts showing differential
abundance, GSEA indicated that the IAA biosynthesis pathway (IAA biosynthesis I) was up-regulated
at this time point (Table 2). However, IAA levels
were still low at the 24 h time point compared to
paradormant buds (63 vs. 107 ng g−1 DW) (Fig. 8c).
Therefore, although the activity of IAA biosynthesis
appeared to increase at this time point, IAA levels
were not significantly increased until 72 h post paradormancy release (Fig. 8c).
The increase in IAA biosynthesis activity at 24 h may be
associated with the production of reactive oxygen species
(ROS, a stress response) since auxin has been regarded as an
intermediate to function between stress and growth responses. It is known that mild oxidative stresses mimic auxin
stimuli in somatic embryogenesis [64]. In addition, mild
stress in a whole plant generates phenotypical changes
similar to a 2,3,5-triiodobenzoic acid (TIBA, an inhibitor of
polar auxin transport)-like disturbance of auxin distribution
and enhances auxin-dependent growth cycle reactivation
[65, 66]. Based on these findings, up-regulation of IAA biosynthesis pathway may indicate an enhancement of auxindependent growth response due to shoot removal triggered
stress.
Interestingly, two transcripts similar to ABA biosynthesis genes in Arabidopsis (ABA2 and NCED3; Fig. 5,
#29 and #31) and two ABRE-binding factors (ABF4;
Fig. 5, #9 and #10) were up-regulated only at the 24 h
time point compared to the 6 and 72 h time points.
Thus, this result could reflect a latent stress response in
buds caused by paradormancy release, which may interact
with auxin signaling networks to stimulate an auxindependent growth response [65, 66]. This result correlates
well with the down-regulation of 40 over-represented AraCyc pathways and reflects that the stress-derived cellular
responses were most evident at this time point. In relation
to this observation, past experiments indicate a transient
repression of growth and cell cycle genes at 24 h after excision of the aerial portion of the plant [31], which has
been linked to reduction in sugar levels resulting from loss
of leaf tissue and probable cross-talk between sugar and
ABA signaling [32]. Our results would support these previous hypotheses.
Corroborating this notion, SNEA of transcripts with
increased abundance at 24 h after dormancy release
(Table 3) identified STM as a central hub for expression
targets. STM encodes a class I KNOTTED-like protein
that is required for shoot apical meristem (SAM) formation in Arabidopsis [67]. STM represses GA biosynthesis
[68], and the expression of STM is repressed by high GA
levels; in contrast, STM expression is induced by cytokinin, and STM promotes cytokinin biosynthesis in the
SAM [69, 70]. Thus, if the products of these transcripts
Chao et al. BMC Plant Biology (2016) 16:47
performed crucial functions in UABs of leafy spurge as in
other plant systems, the identification of STM as a hub of
transcripts with increase abundance at the 24 h time point
indicated the initiation of cell proliferation and shoot growth.
Previous studies with leafy spurge also indicated that STM
was up-regulated 8 h following excision of the aerial portion
of the plant [71]. Nevertheless, the identification of GA as a
major small molecule hub among transcripts with increased
abundance (Table 3) suggested that this notion may be involved in a complex signaling network at the SAM.
Cytokinin, auxin, and GAs are required for bud growth
72 h post shoot removal
Cellular responses observed at 72 h post decapitation generally suggested that paradormant UABs had initiated the
process of differentiating into shoots. Endogenous cytokinin
and auxin levels increased (Fig. 8b and c), and ABA levels
decreased at this time point (Fig. 8a). Several cytokinin conjugate biosynthesis pathways, cytokinins 7-N-glucoside,
cytokinins 9-N-glucoside, cytokinins-O-glucoside, were upand down-regulated (Table 2), presumably resulting in the
increase of cytokinin levels (Fig. 8b). In contrast, JA-related
pathways (13-LOX, 13-HPL and JA) and ethylene biosynthesis pathways were down regulated (Table 2). Both JA
and ethylene are generally considered to inhibit plant
growth. High levels of JA also antagonize the biosynthesis
of GA in wild tobacco (Nicotiana attenuate) [72]. Abundance of a transcript similar to an auxin biosynthesis gene,
YUCCA flavin monooxygenase 4 (YUCCA4), increased at
the 72 time point (Fig. 6, #41), which may indicate the involvement of auxin in the formation of vascular tissues
[73]. However, the down-regulation of IAA biosynthesis II
pathway was unexpected and appeared to contradict the results of increase in IAA levels (Fig. 8c). This result could be
due to re-establishment of paradormancy in the more distal
buds that were harvested or the possibility that the activity
of IAA biosynthesis was similar or lower for 72 h buds
compared to paradormant (0 h) buds. In the latter case,
IAA accumulation might be a balance between biosynthesis pathway and degradation pathway, which
were both up- and down-regulated at this time point
(Fig. 6, #1 to #13 and #37 to #41). Alternatively, IAA
biosynthesis II pathway might not be the major conduit for IAA biosynthesis in leafy spurge. Other
growth related biosynthesis pathways such as chlorophyllide a, cutin, glucose, trehalose, and xylan biosynthesis pathways were all up-regulated consistent with
the physiological status of these buds (Table 2).
SNEA identified EIN3 as a central hub for expression
targets of transcripts with both increased and decreased
abundance (Table 3). EIN3, a transcription factor, is a
positive regulator of ethylene response that regulates the
expression of its downstream genes such as ETHYLENE
RESPONSE FACTOR1 [74]. Based on this observation,
Page 17 of 21
along with the down-regulation of ethylene biosynthesis
pathway mentioned above, we postulate that ethylene
biosynthesis was negatively regulated to reduce ethylene
levels at this time point.
SNEA also identified RGA1 as a hub for expression
targets (Table 3) among transcripts with decreased abundance. RGA1 is a member of the DELLA regulatory family that represses the GA signaling pathway [75]. Down
regulation of RGA1 hub could suggest an increase in GA
levels, which is consistent with RGA1’s negative role for
GA biosynthesis. Overall, GSEA and SNEA suggested
that hormone levels were altered when buds initiated
growth, namely, an increase in cytokinin, auxin, and GA
levels and decrease in ABA, JA, and ethylene levels.
Conclusions
Our transcript and hormone profiling indicate that auxin,
ABA, and flavonoid signaling appear to be involved in
maintaining paradormancy in underground adventitious
crown buds of leafy spurge, which is consistent with previous findings in underground vegetative buds of Canada
thistle [45]. After paradormancy release by shoot removal,
the balance of different phytohormones shifted rapidly
and correlated well with differentiation of bud to shoot
growth. Six h after paradormancy release, auxin, ABA,
and flavonoid levels/signals were decreased, in conjunction with up-regulation of GA, cytokinin, JA, ethylene,
and BR levels/signals. Assuming the transcripts identified
in this study perform the same functions as they do in
other plant systems, our results suggested these phytohormone signals may regulate genes affecting cell differentiation and defense responses. Twenty four h after
paradormancy release, auxin and ABA levels/signals were
increased, in conjunction with up-regulation of GA levels/
signals. Increase in auxin and ABA levels/signals and the
down-regulation of 40 over-represented AraCyc pathways
may indicate that the stress-derived cellular responses
were most evident at this time point, which could activate
stress induced re-orientation of growth [65, 66]. Seventy
two h after paradormancy release, auxin, cytokinin, and
GA levels/signals were increased, whereas ABA, JA, and
ethylene levels/signals were decreased. These results may
suggest that UABs at this time point had recovered from
stress responses and initiated normal shoot growth processes. In addition, since ABA signaling genes are negative
regulators of photomorphogenesis [76], decrease in ABA
level/signaling could activate rapid photomorphogenesis
and in turn promote shoot growth and development.
Methods
Plant material
Leafy spurge UABs were prepared according to Doğramacı
et al. [35, 36]. Briefly, leafy spurge plants were propagated
from a uniform biotype in cone-tainers and maintained in
Chao et al. BMC Plant Biology (2016) 16:47
a greenhouse [77]. This biotype (designated as ‘1984-ND001’) was collected from a site adjacent to Hector airport,
Fargo, North Dakota in 1984 [78]. Prior to the start of
each experiment, plants were acclimated in a growth
chamber for 1 week at 27 °C, 16:8 h light:dark photoperiod. To induce UAB growth into new shoots, all
above ground shoots were excised from paradormant
plants, and UABs were maintained at 27 °C, 16:8 h
light:dark photoperiod in cone-tainers. Crown buds
were harvested 0 h, 6 h, 24 h, and 72 h after removal of
the aerial shoot tissue. Each time point had 4 replicates
(reps) and each rep used about 30 plants. Hormone profiling and RT-qPCR studies included 4 reps/time point,
a total of 16 samples; however, RNA-seq studies included only 3 reps for the control (0 h) and 4 reps for
the remainder time points (6 h, 24 h, and 72 h), a total
of 15 samples. All samples were collected around noon
to avoid diurnal variation. The plants for 6 h time point
were decapitated early in the day (6 AM), and UABs
were collected at the same time of day as the 0, 24 and
72 h time points to avoid circadian clock regulation of
gene expression.
RNA-seq library preparation, Illumina sequencing, and de
novo assembly
Total RNA extracted from crown buds using the pine tree
extraction protocol [79] was used to prepare RNA-seq libraries for Illumina Next-Generation Sequencing. Total
RNA was also used to prepare cDNA template through reverse transcription according to manufacturer’s instructions
(Invitrogen). For library preparation, poly A+ RNA was isolated, reverse transcribed, and appropriate linkers were attached for Illumina sequencing using the NEBNext Ultra
Directional RNA Library Prep Kit for Illumina (New England Biolabs Inc. Ipswich MA) according to manufacturer’s
instructions with unique primers for each of the 15 samples. The resulting samples were pooled and 100 base
paired end reads were generated on a single lane of Illumina by the Roy J. Carver Biotechnology Center, University
of IL ( Initial read
quality was assessed using the FastQC program (http://
www.bioinformatics.babraham.ac.uk/projects/fastqc/) in the
iPlant discovery environment [80]. The program SickleQuality-Base-Trimming [81] was used to trim reads for
quality and length using the parameters of a minimum
quality score of 20 and a minimum read length of 70 bases
in the iPlant discover environment. Number of raw fragments and trimmed fragments are provided in Additional file
1: Table S1. To ensure that most complete transcriptome
was assembled for use as a reference database (http://
www.ncbi.nlm.nih.gov/geo/download/?acc=GSE71317&
format=file&file=GSE71317%5FTrinity%5Fall%5FRNAseq%
2Efasta%2Egz), trimmed reads from the above samples along
with samples from several other RNA-seq studies on leafy
Page 18 of 21
spurge were combined into two files (one for each
paired end) using the Concatenate Multiple Files program and the reads were kmer normalized using the
program Trinity Normalize By K-mer Coverage [82]
in the iPlant discovery environment with the default
parameters of no more than 30 times coverage for a
given kmer. The program Trinity [83] was then used
to assemble the resulting paired end read files. This
combined assembly was annotated by BlastX [84]
against the nonredundant database with a minimum
E value cut off of 10E-5. BlastX against the TAIR10
protein sequence database was also used to identify
the most similar Arabidopsis genes with a similar E
value cutoff. This assembly was used to map fragments and quantify sequences using the RSEM program suite [85] and the embedded program suite
EBseq [86] was used to identify the probability that
any given sequence was differentially-expressed between any sample groupings (see Additional file 8:
Running RSEM for scripts displaying options used for
expression analysis programs). The annotated assembled transcriptome and expression data (in transcripts
per million) with differentially expressed genes noted
by the posterior probability of the false discovery rate
is provided in Additional file 2: RNA-seq master file.
For this manuscript, only component-based gene expression analyses were considered; however, contig-level
expression analyses were also performed (data not
shown, but are available through the Gene Expression
Omnibus; see accession information below). For all subsequent analyses, only components with more than 10
hits per million in all samples from at least one time
point were considered as expressed. It should be noted
that there are a large number of components that do not
represent open reading frames. Also, a small portion
(~7 %) may have come from non-leafy spurge RNAs
sources. However, these non-plant genes and noncoding transcripts were largely ignored by the required
minimum expression level. To create a heat map for
RNA-seq analysis, ratios of log2 transformed relative expression values for each treatment were used to compare
to 0 h treatment. Heat-maps of the RNA-seq results
were created using Eisen Lab software, Cluster and
TreeView as described by Eisen et al. [87].
RNA-seq data analysis
GeneMaths XT 2.1 software (Applied Maths Inc., Austin,
TX) was used for principal component analysis of the
normalized and trimmed dataset derived from the EBseq
output. Pathway Studio software () and AGI designations for Arabidopsis genes
were used for Gene Set Enrichment Analysis (GSEA) of
AraCyc pathways [88, 89] and for Sub-Network Enrichment Analysis (SNEA) [90]. GSEA is a statistical method
Chao et al. BMC Plant Biology (2016) 16:47
to determine if predefined sets of genes are overrepresented between treatments. The AraCyc component
of GSEA is an Arabidopsis database that houses a large set
of experimentally-supported and computationally-predicted
metabolic pathways [88] ( />class-instances?object=Pathways). SNEA generates regulatory and interacting network relationships that facilitate interpretation of experimental data and development of new
hypotheses [90] ( />SNEA identify expression targets and small molecules overrepresented in the above comparison datasets. We applied
SNEA based on published results for Arabidopsis.
Real-time quantitative PCR (RT-qPCR)
Gene expression by RT-qPCR and RNA-seq analyses were
examined using total RNA prepared from UABs as previously described above. Leafy spurge homologs of Arabidopsis genes involved in hormone, growth, light, and
temperature response/regulation were selected for analysis. Primer pairs (20–24 nucleotides) were designed
using Lasergene (DNASTAR, Inc., Madison, WI) sequence analysis software from clones annotated to genes
(Additional file 9: Table S7) based on sequences obtained
from a leafy spurge EST-database [37]. The details of
cDNA preparation and RT-qPCR parameters were described previously by Chao [91]. Briefly, the comparative
CT method was used to determine changes in target gene
expression in test samples relative to a control sample.
Fold difference in gene expression of test vs. control sample is 2-ΔΔCT. SYBR green chemistry was used to produce
fluorescent signal, and three technical replicates were used
per sample for the RT-qPCR experiments. The CT value of
each gene is the average of three technical replicates. A
previously verified leafy spurge SAND gene was used as
an internal reference [92]. The difference in transcript
abundance is designated as log2. Heat-maps of the RTqPCR results were created based on log2 values using
Eisen Lab software, Cluster and TreeView as described by
Eisen et al. [87].
Hormone measurement
Hormone measurements were performed by National Research Council of Canada (Saskatoon, SK)
on a UPLC/ESI-MS/MS utilizing a Waters ACQUITY
UPLC system. The procedure for quantification of
multiple hormones and metabolites were described
by Chiwocha et al. [93, 94]. Statistical analysis was
done with PC-SAS using the ANOVA procedure.
Means were compared with Tukey’s multiple comparison procedure or Dunnett’s t tests at P = 0.1
[95]. There were four biological replications per
time point.
Page 19 of 21
Availability of supporting data
All supporting data are included as additional files. Raw and
assembled RNA-seq data are available from the Gene Expression Omnibus under the accession number GSE71317
( />acc.cgi?acc=GSE71317).
Additional files
Additional file 1: Table S1. Number of raw fragments, number of
trimmed fragments, and contig represented in each of the 15 RNA-seq
samples. (XLSX 10 kb)
Additional file 2: RNA-seq master file. (XLSX 136875 kb)
Additional file 3: Table S2. Heat map diagram showing changes in
transcript abundance obtained by RNA-seq vs. RT-qPCR analysis.
(XLSX 37 kb)
Additional file 4: Table S3. Hormone-related genes that are significant
and differentially-expressed based on RNA-seq analysis. (XLSX 245 kb)
Additional file 5: Table S4. AraCyc pathways that are over-represented
for comparisons 6 h vs. 0 h, 24 h vs. 0 h, and 72 h vs. 0 h based on GSEA.
(XLSX 91 kb)
Additional file 6: Table S5. Central hubs for expression targets and
small molecules based on SNEA. (XLSX 24 kb)
Additional file 7: Table S6. Differentially-expressed sugar transporter
genes. (XLSX 18 kb)
Additional file 8: Running RSEM. (TXT 4 kb)
Additional file 9: Table S7. Primers used for RT-qPCR analysis.
(XLSX 38 kb)
Competing interests
The authors declare that they have no competing interests.
Authors’ contributions
WSC, MD, DPH, JVA, and MEF conceived and designed the experiments. WSC
and MD performed the experiments. WSC, MD, and DPH analyzed the data.
WSC wrote the paper. WSC, MD, DPH, JVA, and MEF revised and approved
the final manuscript.
Acknowledgement
The authors acknowledge Wayne Sargent, USDA-ARS, Fargo, ND for his technical assistance; Cheryl Huckle, USDA-ARS, Fargo, ND for growing leafy
spurge; and Dr. Mark West, USDA-ARS, Fort Collins, CO for assistance in statistical analysis. This project was supported by USDA-ARS CRIS project #306021220-029-00D.
Received: 4 September 2015 Accepted: 9 February 2016
References
1. Leitch JA, Leistritz FL, Bangsund DA. Economic effect of leafy spurge in the
Upper Great Plains: methods, models, and results. Impact Assess. 1996;14:
419–33.
2. Bangsund DA, Leistritz FL, Leitch JA. Assessing economic impacts of
biological control of weeds: the case of leafy spurge in northern Great
Plains of the United States. J Environ Manage. 1999;56:35–43.
3. Anderson JV, Horvath DP, Chao WS, Foley ME. Bud dormancy in perennial
plants: a mechanism for survival. In: Lubzens E, Cerda J, Clark M, editors.
Dormancy and resistance in harsh environments, Topics in current genetics,
vol. 21. Berlin: Springer; 2010. p. 69–90.
4. Anderson JV, Gesch RW, Jia Y, Chao WS, Horvath DP. Seasonal shifts in
dormancy status, carbohydrate metabolism, and related gene expression in
crown buds of leafy spurge. Plant Cell Environ. 2005;28:1567–78.
5. Lang GA, Early JD, Martin GC, Darnell RL. Endo-, para-, and ecodormancy:
physiological terminology and classification for dormancy research. HortSci.
1987;22:371–7.
Chao et al. BMC Plant Biology (2016) 16:47
6.
7.
8.
9.
10.
11.
12.
13.
14.
15.
16.
17.
18.
19.
20.
21.
22.
23.
24.
25.
26.
27.
28.
29.
30.
31.
32.
33.
Chao WS, Foley ME, Horvath DP, Anderson JV. Signals regulating dormancy
in vegetative buds. Int J Plant Develop Biol. 2007;1:49–56.
Doğramacı M, Horvath DP, Anderson JV. Meta-analysis identifies potential
molecular markers for endodormancy in crown buds of leafy spurge. In:
Anderson JV, editor. Advances in plant dormancy. Springer International
Publishing AG, Gewerbestrasse 11, 6330 Cham, Switzerland, 2015; p. 197–219.
Rohde A, Bhalerao RP. Plant dormancy in the perennial context. Trends
Plant Sci. 2007;12:217–23.
Ruttink T, Arend M, Morreel K, Storme V, Rombauts S, Fromm J, et al. A
molecular timetable for apical bud formation and dormancy induction in
poplar. Plant Cell. 2007;19:2370–90.
Nakashima K, Yamaguchi-Shinozaki K. ABA signaling in stress-response and
seed development. Plant Cell Rep. 2013;32:959–70.
Li C, Junttila O, Ernstsen A, Heino P, Palva ET. Photoperiodic control of
growth, cold acclimation and dormancy development in silver birch (Betula
pendula) ecotypes. Physiol Plant. 2003;117:206–12.
Cline MG, Choonseok OH. A reappraisal of the role of abscisic acid and its
interaction with auxin in apical dominance. Ann Bot. 2006;98:891–7.
Suttle JC. Involvement of ethylene in potato microtuber dormancy. Plant
Physiol. 1998;118:843–8.
Ruonala R, Rinne PLH, Baghour M, Moritz T, Tuominen H, Kangasjärvi J.
Transitions in the functioning of the shoot apical meristem in birch (Betula
pendula) involve ethylene. Plant J. 2006;46:628–40.
Korableva NP, Platonova TA, Dogonadze MZ, Evsunina AS. Brassinolide
effect on growth of apical meristems, ethylene production, and abscisic
acid content in potato tubers. Biol Plantarum. 2002;45:39–43.
Fleet CM, Sun TP. A DELLAcate balance: the role of gibberellin in plant
morphogenesis. Curr Opin Plant Biol. 2005;8:77–85.
Müller B, Sheen J. Advances in Cytokinin Signaling. Science. 2007;318:68–9.
Leyser O. Regulation of shoot branching by auxin. Trends Plant Sci.
2003;8:541–5.
Gruszka D. The brassinosteroid signaling pathway-new key players and
interconnections with other signaling networks crucial for plant
development and stress tolerance. Int J Mol Sci. 2013;14:8740–74.
Wang ZY, Bai MY, Oh E, Zhu JY. Brassinosteroid signaling network and
regulation of photomorphogenesis. Annu Rev Genet. 2012;46:701–24.
Ludwig-Müller J. Auxin conjugates: their role for plant development and in
the evolution of land plants. J Exp Bot. 2011;62:1757–73.
Thimann K, Skoog F. Studies on the growth hormone of plants iii: the
inhibitory action of the growth substance on bud development. Proc Natl
Acad Sci U S A. 1933;19:714–6.
Bennett T, Sieberer T, Willett B, Booker J, Luschnig C, Leyser O. The
Arabidopsis MAX pathway controls shoot branching by regulating auxin
transport. Curr Biol. 2006;16:553–63.
Beveridge CA. Axillary bud outgrowth: sending a message. Curr Opin Plant
Biol. 2006;9:35–40.
Gomez-Roldan V, Fermas S, Brewer PB, et al. Strigolactone inhibition of
shoot branching. Nature. 2008;455:189–94.
Umehara M, Hanada A, Yoshida S, et al. Inhibition of shoot branching by
new terpenoid plant hormones. Nature. 2008;455:195–200.
López-Ráez JA, Kohlen W, Charnikhova T, Mulder P, Undas AK, Sergeant
MJ, et al. Does abscisic acid affect strigolactone biosynthesis? New
Phytol. 2010;187:343–54.
Brewer PB, Dun EA, Ferguson BJ, Rameau C, Beveridge CA. Strigolactone
acts downstream of auxin to regulate bud outgrowth in pea and
Arabidopsis. Plant Physiol. 2009;150:482–93.
Horvath DP. The role of specific plant organs and polar auxin transport in
correlative inhibition of leafy spurge (Euphorbia esula) root buds. Can J Bot.
1998;76:1227–31.
Horvath DP. Role of mature leaves in inhibition of root bud growth in
Euphorbia esula L. Weed Sci. 1999;47:544–50.
Horvath DP, Chao WS, Anderson JV. Molecular analysis of signals controlling
dormancy and growth in underground adventitious buds of leafy spurge.
Plant Physiol. 2002;128:1439–46.
Chao WS, Serpe MD, Anderson JV, Gesch RW, Horvath DP. Sugars,
hormones, and environment affect the dormancy status in
underground adventitious buds of leafy spurge (Euphorbia esula L.).
Weed Sci. 2006;54:59–68.
Chao WS, Horvath DP, Anderson JV, Foley ME. Potential model weeds to
study genomics, ecology, and physiology in the 21st century. Weed Sci.
2005;53:929–37.
Page 20 of 21
34. Horvath DP, Chao WS, Suttle JC, Thimmapuram J, Anderson JV.
Transcriptome analysis identifies novel responses and potential regulatory
genes involved in seasonal dormancy transitions of leafy spurge (Euphorbia
esula L.). BMC Genomics. 2008;9:536.
35. Doğramacı M, Horvath DP, Chao WS, Foley ME, Christoffers MJ, Anderson JV. Low
temperatures impact dormancy status, flowering competence, and transcript
profiles in crown buds of leafy spurge. Plant Mol Biol. 2010;73:207–26.
36. Doğramacı M, Foley ME, Chao WS, Christoffers MJ, Anderson JV. Induction
of endodormancy in crown buds of leafy spurge (Euphorbia esula L.)
implicates a role for ethylene and cross-talk between photoperiod and
temperature. Plant Mol Biol. 2013;81:577–93.
37. Anderson JV, Horvath DP, Chao WS, Foley ME, Hernandez AG,
Thimmapuram J, et al. Characterization of an EST database for the perennial
weed leafy spurge: an important resource for weed biology research. Weed
Sci. 2007;55:193–203.
38. Horvath DP, Soto-Suárez M, Chao WS, Jia Y, Anderson JV. Transcriptome
analysis of paradormancy release in root buds of leafy spurge (Euphorbia
esula). Weed Sci. 2005;53:795–801.
39. Alabadí D, Blázquez MA. Molecular interactions between light and hormone
signaling to control plant growth. Plant Mol Biol. 2009;69:409–17.
40. Werner T, Köllmer I, Bartrina I, Holst K, Schmülling T. New insights into the
biology of cytokinin degradation. Plant Biol (Stuttg). 2006;8:371–81.
41. León J, Rojo E, Sánchez-Serrano JJ. Wound signaling in plants. J Exp Bot.
2001;52:1–9.
42. Wang KLC, Li H, Ecker JR. Ethylene biosynthesis and signaling networks.
Plant Cell. 2002;14:S131–51.
43. Wu SH. Gene expression regulation in photomorphogenesis from the
perspective of the central dogma. Annu Rev Plant Biol. 2014;65:311–33.
44. Bhargava A, Mansfield SD, Hall HC, Douglas CJ, Ellis BE. MYB75 functions in
regulation of secondary cell wall formation in the Arabidopsis inflorescence
stem. Plant Physiol. 2010;154:1428–38.
45. Anderson JV, Doğramacı M, Horvath DP, Foley ME, Chao WS, Suttle JC, et al.
Auxin and ABA act as central regulators of developmental networks
associated with paradormancy in Canada thistle (Cirsium arvense). Funct
Integr Genomics. 2012;12:515–31.
46. Tan BC, Schwartz SH, Zeevaart JAD, McCarty DR. Genetic control of abscisic
acid biosynthesis in maize. Proc Natl Acad Sci U S A. 1997;94:12235–40.
47. Danquah A, de Zelicourt A, Colcombet J, Hirt H. The role of ABA and MAPK
signaling pathways in plant abiotic stress responses. Biotechnol Adv. 2014;
32:40–52.
48. Fujita Y, Fujita M, Satoh R, Maruyama K, Parvez MM, Seki M, et al. AREB1 is a
transcription activator of novel ABRE-dependent ABA signaling that enhances
drought stress tolerance in Arabidopsis. Plant Cell. 2005;17:3470–88.
49. Cline MG. Concepts and terminology of apical dominance. Amer J Bot.
1997;84:1064–9.
50. Shimizu-Sato S, Mori H. Control in outgrowth and dormancy in axillary
buds. Plant Physiol. 2001;127:1405–13.
51. Dun EA, Ferguson BJ, Beveridge CA. Apical dominance and shoot
branching. Divergent opinions or divergent mechanisms? Plant Physiol.
2006;142:812–9.
52. Hillman JR, Math VB, Medlow GC. Apical dominance and levels of indole
acetic acid in Phaseolus lateral buds. Planta. 1977;137:191–3.
53. Brown DE, Rashotte AM, Murphy AS, Tague BW, Peer WA, Taiz L, et al.
Flavonoids act as negative regulators of auxin transport in vivo in
Arabidopsis thaliana. Plant Physiol. 2001;126:524–35.
54. Giraudat J, Hauge BM, Valon C, Smalle J, Parcy F, Goodman HM.
Isolation of the Arabidopsis ABI3 gene by positional cloning. Plant Cell.
1992;4:1251–61.
55. Brady SM, Sarkar SF, Bonetta D, McCourt P. The ABSCISIC ACID INSENSITIVE 3
(ABI3) gene is modulated by farnesylation and is involved in auxin signaling
and lateral root development in Arabidopsis. Plant J. 2003;34:67–75.
56. Kazan K, Manners JM. MYC2: the master in action. Mol Plant. 2013;6:686–703.
57. Pauwels L, Goossens A. The JAZ proteins: a crucial interface in the
jasmonate signaling cascade. Plant Cell. 2011;23:3089–100.
58. Yan J, Li H, Li S, Yao R, Deng H, Xie Q, et al. The Arabidopsis F-box protein
CORONATINE INSENSITIVE1 is stabilized by SCFCOI1 and degraded via the
26S proteasome pathway. Plant Cell. 2013;25:486–98.
59. Kendrick MD, Chang C. Ethylene signaling: new levels of complexity and
regulation. Curr Opin Plant Biol. 2008;11:479–85.
60. Yoo SD, Cho Y, Sheen J. Emerging connections in the ethylene signaling
network. Trends Plant Sci. 2009;14:270–9.
Chao et al. BMC Plant Biology (2016) 16:47
61. Zhu JY, Sae-Seaw J, Wang ZY. Brassinosteroid signalling. Development.
2013;140:1615–20.
62. Mason MG, Ross JJ, Babst BA, Wienclaw BN, Beveridge CA. Sugar demand,
not auxin, is the initial regulator of apical dominance. Proc Natl Acad Sci U
S A. 2014;111:6092–7.
63. Kebrom TH, Mullet JE. Photosynthetic leaf area modulates tiller bud
outgrowth in sorghum. Plant Cell Environ. 2015;38:1471–8.
64. Pasternak TP, Prinsen E, Ayaydin F, Miskolczi P, Potters G, Asard H, et al. The
role of auxin, pH, and stress in the activation of embryogenic cell division in
leaf protoplast-derived cells of alfalfa. Plant Physiol. 2002;129:1807–19.
65. Pasternak T, Potters G, Caubergs R, Jansen MAK: Complementary
interactions between oxidative stress and auxins control plant growth
responses at plant, organ and cellular level. J Exp Bot. 2005a;56:1991–2001
66. Pasternak T, Rudas V, Potters G, Jansen MAK. Morphogenic effects of abiotic
stress: reorientation of growth in Arabidopsis thaliana seedlings. Environ Exp
Bot. 2005b;53:299–314
67. Long JA, Moan EI, Medford JI, Barton MK. A member of the KNOTTED class
of homeodomain proteins encoded by the STM gene of Arabidopsis. Nature.
1996;379:66–9.
68. Hay A, Kaur H, Phillips A, Hedden P, Hake S, Tsiantis M. The gibberellin
pathway mediates KNOTTED1-type homeobox function in plants with
different body plans. Curr Biol. 2002;12:1557–65.
69. Jasinski S, Piazza P, Craft J, Hay A, Woolley L, Rieu I, et al. KNOX action in
Arabidopsis is mediated by coordinate regulation of cytokinin and
gibberellin activities. Curr Biol. 2005;15:1560–5.
70. Yanai O, Shani E, Dolezal K, Tarkowski P, Sablowski R, Sandberg G, et al.
Arabidopsis KNOXI proteins activate cytokinin biosynthesis. Curr Biol.
2005;15:1566–71.
71. Varanasi VK, Chao WS, Anderson JV, Horvath DP. Differential expression of
two different EeSTM genes of leafy spurge (Euphorbia esula) and rootdirected expression from EeSTM promoter in leafy spurge and Arabidopsis.
Agrotechnology. 2012;1:1–6.
72. Heinrich M, Hettenhausen C, Lange T, Wünsche H, Fang J, Baldwin IT, et al.
High levels of jasmonic acid antagonize the biosynthesis of gibberellins and
inhibit the growth of Nicotiana attenuata stems. Plant J. 2013;73:591–606.
73. Cheng YF, Dai XH, Zhao YD. Auxin biosynthesis by the YUCCA flavin
monooxygenases controls the formation of floral organs and vascular
tissues in Arabidopsis. Genes Dev. 2006;20:1790–9.
74. Guo H, Ecker JR. The ethylene signaling pathway: new insights. Curr Opin
Plant Biol. 2004;7:40–9.
75. Silverstone AL, Ciampaglio CN, Sun T. The Arabidopsis RGA gene encodes a
transcriptional regulator repressing the gibberellin signal transduction
pathway. Plant Cell. 1998;10:155–69.
76. Brocard-Gifford IM, Lynch TJ, Finkelstein RR. Regulatory networks in seeds
integrating developmental, abscisic acid, sugar, and light signaling. Plant
Physiol. 2003;131:78–92.
77. Anderson JV, Davis DG. Abiotic stress alters transcript profiles and activity of
glutathione S-transferase, glutathione peroxidase, and glutathione reductase
in Euphorbia esula. Physiol Plant. 2004;120:421–33.
78. Lamoureux GL, Rusness DG. Quinclorac absorption, translocation,
metabolism, and toxicity in leafy spurge (Euphorbia eslua). Pestic Biochem
Physiol. 1995;53:210–26.
79. Chang S, Puryear J, Cairney J. A simple and efficient method for isolating
RNA from pine trees. Plant Mol Biol Rep. 1993;11:113–6.
80. Oliver SL, Lenards AJ, Barthelson RA, Merchant N, McKay SJ. Using the iPlant
collaborative discovery environment. Curr Protoc Bioinformatics. 2013;1:22.
81. Joshi NA, Fass JN. Sickle: A sliding-window, adaptive, quality-based
trimming tool for FastQ files (Version 1.33) [Software]. 2011, available at
/>82. Grabherr MG, Haas BJ, Yassour M, Levin JZ, Thompson DA, Amit I, et al. Fulllength transcriptome assembly from RNA-Seq data without a reference
genome. Nat Biotechnol. 2011;29:644–52.
83. Robertson G, Schein J, Chiu R, Corbett R, Field M, Jackman SD, et al. De
novo assembly and analysis of RNA-seq data. Nat Methods. 2011;7:909–12.
84. McGinnis S, Madden TL. BLAST: at the core of a powerful and diverse set of
sequence analysis tools. Nucleic Acids Res. 2004;32(Web Server issue):W20–
5.
85. Li B, Dewey CN. RSEM: accurate transcript quantification from RNA-Seq data
with or without a reference genome. BMC Bioinformatics. 2011;12:323.
86. Leng N, Dawson J, Thomson J, Ruotti V, Rissman A, Smits B, et al. EBSeq: an
empirical bayes hierarchical model for inference in RNA-seq experiments.
Page 21 of 21
87.
88.
89.
90.
91.
92.
93.
94.
95.
University of Wisconsin: Tech Rep 226, Department of Biostatistics and
Medical Informatics; 2013.
Eisen MB, Spellman PT, Brown PO, Botstein D. Cluster analysis and display of
genome-wide expression patterns. Proc Natl Acad Sci U S A. 1998;95:14863–8.
Mueller LA, Zhang P, Rhee SY. AraCyc: a biochemical pathway database for
Arabidopsis. Plant Physiol. 2003;132:453–60.
Subramanian A, Tamayo P, Mootha VK. Gene set enrichment analysis: a
knowledge-based approach for interpreting genome-wide expression
profiles. Proc Natl Acad Sci U S A. 2005;102:15545–50.
Yuryev A, Mulyukov Z, Kotelnikova E, Maslov S, Egorov S, Nikitin A, et al.
Automatic pathway building in biological association networks. BMC
Bioinformatics. 2006;7:1–13.
Chao WS. Real-time PCR as a tool to study weed biology. Weed Sci.
2008;56:290–6.
Chao WS, Doğramacı M, Foley ME, Horvath DP, Anderson JV. Selection and
validation of endogenous reference genes for qRT-PCR analysis in leafy
spurge (Euphorbia esula). PLoS One. 2012;7:e42839.
Chiwocha SDS, Abrams SR, Ambrose SJ, Cutler AJ, Loewen M, Ross ARS,
et al. A method for profiling classes of plant hormones and their
metabolites using liquid chromatography-electrospray ionization tandem
mass spectrometry: analysis of hormone regulation of thermodormancy of
lettuce (Lactuca sativa L.) seeds. Plant J. 2003;3:405–17.
Chiwocha SDS, Cutler AJ, Abrams SR, Ambrose SJ, Yang J, Ross ARS, et al.
The etr1-2 mutation in Arabidopsis thaliana affects the abscisic acid, auxin,
cytokinin and gibberellin metabolic pathways during maintenance of seed
dormancy, moist-chilling and germination. Plant J. 2005;42:35–48.
[SAS] Statistical Analysis Systems. SAS/STAT User’s Guide, Volumes 1 and 2,
Version 6. 4th ed. Cary: Statistical Analysis Systems Institute; 1989.
Submit your next manuscript to BioMed Central
and we will help you at every step:
• We accept pre-submission inquiries
• Our selector tool helps you to find the most relevant journal
• We provide round the clock customer support
• Convenient online submission
• Thorough peer review
• Inclusion in PubMed and all major indexing services
• Maximum visibility for your research
Submit your manuscript at
www.biomedcentral.com/submit