Live-cell fluorescence imaging to investigate the dynamics of plant cell death during infection by the rice blast fungus Magnaporthe oryzae
Bạn đang xem bản rút gọn của tài liệu. Xem và tải ngay bản đầy đủ của tài liệu tại đây (2.09 MB, 8 trang )
Jones et al. BMC Plant Biology (2016) 16:69
DOI 10.1186/s12870-016-0756-x
METHODOLOGY ARTICLE
Open Access
Live-cell fluorescence imaging to
investigate the dynamics of plant cell
death during infection by the rice blast
fungus Magnaporthe oryzae
Kiersun Jones, Dong Won Kim, Jean S. Park and Chang Hyun Khang*
Abstract
Background: Plant cell death plays important roles during plant-pathogen interactions. To study pathogen-induced
cell death, there is a need for cytological tools that allow determining not only host cell viability, but also cellular
events leading to cell death with visualization of pathogen development. Here we describe a live cell imaging method
to provide insights into the dynamics of cell death in rice (Oryza sativa). This method uses live-cell confocal microscopy
of rice sheath cells mechanically damaged or invaded by fluorescently-tagged Magnaporthe oryzae together with
fluorescent dyes fluorescein diacetate (FDA) and propidium iodide (PI). FDA stains the cytoplasm of live cells
exclusively, thus also visualizing the vacuole, whereas PI stains nuclei of dead cells.
Results: We first demonstrated that confocal microscopy of rice leaf sheaths stained with FDA and PI discriminated
between live cells and mechanically-killed cells. FDA-derived fluorescein was confined to the cytoplasm of live cells,
indicating the intact vacuolar and plasma membranes. We also observed previously unreported fluorescein patterns in
mechanically damaged cells. These patterns include: (1) homogeneous distribution of fluorescein in the increased area
of the cytoplasm due to the shrunken vacuole; (2) the increase of the fluorescein intensity; and (3) containment of the
brighter fluorescein signal only in affected cells likely due to closure of plasmodesmata. We refer to these as novel
fluorescein patterns in this study. Simultaneous imaging of fluorescently-tagged M. oryzae (red) and FDA staining
(green) in rice cells revealed characteristic features of the hemibiotrophic interaction. That is, newly invaded cells are
alive but subsequently become dead when the fungus spreads into neighbor cells, and biotrophic interfacial complexes
are associated with the host cytoplasm. This also revealed novel fluorescein patterns in invaded cells. Time-lapse imaging
suggested that the FDA staining pattern in the infected host cell progressed from typical cytoplasmic localization (live
cell with the intact vacuole), to novel patterns (dying cell with closed plasmodesmata with the shrunken or ruptured
vacuole), to lack of fluorescence (dead cell).
Conclusion: We have developed a method to visualize cellular events leading to host cell death during rice blast
disease. This method can be used to compare and contrast host cell death associated with disease resistance and
susceptibility in rice-M. oryzae and other host-pathogen interactions.
Keywords: Biotrophic interfacial complex, Confocal microscopy, Fluorescein diacetate, Hemibiotrophy, Host-pathogen
interactions, Oryza sativa, Plasmodesmata, Programmed cell death, Propidium iodide, Vacuole
* Correspondence:
Department of Plant Biology, University of Georgia, Athens 30602, USA
© 2016 Jones et al. Open Access This article is distributed under the terms of the Creative Commons Attribution 4.0
International License ( which permits unrestricted use, distribution, and
reproduction in any medium, provided you give appropriate credit to the original author(s) and the source, provide a link to
the Creative Commons license, and indicate if changes were made. The Creative Commons Public Domain Dedication waiver
( applies to the data made available in this article, unless otherwise stated.
Jones et al. BMC Plant Biology (2016) 16:69
Background
Plants are challenged by various pathogens, and plant cell
death can be associated with disease resistance and susceptibility [1–4]. Hypersensitive cell death is a well-described
resistance-associated cell death that occurs rapidly at the
infection site and restricts the growth of certain pathogens
[2, 4–8]. This cell death involves regulated processes leading to characteristic morphology of cell death, known as
programmed cell death (PCD), which differs from accidental destruction of cellular integrity [2, 4, 8–10].
To study cell death in plant-pathogen interactions,
several cytological methods have been commonly used
in assessing host cell viability during infection. A dye exclusion method uses certain dyes, such as tryphan blue
and SYTOX, that are excluded from the plasma membrane of live cells but stain internal components of dead
cells [1, 11]. Another method is a sucrose-induced plasmolysis, in which live cells exhibit plasma membrane
pulled away from the cell wall in the presence of a
hypertonic solution such as 0.5 M sucrose [12, 13].
These methods are useful to determine whether host cell
viability is correlated with promoting or restricting the
growth of pathogens and also to define the lifestyle of
pathogens such as biotrophy (acquiring nutrients from
live host cells), necrotrophy (acquiring nutrients from
dead host cells), or hemibiotrophy (acquiring nutrients
from initially live host cells but later from dead host
cells) [14]. However, these methods do not provide cytological details on the processes that precede cell death.
Increasing evidence suggests that processes leading to
host cell death contribute to disease resistance or susceptibility depending on the lifestyle of pathogens and that the
vacuole is a key organelle in these processes [4, 15–18].
Therefore, to study pathogen-associated plant PCD, there
is a need for a cytological tool that allows not only the
determination of the host cell viability but also the
characterization of cellular dynamics leading to cell death
in the context of pathogen development.
Visualization of a cell with fluorescent compounds is a
useful tool for the analysis of cellular architecture and
viability. FDA is a fluorogenic ester compound that
passes through the plasma membrane and is hydrolyzed
by intracellular esterases to produce a negatively charged
membrane-impermeable fluorescein with green fluorescence [19–21] (Fig. 1a). FDA, therefore, can serve as a
positive test assay for viable cells that are metabolically
active [21]. In addition, FDA staining can also visualize
vacuoles because negatively charged fluorescein selectively accumulates in the cytoplasm but is excluded from
the vacuole [22]. Several studies have utilized FDA to
visualize vacuoles such as in epidermal cells of Pisum
sativum [23], trichomes of Arabidopsis thaliana [24] and
guard cells of Vicia faba [25], but there is no report of
FDA-based visualization of the vacuole dynamics in
Page 2 of 8
response to pathogens. While FDA stains the cytoplasm
and visualizes vacuoles of viable cells, PI stains the
nuclei of dead cells [26]. PI passes through damaged cell
membranes and intercalates with DNA to exhibit bright
red fluorescence (Fig. 1a). Since the dye is excluded by
intact cell membranes, PI is an effective stain to identify
dead cells. In addition, PI stains plant cell walls regardless of cell viability.
Rice blast is an economically important disease of rice
caused by the blast fungus Magnaporthe oryzae. On the
rice leaf surface, the fungus produces a specialized penetration cell called the appressorium to mechanically
breach into an epidermal rice cell [27]. Cytological studies have documented hemibiotrophic fungal invasion
and rice cell responses based on live-cell imaging of optically clear leaf sheaths of susceptible rice [12, 13, 18].
The fungus produces invasive hyphae (IH) that fill the
first-invaded cells and then spread into neighbor cells.
The initial invasion of the first cell and successive invasion of neighbor cells are biotrophic because invaded
cells retain the ability to plasmolyze in response to a
hypertonic solution. During the biotrophic invasion, IH
are associated with biotrophic interfacial complexes
(BICs) that are hypothesized to deliver effector proteins
into the host cytoplasm across the extra-invasive hyphal
membrane (EIHM) [28]. The effector proteins that reach
the invaded cell’s cytoplasm move into adjoining uninvaded host cells, suggesting that invaded cells remain in
symplastic continuity with surrounding cells and that
these surrounding cells are prepared for the subsequent
invasion [28]. The invaded cells appear to have lost viability by the time when the IH move into neighbor cells.
It has been suggested that host vacuole maintenance is
important for successful invasion by M. oryzae [18].
Here we describe a live cell imaging method to provide
insights into the dynamics of cell death using live-cell
confocal microscopy of rice sheath cells mechanically
damaged or invaded by fluorescently-tagged M. oryzae
together with FDA and PI. Using this method, we have
demonstrated that initially invaded rice cells are viable
but lose viability when the fungus moves into adjacent
cells. In addition, this method has revealed unexpected
changes of FDA staining patterns in both wound- and
pathogen-induced death of rice cells. This allows us to
hypothesize the sequence of cytological events leading to
plant cell death during the colonization of susceptible
rice cells by M. oryzae.
Results and discussion
Dual staining of rice cells with FDA and PI
To determine FDA staining patterns in rice cells, we used
rice sheaths trimmed by hand [12] and FDA working solution (2 μg/ml, 0.2% acetone) as the mounting agent.
Confocal microscopy of FDA-stained sheaths revealed
Jones et al. BMC Plant Biology (2016) 16:69
Page 3 of 8
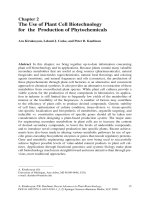
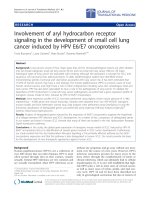
Fig. 1 FDA and PI staining of plant cells. a Diagrams showing fluorescein diacetate (FDA) and propidium iodide (PI) staining of plant cells. Top:
Non-fluorescent FDA molecules pass through the intact plasma membrane and are hydrolyzed by intracellular esterases to produce fluorescein.
The membrane-impermeable fluorescein accumulates in the cytoplasm and exhibits green fluorescence. Bottom: In a non-viable cell with a disrupted
plasma membrane, PI enters the cell and intercalates with DNA to form a bright red fluorescent complex in a nucleus. PI also stains the cell wall in
both live and dead cells. b Single plane confocal images of rice sheath epidermal cells (top) and immediately underlying mesophyll cells (bottom)
stained with both FDA (green) and PI (red). Bar = 20 μm. c Time-course average pixel intensity of FDA-stained rice sheath epidermal cells. Blue line is
an average ± SD of intensity measurements of defined regions of cytoplasmic fluorescence (n = 6 at each time point). Fluorescein intensity peaked on
average at 15 min after staining and then steadily declined
bright green fluorescence adjacent to cell walls, associated
with nuclei, and as thin strands of fluorescence in epidermal cells and underlying mesophyll cells (Fig. 1b). These
patterns are consistent with fluorescein localized in the
cytoplasm and nucleoplasm of viable plant cells that contain a large central vacuole, resulting in the thin layer of
the cytoplasm adjacent to cell walls and cytoplasmic
strands traversing the vacuole [19, 23, 29]. Since nonfluorescent FDA is converted by intracellular esterases into
fluorescein analogs exhibiting green fluorescence (Fig. 1a)
[20, 21], the bright fluorescent staining in our handtrimmed sheath strip confirms that the cells in the epidermal layer and one or two layers of mesophyll cells
remained viable and metabolically active.
As a counter stain to FDA, we also stained excised rice
sheaths with PI (10 μg/ml). To ensure there was no
overlap in fluorescence detection between FDA and PI,
we first performed individual staining with each dye and
imaged with detection configured for both. FDA staining
alone produced no detectible red fluorescence, while PI
Jones et al. BMC Plant Biology (2016) 16:69
staining alone produced no detectible green fluorescence
(data not shown). This indicated that green fluorescence
was specific to fluorescein, red fluorescence was specific
to PI, and autofluorescence was not being collected in
either channel. Upon dual FDA/PI staining, cytoplasmic
fluorescein was observed in both epidermal and immediately underlying mesophyll cells, and PI fluorescence
was observed in cell walls but not in nuclei (n > 300)
(Fig. 1b). Lack of PI staining in nuclei indicated that the
top two cell layers were viable in our hand-trimmed
sheaths, consistent with the FDA straining result. Viability
of rice cells has been routinely determined by a sucroseinduced plasmolysis assay, which is marked by the retraction of the plasma membrane from the cell wall in viable
cells [12, 13]. To ensure that rice cells displaying cytoplasmic fluorescein and lack of PI staining in nuclei were consistent with the plasmolysis-based assay, we treated rice
sheaths with 0.5 M sucrose after dual staining with FDA/
PI. All cells, exhibiting both cytoplasmic fluorescein and
nuclei absent of PI, plasmolyzed within 10 min of the sucrose treatment (n > 150) (Fig. 2a), consistently confirming
the viable rice cells.
Kinetics of FDA staining
To determine the rate at which fluorescence developed
after FDA staining and the duration for which it was detectible, excised sheaths were mounted in FDA working
solution and analyzed by time-course confocal microscopy. The intensity of fluorescein within selected cytoplasmic regions was tracked in order to compare fluorescence
intensity over time. On average, intensity peaked at 15
min and then slowly declined (Fig. 1c). Although the intensity of fluorescein reduced to approximately one half of
peak intensity after 90 min, it was still detectable for many
hours after staining by adjusting confocal settings to increase fluorescence detection sensitivity (data not shown).
The rapid accumulation and persistence of fluorescein in
the rice cytoplasm makes FDA a convenient dye to handle
and use for live-cell fluorescence microscopy.
Novel fluorescein patterns in mechanically wounded rice
cells
To determine how fluorescein and PI patterns would
change in response to wounding, we used a razor blade
to introduce nicks in a FDA/PI-stained sheath. Addition
of 0.5 M sucrose caused the protoplast to pull away from
the cell wall in fluorescein-stained viable cells (Fig. 2b).
Most of the directly damaged cells completely lacked
fluorescein, and nuclei of these cells were stained with
PI (n > 100), indicating the loss of the viability (Fig. 2b).
Occasionally, membrane-bound spherical compartments
containing fluorescein were observed in directly damaged cells (n = 8) (Fig. 2b). Unexpectedly, we also observed intriguing fluorescein patterns in cells abutting
Page 4 of 8
directly damaged cells (n = 15) (Fig. 2b). These patterns
include: (1) homogeneous distribution of fluorescein
throughout the increased area of the cytoplasm with the
concomitantly decreased vacuole; (2) the increase of the
fluorescein intensity likely due to hydrolysis of more
FDA by increased esterase activity or alternatively nonbiological hydrolysis of FDA that can occur at low pH
[20]; and (3) containment of the brighter fluorescein
only in an affected cell likely due to closure of plasmodesmata. We refer to these patterns as novel fluorescein
patterns in this study because they differed from typical
cytoplasmic fluorescein observed in viable epidermal
cells with a large central vacuole (Fig. 1b and 2a) and
from patterns described in previous reports [23, 24, 29,
30]. Using FM4-64 that stains both the plasma membrane and the vacuolar membrane [31], we confirmed
that fluorescein exhibiting a novel pattern was excluded
from the vacuole (n > 200) (Fig. 2c).
Cells that displayed a novel fluorescein pattern often
contained a PI-stained nucleus and failed to plasmolyze
(n = 22) (Fig. 2b). Positive staining of both cytoplasmic
fluorescein and nuclear PI seems contradictory because
the fluorescein is retained only in the intact membrane,
and the appearance of PI-stained nuclei indicates loss of
membrane integrity. However, this may be explained by
a difference in rates of diffusion for fluorescein and PI
across a partially permeabilized plasma membrane. We
speculate these cells were in the process of cellular dismantling with the loss of membrane integrity, gradually
allowing both PI to enter the cell and fluorescein to diffuse out (Fig. 2b). Taken together, our results show that
dual FDA/PI staining is a robust viability assay for rice
sheath cells and also that novel fluorescein patterns can
be an indicator of cytological events that occur during
cell death such as vacuolar shrinkage.
FDA indicates viability of rice cells infected with rice blast
fungus
To evaluate FDA staining during successful fungal infection, we inoculated rice sheaths with a transgenic strain
of M. oryzae CKF1997. This strain constitutively expresses cytoplasmic red fluorescent protein, allowing
simultaneous visualization of fungal hyphae (red) and
fluorescein (green) in rice cells when analyzed by confocal microscopy.
At an early stage of infection (~28 h post inoculation,
hpi), the fungus had penetrated into epidermal cells via an
appressorium and subsequently produced IH. Upon staining with FDA, we observed typical cytoplasmic fluorescein
in both invaded and uninvaded cells (n = 33 infections)
(Fig. 3a), confirming previous reports that host cells at this
stage were viable, and hyphal invasions were biotrophic
[12, 13]. In addition, we observed fluorescein associated
with BICs at early stages of host cell invasion (n = 30)
Jones et al. BMC Plant Biology (2016) 16:69
FDA/PI
PI
FDA
A. FDA/PI/sucrose
FDA/PI
PI
FDA
B. FDA/PI/sucrose/damage
FDA/FM4-64
FM4-64
FDA
C. FDA/FM4-64/sucrose/damage
Page 5 of 8
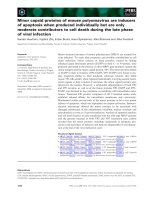
Fig. 2 Novel fluorescein patterns in the cytoplasm of cells next to
directly damaged cells. a Confocal image showing dual staining with
FDA (green) and PI (red) followed by treatment with 0.5 M sucrose to
induce plasmolysis in live cells. Bar = 50 μm. b Confocal image showing
dual FDA/PI staining followed by treatment with 0.5 M sucrose to induce
plasmolysis in live cells, then mechanically damaged with a razor. White
dotted lines indicate where the sheath was damaged with the razor.
White stars indicate PI stained nuclei. White arrows indicate membrane
bound compartments containing fluorescein. Arrowheads indicate
fluorescein evenly distributed in the cytoplasm but excluded from the
vacuole. Bar = 50 μm. c Confocal image of rice cells sequentially treated
with FM4-64 for two hours, FDA for 10 min and 0.5 M sucrose for 10
min, followed by mechanical damage with a razor. White dotted lines
indicate where the cell was damaged with the razor. FM4-64 stained the
plasma membrane (arrow) and the tonoplast (arrowhead), and fluorescein
(green) was retained in the cytoplasm. Bar = 10 μm
(Fig. 3), consistent with previous observations that BICs
are surrounded by the host cytoplasm [18, 28].
At a later stage of infection (~48 hpi), IH had spread
two to three cells away from the initially invaded cell,
and we observed the coexistence of both live and dead
host cells (n = 28 infections) (Fig. 3b). Typical cytoplasmic fluorescein in some invaded cells at the margin of
the infection zone or a lack of fluorescein in partially or
fully colonized cells was representative of the hemibiotrophic lifestyle of M. oryzae, in which live host cells are invaded but then killed by the time IH spread to neighboring
cells [13]. Intriguingly, many partially invaded cells displayed novel fluorescein patterns such as brighter fluorescence in the enlarged cytoplasm (n = 65) (Fig. 3b) that we
observed in mechanically wounded cells (Fig. 2b and c).
This suggests that plant cell death resulting from successful
invasion by M. oryzae and by mechanical damage involves
similar morphological features. Further investigation into
processes that give rise to novel fluorescein patterns may
provide new insight into cytological responses and modes
of cell death.
Time-lapse imaging of rice blast invasion
To determine the dynamics of host cell death during
rice blast invasion, we performed time-course confocal microscopy on rice sheaths infected with M.
oryzae CKF1997 (n = 3). We stained infected tissue
with FDA once the majority of the initial cell was colonized (30 hpi). Similar to infections at ~28 hpi (Fig. 3a), an
initially invaded cell displayed typical cytoplasmic fluorescein patterns (Fig. 4a). After 2 h (32 hpi), the same infection site that was further colonized by IH displayed the
novel fluorescein pattern (Fig. 4b). When the same infection site was observed the next day (48 hpi), IH had
spread into up to two subsequent neighboring cells.
Hyphal growth did not seem to have been affected by
FDA when compared to control infection, but fluorescein
was rarely detectable (data not shown). Because the fluorescein intensity reduces over time due to its instability in
Jones et al. BMC Plant Biology (2016) 16:69
Page 6 of 8
A
B
Fig. 3 Host cell viability at early and late stages of rice blast invasion. a Single plane confocal image of rice sheath epidermal cells infected with
M. oryzae transformant CKF1997 expressing cytoplasmic tdTomato (shown in red) at 28 hpi and stained with FDA (green). The appressorium (arrowhead)
mediated penetration of the host cell and produced IH. Fluorescein is localized in the cytoplasm of both infected and non-infected cells and
also associated with a BIC (arrow). b Maximum projection of three successive z-stack images covering 6 μm, showing rice sheath epidermal
cells infected with M. oryzae transformant CKF1997 at 48 hpi and stained with FDA. IH (red) had spread into two cells away from the initially
invaded cell indicated with solid white outline. Newly invaded- and non-invaded cells were stained with fluorescence, whereas fully invaded
and some partially invaded cells lacked fluorescein. A novel fluorescein pattern (brighter fluorescence in the enlarged cytoplasm) was observed in a
partially invaded cell (white arrow). Bars = 20 μm
aqueous solution [32], we stained the same sheath again
by mounting it in a freshly prepared FDA working solution. This resulted in replenished fluorescein in the infected rice sheath, and we were able to observe both
typical and novel fluorescein patterns (Fig. 4c), consistent
with previous results of infections at 48 hpi (Fig. 3b). We
also observed homogenous fluorescein within an entire invaded cell (Fig. 4c), suggesting the vacuole had ruptured.
Time-lapse imaging suggested that the FDA staining pattern in the infected host cell progressed from typical cytoplasmic localization (live cell with the intact vacuole), to
novel patterns (dying cell with closed plasmodesmata with
the shrunken or ruptured vacuole), to lack of fluorescence
(dead cell). Taken together, our results show that fluorescein dynamically stains plant cells during cell death resulting from various stimuli.
Conclusion
We have developed a fluorescence imaging method to
visualize the dynamics of rice cell death in response to
mechanical wounding or fungal invasion. This method
makes use of the combination of (a) live-cell confocal
microscopy, (b) optically transparent rice sheath cells,
(c) fluorescently-tagged M. oryzae, and (d) fluorescent
vital dyes PI and FDA. In particular, we found that FDA
is a useful investigational tool for time-course imaging
not only for cell viability but also for host vacuolar dynamics during fungal invasion. In addition, this method
has revealed unexpected changes of fluorescein patterns
during wound- and pathogen-induced death of rice cells.
This allows us to hypothesize the sequence of cytological
events leading to rice cell death during the colonization
of susceptible rice cells by M. oryzae IH: (i) live host cell
with the intact vacuole, (ii) shrinkage of the vacuole,
increase of esterase activity, and closure of plasmodesmata, (iii) collapse of the vacuole, and (iv) death of the
infected cell. This method can be used to compare and
contrast host cell death associated with disease resistance and susceptibility in rice-M. oryzae and other hostpathogen interactions.
Methods
Plant and fungal strains
Rice (Oryza sativa) strain YT16 was grown under long
day conditions (14/10 h, day/night) in a Conviron PGW36
growth chamber with daytime temperature of 28°C and
nighttime temperature of 24 °C. Plants were grown in 4”
pots with Fanford 3B soil mix. Iron chelate solution (3.25
% iron chelate in water) was added at the time of planting,
then 20-10-20 peat lite fertilizer was applied once a week.
We generated M. oryzae transgenic strain CKF1997 by
transforming M. oryzae wild-type strain O-137 with the
plasmid pCK1292 using Agrobacterium-mediated transformation [33]. pCK1292 was produced by cloning of the
tdTomato gene from pAN582 [34] under control of the
constitutive promoter from the M. oryzae ribosomal protein 27 gene in the binary vector pBGt [35].
Infection assay
Rice sheath inoculations were performed as previously
described [13]. Briefly, excised leaf sheaths (5–9 cm
long) from 17- to 21-day old plants were inoculated with
a spore suspension (2 x 10⁴ spores/ml in sterile water).
The inoculated sheaths were hand-trimmed at 22–28
hpi and immediately used for straining or confocal
microscopy.
Jones et al. BMC Plant Biology (2016) 16:69
Page 7 of 8
A
B
C
D
No fluorescein–
Dead cell (initially
invaded cell)
Typical
fluorescein
pattern (viable
cells)
Novel fluorescein
pattern (shrunken
vacuole and closed
plasmodesmata)
Novel fluorescein
pattern (ruptured
vacuole and closed
plasmodesmata)
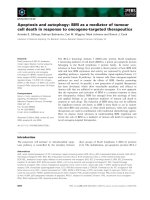
Fig. 4 Time-course of the dynamics of host cell death during rice blast invasion. a Confocal image showing M. oryzae CKF1997 (red) infection in
a rice sheath epidermal cell at 30 hpi. Rice cells contained typical cytoplasmic fluorescein. b The same infection in (a) imaged 2 h later showing a
novel fluorescein pattern (brighter fluorescence in the enlarged cytoplasm). c The same infection in (b) imaged 15 h later. The sample was stained again
with FDA to renew fluorescein. The first invaded cell (solid white outline) lacked fluorescein, indicating it was dead by this time. Partially invaded cells
showed either typical cytoplasmic fluorescein or novel fluorescein patterns. Dotted white line outlines the cells (total nine cells) infected by
hyphae. Bars = 20 μm. d Schematic representation of infected cells in (c) with fluorescein pattern classification
Staining procedures and plasmolysis
Fluorescein diacetate (FDA; catalog No. F7378, 5 g
power; Sigma) was dissolved in acetone to a stock concentration of 1g/ml. A working solution (2 μg/ml) of
FDA was prepared by diluting 2 μl of the stock solution
in 1ml of water. A 10 μg/ml working solution of PI
(catalog No. P3566; 10 ml of 1 mg/ml solution in water;
ThermoFisher) was prepared by diluting 10 μl of the
stock solution in 1 ml of water. A dual FDA/PI working
solution was prepared by mixing 2 μl of the FDA stock
solution and 10 μl of the PI stock solution in a final volume of 1ml water. A 17 mM stock solution of FM4-64
(catalog No. T13320; 10 x 100 μg; ThermoFisher) was
prepared by dissolving 100 μg in 9.2 μl water. A working
solution of 17 μM was prepared by diluting 1 μl of the
stock solution in 1 ml of water. Plasmolysis was performed by submerging sheaths in 1 ml of 0.5 M sucrose
for 10 min, then mounting sheaths in the same sucrose
solution.
Confocal microscopy and image analysis
Confocal microscopy was performed with a Zeiss LSM
510 Meta laser scanning confocal microscope. Fluorescein was excited using a 488 nm laser and emission collected between 505 and 530nm, and tdTomato was
excited using a 543nm laser and emission detected between 560 and 615 nm. PI was excited using a 543 nm
laser and emission collected with the 615 nm long pass
filter. Images were processed using the Zen software
(Black edition, version 10.0, Zeiss).
Jones et al. BMC Plant Biology (2016) 16:69
Availability of data and materials
The data sets supporting the results of this article are
included within the article.
Abbreviations
BIC: biotrophic interfacial complex; EIHM: extra-invasive hyphal membrane;
FDA: fluorescein diacetate; hpi: hours post inoculation; IH: invasive hyphae;
PCD: programmed cell death; PI: propidium iodide.
Competing interests
The authors declare that they have no competing interests.
Authors’ contributions
CHK and KJ conceived and designed the experiments. KJ and DWK performed
the experiments. K.J. and JSP produced figures. CHK and KJ analyzed the data
and wrote the paper. All authors have read and approved the final version of
the manuscript.
Acknowledgements
We thank current and former members of the Khang Lab
( for their help and discussions. We
acknowledge the assistance of the Biomedical Microscopy Core at the
University of Georgia with imaging using a Zeiss LSM 510 confocal
microscope. This work was supported by the Agriculture and Food
Research Initiative competitive grants program, Award number 201467013-21717 from the USDA National Institute of Food and Agriculture.
Received: 1 January 2016 Accepted: 14 March 2016
References
1. Govrin EM, Levine A. The hypersensitive response facilitates plant infection
by the necrotrophic pathogen Botrytis cinerea. Curr Biol. 2000;10(13):751–7.
2. Greenberg JT, Yao N. The role and regulation of programmed cell death in
plant-pathogen interactions. Cell Microbiol. 2004;6(3):201–11.
3. Mengiste T. Plant Immunity to necrotrophs. Annu Rev Phytopathol. 2012;
50(1):267–94.
4. Dickman MB, Fluhr R. Centrality of host cell death in plant-microbe interactions.
Annu Rev Phytopathol. 2013;51(1):543–70.
5. Morel J-B, Dangl JL. The hypersensitive response and the induction of cell
death in plants. Cell Death Differ. 1997;4:671–83.
6. Lam E. Controlled cell death, plant survival and development. Nat Rev Mol
Cell Biol. 2004;5(4):305–15.
7. Mur LAJ, Kenton P, Lloyd AJ, Ougham H, Prats E. The hypersensitive
response; the centenary is upon us but how much do we know? J Exp Bot.
2008;59:501–20.
8. van Doorn WG, Beers EP, Dangl JL, Franklin-Tong VE, Gallois P, HaraNishimura I, Jones AM, Kawai-Yamada M, Lam E, Mundy J, et al.
Morphological classification of plant cell deaths. Cell Death Differ. 2011;
18(8):1241–6.
9. Jones AM. Programmed cell death in development and defense. Plant
Physiol. 2001;125(1):94–7.
10. Wertman J, Lord C, Dauphinee A, Gunawardena A. The pathway of cell
dismantling during programmed cell death in lace plant (Aponogeton
madagascariensis) leaves. BMC Plant Biology. 2012;12(1):115.
11. Kabbage M, Williams B, Dickman MB. Cell death control: the interplay of
apoptosis and autophagy in the pathogenicity of Sclerotinia sclerotiorum.
PLoS Pathog. 2013;9(4):e1003287.
12. Koga H, Dohi K, Nakayachi O, Mori M. A novel inoculation method of
Magnaporthe grisea for cytological observation of the infection process
using intact leaf sheaths of rice plants. Physiol Mol Plant Pathol. 2004;64:
67–72.
13. Kankanala P, Czymmek K, Valent B. Roles for rice membrane dynamics and
plasmodesmata during biotrophic invasion by the blast fungus. Plant Cell.
2007;19(2):706–24.
14. Horbach R, Navarro-Quesada AR, Knogge W, Deising HB. When and how to
kill a plant cell: Infection strategies of plant pathogenic fungi. J Plant
Physiol. 2011;168(1):51–62.
15. Hatsugai N, Kuroyanagi M, Yamada K, Meshi T, Tsuda S, Kondo M, Nishimura
M, Hara-Nishimura I. A plant vacuolar protease, VPE, mediates virus-induced
hypersensitive cell death. Science. 2004;305(5685):855–8.
Page 8 of 8
16. Hatsugai N, Iwasaki S, Tamura K, Kondo M, Fuji K, Ogasawara K, Nishimura
M, Hara-Nishimura I. A novel membrane fusion-mediated plant immunity
against bacterial pathogens. Genes Dev. 2009;23(21):2496–506.
17. Hirakawa Y, Nomura T, Hasezawa S, Higaki T. Simplification of vacuole
structure during plant cell death triggered by culture filtrates of Erwinia
carotovora. J Integr Plant Biol. 2015;57(1):127–35.
18. Mochizuki S, Minami E, Nishizawa Y. Live-cell imaging of rice cytological
changes reveals the importance of host vacuole maintenance for
biotrophic invasion by blast fungus, Magnaporthe oryzae. Microbiology
Open. 2015;4(6):952–66.
19. Celenza JL, Grisafi PL, Fink GR. A pathway for lateral root formation in
Arabidopsis thaliana. Genes Dev. 1995;9(17):2131–42.
20. Green VS, Stott DE, Diack M. Assay for fluorescein diacetate hydrolytic activity:
optimization for soil samples. Soil Biol Biochem. 2006;38(4):693–701.
21. Saruyama N, Sakakura Y, Asano T, Nishiuchi T, Sasamoto H, Kodama H.
Quantification of metabolic activity of cultured plant cells by vital staining
with fluorescein diacetate. Anal Biochem. 2013;441(1):58–62.
22. Fricker M, Parsons A, Tlalka M, Blancaflor E, Gilroy S, Meyer A, Plieth C. Fluorescent
probes for living plant cells. In: Hawes C, Satiat-Jeunemaitre B, editors. Plant Cell
Biology. New York: Oxford University Press; 2001. p. 35–84.
23. Mellersh DG, Heath MC. Plasma membrane-cell wall adhesion is required for
expression of plant defense responses during fungal penetration. Plant Cell.
2001;13(2):413–24.
24. Mathur J, Mathur N, Kernebeck B, Hülskamp M. Mutations in actin-related
proteins 2 and 3 affect cell shape development in Arabidopsis. Plant Cell.
2003;15(7):1632–45.
25. Gao X-Q, Li C-G, Wei P-C, Zhang X-Y, Chen J, Wang X-C. The dynamic
changes of tonoplasts in guard cells are important for stomatal movement
in Vicia faba. Plant Physiol. 2005;139(3):1207–16.
26. Chen J, Hall DE, Murata J, De Luca V. l-Alanine induces programmed cell
death in V. labrusca cell suspension cultures. Plant Sci. 2006;171(6):734–44.
27. Ryder LS, Talbot NJ. Regulation of appressorium development in
pathogenic fungi. Curr Opin Plant Biol. 2015;26:8–13.
28. Khang CH, Berruyer R, Giraldo MC, Kankanala P, Park S-Y, Czymmek K, Kang
S, Valent B. Translocation of Magnaporthe oryzae effectors into rice cells and
their subsequent cell-to-cell movement. Plant Cell. 2010;22:1388–403.
29. Truernit E, Haseloff J. A simple way to identify non-viable cells within living
plant tissue using confocal microscopy. Plant Methods. 2008;4(1):15.
30. Krasnow M, Matthews M, Shackel K. Evidence for substantial maintenance of
membrane integrity and cell viability in normally developing grape (Vitis
vinifera L.) berries throughout development. J Exp Bot. 2008;59(4):849–59.
31. Vida TA, Erm SD. A new vital stain for visualizing vacuolar membrane
dynamics and endocytosis in yeast. J Cell Biol. 1995;128:779–92.
32. Boyd V, Cholewa OM, Papas KK. Limitations in the use of fluorescein
diacetate/propidium iodide (FDA/PI) and cell permeable nucleic acid stains
for viability measurements of isolated islets of langerhans. Curr Trends
Biotechnol Pharm. 2008;2:66–84.
33. Khang CH, Park S-Y, Rho H-S, Lee Y-H, Kang S. Filamentous fungi (Magnaporthe
grisea and Fusarium oxysporum). In: Agrobacterium Protocols, vol. 2. 2006. p.
403–20.
34. Nelson BK, Cai X, Nebenführ A. A multicolored set of in vivo organelle
markers for co-localization studies in Arabidopsis and other plants. Plant J.
2007;51(6):1126–36.
35. Kim H-S, Park S-Y, Lee S, Adams EL, Czymmek K, Kang S. Loss of cAMPdependent protein kinase A affects multiple traits important for root
pathogenesis by Fusarium oxysporum. Mol Plant-Microbe Interact. 2011;24:719–32.
Submit your next manuscript to BioMed Central
and we will help you at every step:
• We accept pre-submission inquiries
• Our selector tool helps you to find the most relevant journal
• We provide round the clock customer support
• Convenient online submission
• Thorough peer review
• Inclusion in PubMed and all major indexing services
• Maximum visibility for your research
Submit your manuscript at
www.biomedcentral.com/submit