Genome-wide analysis and expression profiling of glyoxalase gene families in soybean (Glycine max) indicate their development and abiotic stress specific response
Bạn đang xem bản rút gọn của tài liệu. Xem và tải ngay bản đầy đủ của tài liệu tại đây (2.7 MB, 25 trang )
Ghosh and Islam BMC Plant Biology (2016) 16:87
DOI 10.1186/s12870-016-0773-9
RESEARCH ARTICLE
Open Access
Genome-wide analysis and expression
profiling of glyoxalase gene families in
soybean (Glycine max) indicate their
development and abiotic stress specific
response
Ajit Ghosh1* and Tahmina Islam2
Abstract
Background: Glyoxalase pathway consists of two enzymes, glyoxalase I (GLYI) and glyoxalase II (GLYII) which
detoxifies a highly cytotoxic metabolite methylglyoxal (MG) to its non-toxic form. MG may form advanced
glycation end products with various cellular macro-molecules such as proteins, DNA and RNA; that ultimately
lead to their inactivation. Role of glyoxalase enzymes has been extensively investigated in various plant species
which showed their crucial role in salinity, drought and heavy metal stress tolerance. Previously genome-wide analysis
of glyoxalase genes has been conducted in model plants Arabidopsis and rice, but no such study was performed in any
legume species.
Results: In the present study, a comprehensive genome database analysis of soybean was performed and identified a
total of putative 41 GLYI and 23 GLYII proteins encoded by 24 and 12 genes, respectively. Detailed analysis of these
identified members was conducted including their nomenclature and classification, chromosomal distribution and
duplication, exon-intron organization, and protein domain(s) and motifs identification. Expression profiling of these
genes has been performed in different tissues and developmental stages as well as under salinity and drought stresses
using publicly available RNAseq and microarray data. The study revealed that GmGLYI-7 and GmGLYII-8 have
been expressed intensively in all the developmental stages and tissues; while GmGLYI-6, GmGLYI-9, GmGLYI-20,
GmGLYII-5 and GmGLYII-10 were highly abiotic stress responsive members.
Conclusions: The present study identifies the largest family of glyoxalase proteins to date with 41 GmGLYI
and 23 GmGLYII members in soybean. Detailed analysis of GmGLYI and GmGLYII genes strongly indicates the
genome-wide segmental and tandem duplication of the glyoxalase members. Moreover, this study provides
a strong basis about the biological role and function of GmGLYI and GmGLYII members in soybean growth,
development and stress physiology.
Keywords: Glyoxalase, Glycine max, Abiotic stress, Functional divergence, Gene duplication, Microarray, Metal
dependency, RNA seq-Atlas, Semiquantitative RT-PCR
* Correspondence:
1
Department of Biochemistry and Molecular Biology, Shahjalal University of
Science and Technology, Sylhet 3114, Bangladesh
Full list of author information is available at the end of the article
© 2016 Ghosh and Islam. Open Access This article is distributed under the terms of the Creative Commons Attribution 4.0
International License ( which permits unrestricted use, distribution, and
reproduction in any medium, provided you give appropriate credit to the original author(s) and the source, provide a link to
the Creative Commons license, and indicate if changes were made. The Creative Commons Public Domain Dedication waiver
( applies to the data made available in this article, unless otherwise stated.
Ghosh and Islam BMC Plant Biology (2016) 16:87
Background
The glyoxalase system is a two-enzyme driven pathway
that detoxifies the highly cytotoxic compound, methylglyoxal (MG) to D-lactate. The detoxification is accomplished by the sequential action of two thiol-dependent
enzymes; glyoxalase І (GLYI) and glyoxalase II (GLYII).
In presence of reduced glutathione (GSH), MG is converted into hemithioacetal (HTA) spontaneously, and
GLYI catalyses the isomerization of this HTA into S-Dlactoyl-glutathione (SLG). GLYII hydrolyses SLG into
D-lactate and recycles back one molecule of GSH to
the system [1]. Both, the formation of MG and the
glyoxalase enzymes have been ubiquitously found in all
organisms from Escherichia coli to Homo sapiens [2].
Besides its proposed role in the detoxification of
MG as metabolic enzyme, glyoxalase enzymes have
been reported to be involved in various other functions. Glyoxalase system protects human from various
vascular complications of diabetes, such as nephropathy,
retinopathy, neuropathy and cardiovascular disease by
resisting the increased accumulation of MG [3]. Moreover,
glyoxalase pathway has also been shown to be involved in
different important cellular functions of human, such as
cell division and proliferation, microtubule assembly
and protection against oxoaldehydes toxicity [4]. For
this, the pathway has been regarded as “marker for cell
growth and division”. Similarly, stress tolerance potential of glyoxalase has been reported in plant by numerous studies [5]. Transgenic plants over-expressing GLYI
and/or GLYII were found to provide significant tolerance against multiple abiotic stresses including salinity,
drought and heavy metal toxicity [5, 6]. Thus MG and
glyoxalases are considered as potential biomarkers for
plant stress tolerance [7].
Glyoxalase proteins have been extensively characterized from different genera such as Escherichia coli,
Homo sapiens, Saccharomyces cerevisiae, Arabidopsis
thaliana and Oryza sativa [2]. Compared to other organisms, very little is known about plant glyoxalases.
The first plant glyoxalase activity was reported from
Douglas fir needles by Smits and Johnson [5]. Thereafter,
presence of glyoxalase activity has been reported from
various other plant species, such as rice, Arabidopsis, tomato, wheat, sugarcane, Brassica etc. [7]. Most of the
genes of plant exist as family due to the expansion and
gene duplication during the course of plant evolution
[8]. Availability of the whole genome sequences has
opened up the field to identify and characterize plant
glyoxalase family substantially. According to in silico
genome wide analyses of rice and Arabidopsis, there are
eleven potential GLYI and three GLYII genes in rice; and
eleven GLYI and five GLYII genes in Arabidopsis [1]. Expression analysis of all these genes have been performed
in different developmental tissues and stages, and in
Page 2 of 25
response to multiple abiotic stresses using publicly
available MPSS and microarray database. It has been
observed that AtGLYI-3, OsGLYI-11, AtGLYII-2,
AtGLYII-5, OsGLYII-2 and OsGLYII-3 showed constitutive expression in all the tissues and stages, while
AtGLYI-8, OsGLYI-3, and OsGLYI-10 expressed only in
seed [1]. On the other hand, AtGLYI-7, OsGLYI-11,
AtGLYII-2 and OsGLYII-3 were the most stress inducible
members [1].
Among these identified glyoxalase members, GLYII
genes have been extensively studied from both rice and
Arabidopsis but the research on GLYI is still very limited. To date, all five AtGLYII and three OsGLYII genes
have been well characterized. Both OsGLYII-2 and
OsGLYII-3 possessed typical GLYII enzymatic activity
and overexpression of these genes in tobacco provides
enhanced tolerance against salinity stress [9, 10]. However, OsGLYII-1, along with AtGLYII-5 showed functional divergence by possessing sulphur dioxygenase
(SDO) activity instead of GLYII [11]. One of the rice
GLYI, OsGLYI-11.2 have been studied extensively and
found to possess Ni2+-dependent GLYI activity with
stress modulation potential [12].
Soybean (Glycine max [L.] Merr.) is a legume plant of
Papilionoideae family [13], major source of vegetable
protein and edible oil. It also has the capacity to fix atmospheric nitrogen through symbioses [14]. However,
production of soybean is under threat due to the unfavourable environmental stimuli such as drought, salinity and osmotic stresses [15, 16]. All these stresses
severely affect the overall plant development in all the
stages from germination to flowering and reduce the
productivity and seed quality of soybean. The yield has
been reported to be reduced by about 40 % in response
to drought [15]. Thus, there is an urgent need to identify
novel stress responsive soybean genes using the available
genome database [14]. The soybean genome contains
46,430 predicted protein-coding genes which are 70 %
more than Arabidopsis. There have been two genome
duplication events undergone in soybean at approximately 59 and 13 million years ago, that resulted a
highly duplicated genome (more than 75 % of the genes
are duplicated) [14]. A lot of gene families have been
studied in soybean, such as ERF, HD-Zip, WRKY, BURP,
MADS-box, MYB, NAC, CYP [13, 17–22].
Genome wide analyses of glyoxalase gene family have
been done in Arabidopsis and rice [1], but no such analysis has been performed in soybean in spite of having a
handful genome sequences deposited in the publicly
available database. Here, we present a detailed genomewide identification of soybean GLYI and GLYII genes,
their phylogenetic relationship, chromosomal distribution, structural and expressional analysis. Present results
indicate that soybean genome contains 41 GLYI and 23
Ghosh and Islam BMC Plant Biology (2016) 16:87
GLYII proteins, the largest family of glyoxalase known
to date in any organism. Expression analysis of these
genes based on publicly available microarray data indicates the differentially regulation of glyoxalase members
in response to various developmental cues as well as
stress treatments. In particular GmGLYI-6, GmGLYI-9
and GmGLYII-5 are most up-regulated stress responsive
members that might resist MG accumulation in stress
by interacting with other members. This study will facilitate the further investigation of soybean glyoxalase genes
for the biological and molecular functions.
Results
Identification of GLYI and GLYII gene families in soybean
Proteins having lactoylglutathione lyase domain (PF00903)
have been classified as GLYI proteins and metallo-betalactamase domain (PF00753) have been classified as GLYII
proteins [1]. Previously, glyoxalase proteins have been
identified in two model plant genome, Arabidopsis and
rice [1]. To identify all the putative members of the
glyoxalase proteins in soybean, a BLASTP search of
the soybean genome database G. max Wm82.a2.v1
( />ow=BLAST&method=Org_Gmax) was performed using
the previously characterized protein sequence as a query.
GLYI proteins have been primarily identified using a
previously reported soybean GLYI protein (GenBank:
NM_001249223.1). Subsequently, each of the newly identified GLYI protein sequences has been used as a query sequence individually in BLASTP search of soybean genome
Page 3 of 25
database. Subsequent searching process was repeated until
there was no new member documented. This search resulted in the identification of total 43 unique proteins. All
these identified proteins were analyzed using Pfam to
check the presence of unique lactoylglutathione lyase domain (PF00903). This analysis discarded two members
due to the lack of lactoylglutathione lyase domain, and finally landed to a total of 41 soybean GLYI proteins which
is greater than the previously reported Arabidopsis (22)
and rice (19) GLYI proteins. These 41 GLYI proteins have
been coded by 24 unique genes located on 13 different
chromosomes (Fig. 1). They were identified and named as
GmGLYI-1 to GmGLYI-24 following the nomenclature
proposed previously [1] (Table 1).
Similarly, soybean GLYII proteins have been primarily identified using a previously characterized Brassica
juncea GLYII protein (GenBank: AAO26580.1) as
query and secondarily by the newly identified members.
A total of 26 unique protein sequences have been identified and checked for the presence of unique metallobeta-lactamase domain (PF00753) using Pfam. Three of
them didn’t have this unique domain and were discarded from the list. Thus, a total of 23 soybean GLYII
proteins have been confirmed which is greater than the
previously reported Arabidopsis (9) and rice (4) GLYII
family members. These 23 GLYII proteins have been
coded by 12 unique genes located on ten different chromosomes (Fig. 1). They were named as GmGLYII-1 to
GmGLYII-12 like GmGLYI genes (Table 2). In both
GmGLYI and GmGLYII families, the number of proteins
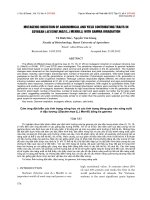
Fig. 1 Chromosomal distribution of GmGLYI (a) and GmGLYII (b) genes on different soybean chromosomes. Only the chromosomes having glyoxalase
genes are shown and their number is indicated above by Roman numbers. The scale is in mega base (Mb), and the centromeric regions are indicated
by black ellipses. Red coloured boxes indicate the segmental duplicated genes connected by red lines, based on sequence similarities and divergence
analysis (Table 3). Black boxes indicate the non-duplicated genes
Name
Gene
Protein
Chro. no
CDS coordinate (5’ to 3’)
CDS (bp)
Exons
PP length (aa)
pI
Localization
GmGLYI-1
Glyma.01 g146300
Glyma.01 g146300.1
1
48150827–48154366
1044
9
347
MW (kDa)
39.3
7.01
Cha,c; Mtb; Cyb
Glyma.01 g146300.2
1038
9
345
39.1
7.01
Cha,c; Mtb; Cyb
Glyma.01 g146300.3
930
8
309
35.1
8.44
Cha,b,c; Mtb; Cyb
GmGLYI-2
Glyma.01 g168400
Glyma.01 g168400.1
1
50605679–50608020
579
3
192
22.0
5.04
Cya; Ecb
GmGLYI-3
Glyma.04 g083100
Glyma.04 g083100.1
4
7006088–7009361
1041
9
346
38.5
5.83
Cha,b,c
GmGLYI-4
Glyma.05 g228500
Glyma.05 g228500.1
5
40646576–40651812
1101
9
366
40.6
8.17
Cha,b,c
1089
9
362
40.2
6.28
Cha,b,c
Glyma.05 g228500.2
GmGLYI-5
Glyma.06 g084500
Glyma.06 g084500.1
6
6498718–6501298
792
8
263
29.7
5.45
Cyb
GmGLYI-6
Glyma.07 g031700
Glyma.07 g031700.1
7
2508024–2510223
519
2
172
19.6
5.10
Nua; Cyb
Glyma.07 g031700.2
369
3
122
13.9
4.89
Cya,b
Glyma.07 g031700.3
381
2
126
14.5
5.03
Cya,b
843
7
280
31.6
5.62
Cya,b
Glyma.07 g261400.2
732
8
243
27.2
5.34
Cya,b
Glyma.07 g261400.3
795
7
264
29.8
5.24
Cya,b
Glyma.07 g261400.4
843
8
280
31.6
5.62
Cya,b
Glyma.07 g261400.5
843
8
280
31.6
5.62
Cya,b
Glyma.07 g261400.6
819
8
272
30.7
6.11
Cya,b
GmGLYI-7
Glyma.07 g261400
Glyma.07 g261400.1
7
43645750–43649851
GmGLYI-8
Glyma.08 g035400
Glyma.08 g035400.1
8
2811954–2818455
1071
9
356
39.6
6.56
Cha,b,c
GmGLYI-9
Glyma.08 g211100
Glyma.08 g211100.1
8
17046316–17048640
426
3
141
16.4
4.86
Cha;Nua; Cya,b
GmGLYI-10
Glyma.09 g004300
Glyma.09 g004300.1
9
340275–344376
975
8
324
36.9
6.62
Mta; Cyb
Glyma.09 g004300.2
891
9
296
33.5
6.13
Cya,b
Glyma.09 g004300.3
864
9
287
32.4
5.74
Cya,b
Glyma.09 g004300.4
840
8
279
31.5
6.97
Cya,b
Glyma.09 g004300.5
951
9
316
35.9
8.45
Mta,b; Cyb
1041
9
346
39.0
6.68
Cha,b,c; Mtb
819
7
272
30.6
8.76
Cha,c; Mtb
GmGLYI-11
Glyma.09 g193800
Glyma.09 g193800.1
9
41830881–41834537
Glyma.09 g193800.2
Glyma.09 g226500
Glyma.09 g226500.1
9
45136253–45137166
333
2
110
12.8
5.23
Cyb
GmGLYI-13
Glyma.11 g075000
Glyma.11 g075000.1
11
5598647–5600229
579
3
192
22.1
4.97
Cya,b
GmGLYI-14
Glyma.11 g194200
Glyma.11 g194200.1
11
26776807–26779603
747
8
248
28.5
5.48
Poa; Cyb; Ecb
GmGLYI-15
Glyma.11 g194300
Glyma.11 g194300.1
11
26780838–26784795
702
8
233
26.5
9.16
Cha,c; Mtb
GmGLYI-16
Glyma.12 g079700
Glyma.12 g079700.1
12
6241940–6246776
708
7
235
26.8
9.28
Mta,b
Glyma.12 g079700.2
558
6
185
21.0
5.41
Cya,b
Glyma.12 g079700.3
525
8
174
20.0
9.69
Mta,b
Page 4 of 25
GmGLYI-12
Ghosh and Islam BMC Plant Biology (2016) 16:87
Table 1 List of identified GLYI genes in Soybean (Glycine max) along with their detailed information and localization
GmGLYI-17
Glyma.12 g167400
Glyma.12 g167400.1
12
32196920–32200101
555
2
184
21.0
5.14
Cya,b; Ecb
GmGLYI-18
Glyma.13 g106600
Glyma.13 g106600.1
13
22081599–22084230
630
5
209
23.4
6.49
Cha,c; Ecb, Mtb
GmGLYI-19
Glyma.13 g168200
Glyma.13 g168200.1
13
28259866–28261852
504
3
167
19.0
5.46
Eca; Cyb; Nub
GmGLYI-20
Glyma.15 g009500
Glyma.15 g009500.1
15
737953–739806
522
3
173
19.4
5.58
Cha,b; Cyb
GmGLYI-21
Glyma.15 g108400
Glyma.15 g108400.1
15
8534420–8539477
864
8
287
32.4
5.74
Cya,b
GmGLYI-22
Glyma.16 g003500
Glyma.16 g003500.1
16
194687–196274
549
2
182
20.6
5.22
Cya,b; Chb
GmGLYI-23
Glyma.17 g052700
Glyma.17 g052700.1
17
4011185–4013445
621
5
206
22.9
7.08
Cha,c; Mtb
GmGLYI-24
Glyma.17 g115900
Glyma.17 g115900.1
17
9163290–9164088
438
4
145
16.5
6.88
Cha, Eca,b; Nub
I
Abbreviations: CDS coding DNA sequence, Chro chromosome, PP polypeptide length, MW molecular weight, P isoelectric point, bp base pair, aa amino acid, kDa kilodalton, Ch chloroplast, Cy cytosol, Ec extracellular,
Mt mitochondria, Nu nucleus, Po peroxisome
a
Localization prediction by CELLO v.2.5 ( />b
Localization prediction by pSORT ( />c
Chloroplast localization signal confirmed by ChloroP ( />
Ghosh and Islam BMC Plant Biology (2016) 16:87
Table 1 List of identified GLYI genes in Soybean (Glycine max) along with their detailed information and localization (Continued)
Page 5 of 25
Name
Gene
Protein
Chromosome no
CDS coordinate (5’ to 3’)
CDS (bp)
Exons
PP length (aa)
GmGLYII-1
Glyma.02 g220100
Glyma.02 g220100.1
2
40797403–40800820
609
5
202
GmGLYII-2
Glyma.04 g224100
Glyma.04 g224100.1
4
49456049–49460172
600
6
Glyma.04 g224100.2
546
Glyma.04 g224100.3
Glyma.04 g224100.4
MW (kDa)
pI
Localization
22.8
5.62
Cyb
199
22.0
7.12
Cya,b
6
181
20.0
6.54
Cya; Ecb
486
5
161
17.9
6.49
Cya,b
432
4
143
15.9
7.59
Cya, Ecb
GmGLYII-3
Glyma.06 g140800
Glyma.06 g140800.1
6
11478165–11482810
777
7
258
28.7
6.86
Cyb
GmGLYII-4
Glyma.11 g126200
Glyma.11 g126200.1
11
9591802–9595913
948
7
315
34.7
6.06
Nua; Mtb
861
7
286
31.5
5.92
Cha,b; Mta,b
951
8
316
35.0
5.93
Cha; Mtb
Glyma.12 g050800.2
948
8
315
34.9
5.94
Nua; Mtb
Glyma.12 g050800.3
924
8
307
34.0
6.22
Nua; Mtb
Glyma.11 g126200.2
GmGLYII-5
Glyma.12 g050800
Glyma.12 g050800.1
12
3651594–3655661
GmGLYII-6
Glyma.13 g261400
Glyma.13 g261400.1
13
36531853–36536326
1134
9
377
41.4
8.87
Cha; PMb, Ecb
GmGLYII-7
Glyma.13 g345400
Glyma.13 g345400.1
13
43601121–43604841
990
7
329
36.3
8.82
Cha,c; Mtb
876
8
291
32.0
7.71
Mta,b
777
7
258
28.7
5.65
Cya,b
546
5
181
20.0
5.84
Cya,b
981
7
326
35.8
9.0
Cha,c; Mtb
948
8
315
34.7
8.88
Cha,c; Mtb
Glyma.13 g345400.2
GmGLYII-8
Glyma.14 g187700
Glyma.14 g187700.1
14
45250598–45254278
Glyma.14 g187700.2
GmGLYII-9
Glyma.15 g028900
Glyma.15 g028900.1
15
2325622–2329211
Glyma.15 g028900.2
GmGLYII-10
Glyma.15 g245500
Glyma.15 g245500.1
15
46785385–46788016
570
5
189
20.8
9.03
Mtb; Ecb
GmGLYII-11
Glyma.18 g163500
Glyma.18 g163500.1
18
37294122–37294499
258
2
85
9.5
6.34
Cyb; Ecb
GmGLYII-12
Glyma.20 g118000
Glyma.20 g118000.1
20
36083279–36091841
1584
12
527
58.8
6.56
Cha; Cyb
1467
12
488
54.5
5.92
Cha; Cyb
1467
12
488
54.5
5.92
Cha; Cyb
Glyma.20 g118000.2
Glyma.20 g118000.3
Ghosh and Islam BMC Plant Biology (2016) 16:87
Table 2 List of identified GLYII genes in Soybean (Glycine max) along with their detailed information and localization
I
Abbreviations: CDS coding DNA sequence, PP polypeptide length, MW molecular weight, P isoelectric point, bp base pair, aa amino acid, kDa kilodalton, Ch chloroplast, Cy cytosol, Ec extracellular, Mt mitochondria,
Nu nucleus
a
Localization prediction by CELLO v.2.5 ( />b
Localization prediction by pSORT ( />c
Chloroplast localization signal confirmed by ChloroP ( />
Page 6 of 25
Ghosh and Islam BMC Plant Biology (2016) 16:87
was greater than the number of genes (Tables 1 and 2);
indicating the existence of alternate splicing event in
soybean glyoxalase genes. Most of the GmGLYI genes
(17 out of 24) and GmGLYII genes (5 out of 12) showed
only a single product. However, rest seven GmGLYI
genes formed 24 alternative spliced products, whereas
seven GmGLYII genes lead to the generation of 18 proteins (Tables 1 and 2).
Detailed analysis of identified GmGLYI and GmGLYII
members
All the newly identified GmGLYI and GmGLYII members were analyzed in detail. The coding DNA sequence
(CDS) length of the GmGLYI members vary from 333 bp
(GmGLYI-12.1) to 1101 bp (GmGLYI-4.1) with an average of 740 bp. Consequently, GmGLYI-4.1 encodes for
the largest protein of the family with a polypeptide
length of 366 aa and molecular weight of 40.6 kDa; and
the smallest protein (GmGLYI-12.1) is 110 aa in length
with 12.8 kDa in weight (Table 1). Similar to the length
and molecular weight variation, the proteins showed a
wide range of deviation in their isoelectric point (pI)
value from 4.86 (GmGLYI-9.1) to 9.69 (GmGLYI-16.3).
Most of the GmGLYI members showed acidic pI value
(less than or around 7), with only seven such as
GmGLYI-1.3, GmGLYI-4.1, GmGLYI-10.5, GmGLYI11.2, GmGLYI-15.1, GmGLYI-16.1, and GmGLYI-16.3
have showed basic pI value (Table 1). This ensures the
presence of both positively and negatively charged
GmGLYI proteins at a certain physiological condition.
Sub-cellular localization of all these predicted GmGLYI
proteins (41) were analyzed based on two different tools
CELLO [23] and Wolf pSORT [24], and the chloroplast
localization was further confirmed by ChloroP [25]. Different members were found to be localized at different
sub-cellular compartments, such as chloroplast, cytosol,
mitochondria, nucleus, extracellular, peroxisome. Most
of the GmGLYI proteins are found to be localized in
cytosol, followed by chloroplast, mitochondria and nucleus (Table 1).
Similarly, the CDS length of GmGLYII transcripts varies from 432 bp (GmGLYII-2.4) to 1584 bp (GmGLYII12.1) with an average of 850 bp (Table 2). The largest
GmGLYII-12.1 protein is 527 aa in length with a molecular weight of 58.8 kDa; and the smallest protein
(GmGLYII-2.4) is 143 aa in length and 15.9 kDa in
weight (Table 2). GmGLYII proteins also show variation
in their pI values ranging from 5.62 (GmGLYII-1.1) to
9.03 (GmGLYII-10.1). Most of the GmGLYII members
(15 out of 23) showed acidic pI value similar to GmGLYI
proteins, while only eight GmGLYII members such as
GmGLYII-2.1, GmGLYII-2.4, GmGLYII-6.1, GmGLYII7.1, GmGLYII-7.2, GmGLYII-9.1, GmGLYII-9.2, and
GmGLYII-10.1 have basic pI value (Table 2). Similar to
Page 7 of 25
GmGLYI, most of the GmGLYII proteins are found to
be localized in cytosol, followed by chloroplast (4), nucleus (3), and mitochondria (2).
Chromosomal distribution and gene duplication
To determine the exact position and distribution of the
identified GmGLYI and GmGLYII genes on different
chromosomes, a detailed chromosome map was constructed. Soybean glyoxalase genes are found to be unevenly distributed throughout the chromosomes. It has
been found that 24 GmGLYI genes are located on 13 different chromosomes (Fig. 1a). The gene density per
chromosome is highly uneven, where Chromosome 9
and 11 contain the maximum occurrence of GLYI genes
(3 each). However, chromosomes 1, 7, 8, 12, 13, 15, 18
have two GLYI genes each, and only one GLYI gene each
is present on chromosomes 4, 5, 6, and 16. No GLYI
gene was found on chromosomes 2, 3, 10, 14, 18, 19 and
20; thereafter not shown in the Fig. 1a. Similarly, 12
GmGLYII genes were found to be located on ten different chromosomes (Fig. 1b) and the gene density per
chromosome is highly uneven. Chromosomes 13 and 15
contain the maximum GLYII genes (2 each), whereas
chromosomes 2, 4, 6, 11, 12, 14, 18, and 20 have only
one GLYII gene each. No GLYII gene was found on the
rest of the chromosomes and as such not shown in the
Fig. 1b. All the GmGLYI and GmGLYII genes were found
to be located towards the chromosome ends (Fig. 1),
suggesting the possibility of inter-chromosomal genetic
rearrangements between different soybean chromosomes
during genome duplication.
Due to two duplication events, soybean genome resulted in many paralogs within a gene family [14]. Out
of the 24 GmGLYI proteins (only the first member in
case of different alternate splice form), 20 are clustered
in pairs (10 pairs) and eight GmGLYII proteins are clustered in pairs (4 pairs) out of a total of 12 GmGLYII proteins in the phylogenetic tree (Additional file 1: Figure
S1). The percentage of similarities between all these
GmGLYI (Additional file 2: Table S1) and GmGLYII
(Additional file 2: Table S2) proteins were combined
separately. It was observed that all the paired members of both GLYI and GLYII family (GmGLYI-1/-11,
GmGLYI-4/-8, GmGLYI-10/-21, GmGLYI-3/-5, GmGLYI14/-15, GmGLYI-18/-23, GmGLYI-2/-13, GmGLYI-17/22, GmGLYI-19/-24 and GmGLYI-6/-9; GmGLYII-4/-5,
GmGLYII-9/-11, GmGLYII-2/-3, GmGLYII-6/-10) have
very high level (more than 90 %) of sequence similarities. This high level of sequence similarities indicates
the possibility of segmental duplication of the genes
throughout evolution. Moreover, among the 24 GmGLYI
genes one gene pair (GmGLYI-14 and GmGLYI-15) was
present continuously (without any gene in between)
within a distance of less than 5 kb (1200 bp exactly) on
Ghosh and Islam BMC Plant Biology (2016) 16:87
Page 8 of 25
chromosome 11. This indicates that these two genes
might be duplicated by tandem duplication (Fig. 1). To
identify the time course of gene duplication, all the identified duplicated gene pairs were analyzed using plant genome duplication database ( />duplication/index/downloads) [26] (Table 3). According to
the ratio of nonsynonymous to synonymous substitutions
(Ka/Ks), the evolutionary history of selection acting on different genes could be measured [17, 27]. This ratio could
be used to interpret the direction and magnitude of natural selection enforcing on the various protein coding
genes. A pair of sequences having Ka/Ks < 1 implies purifying selection; Ka/Ks = 1 indicates both sequences are
drifting neutrally; and lastly Ka/Ks > 1 implies positive or
Darwinian selection [17, 28]. The Ka/Ks of 15 glyoxalase
duplicated gene pairs (Table 3) was found to be less than
0.55; that indicates the influence of purifying selection in
the evolution of these gene pairs. Considering the divergence rate of 6.161029 synonymous mutations per synonymous site per year for soybean [29], the duplication
time for each gene pairs was calculated. It is observed that
all the segmental duplicated pairs showed a time frame
between 3.7 and 18.8 Mya, except the tandem duplicated
pair that occurred 33.9 Mya ago (Table 3).
Phylogenetic analysis of glyoxalase genes from various
plant species
In the present study, a phylogenetic tree of all the identified GmGLYI or GmGLYII proteins along with other reported GLYI or GLYII proteins from other plant species
were constructed using Mega 5.2 tool (Fig. 2). A neighbour joining phylogenetic tree was generated using a total
of 83 full-length GLYI protein sequences of soybean, rice
and Arabidopsis GLYI family, and proteins from other
plant species. The tree was sub-divided into four subfamilies (I to IV) as evident in Fig. 2a. All these subfamilies
consist of representative member from both dicot Arabidopsis and monocot rice, indicating that the evolution of
plant GLYI genes occurred before the split of dicotmonocot. Clade-IV has the largest GLYI members from
different plant species, while clade-II has the lowest number of members only from Arabidopsis and rice genome
(Fig. 2a). Clade-I comprises of GLYI members only from
the complete genome database of three plants, Arabidopsis, rice and soybean. Among them, OsGLYI-10 is functionally a diverge member of the rice GLYI family and
might possess some other activities than GLYI (unpublished data). In clade-III, there are multiple members from
Arabidopsis, rice and soybean; and one member each from
Genlisea aurea and Sorghum bicolor. Among them, three
rice members OsGLYI-2, OsGLYI-7 and OsGLYI-11; and
two members of Arabidopsis AtGLYI-3 and AtGLYI-6
have been already predicted to be Ni2+-dependent GLYI
enzyme [2]. Thus rest of the members of this clade would
be expected to have Ni2+-dependent catalytic activity.
Similarly, clade-IV has members from rice (OsGLYI-8)
and Arabidopsis (AtGLYI-2) which are Zn2+-dependent
GLYI enzymes [2]. Thus rest of the GLYI members from
other species would require Zn2+ for their optimum GLYI
activity. This indicates that Zn2+-dependent GLYI enzymes are more diverse as they are present in many plant
species (Fig. 2a).
To clarify the phylogenetic relationship among GLYII
proteins, we further constructed another tree for all full
length sequences of GmGLYII, OsGLYII, AtGLYII family
and GLYII sequences from other plant species (Fig. 2b).
Table 3 Divergence time between glyoxalase gene pairs in Soybean
Sl. no
Locus 1
Locus 2
ka
ks
ka/ks
Duplication time (Mya)
1
GmGLYI-1
GmGLYI-11
0.0354
0.1246
0.2841
10.2131
Duplication type
2
GmGLYI-2
GmGLYI-13
0.0066
0.0983
0.0671
8.0574
Segmental
3
GmGLYI-3
GmGLYI-5
0.0317
0.0823
0.3852
6.7459
Segmental
4
GmGLYI-4
GmGLYI-8
0.0451
0.1094
0.4122
8.9672
Segmental
5
GmGLYI-6
GmGLYI-9
0.0418
0.1581
0.2644
12.9590
Segmental
6
GmGLYI-10
GmGLYI-21
0.0076
0.0455
0.1670
3.7295
7
GmGLYI-14
GmGLYI-15
.2260
0.4137
0.5463
33.9098
Tandem
8
GmGLYI-17
GmGLYI-22
0.0263
0.1434
0.1834
11.7541
Segmental
9
GmGLYI-18
GmGLYI-23
0.0839
0.1666
0.5036
13.6557
Segmental
10
GmGLYI-19
GmGLYI-24
0.0450
0.1442
0.3121
11.8197
Segmental
11
GmGLYII-1
GmGLYII-8
0.0804
0.1449
0.5549
11.8770
Segmental
12
GmGLYII-2
GmGLYII-3
0.1142
0.1502
0.7603
12.3115
Segmental
13
GmGLYII-4
GmGLYII-5
0.0278
0.1353
0.2055
11.0902
Segmental
14
GmGLYII-6
GmGLYII-10
0.0916
0.229
0.4000
18.7705
Segmental
15
GmGLYII-7
GmGLYII-9
0.0246
0.0767
0.3207
6.2869
Segmental
Segmental
Segmental
Ghosh and Islam BMC Plant Biology (2016) 16:87
Page 9 of 25
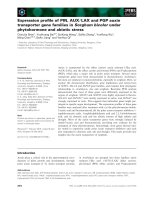
Fig. 2 Phylogenetic analyses of GLYI (a) and GLYII (b) proteins from various plant species. Glyoxalase protein sequences from various plant species
were downloaded from various databases and provided as Additional files 4 and 5. An unrooted tree was generated using Neighbor-Joining method
with 1000 bootstrap by MEGA5.2 software using the full-length amino acid sequences of eighty-three GLYI (a) or forty-one GLYII (b) proteins (only the
first splice variants were taken in case of multiple splice forms). The numbers next to the branch shows the result of 1000 bootstrap replicates
expressed in percentage, and scores higher than 50 % are indicated on the nodes. Both trees were sub-divided into four classes (marked by I to IV)
and indicated by different colours
This tree was subdivided into four classes (I to IV) too like
the previous one. Class-I consists of three proteins from
soybean, and one each from rice (OsGLYII-1) and Arabidopsis (AtGLYII-3). Among them, OsGLYII-1 has been reported to have sulphur dioxygenase (SDO) activity rather
than GLYII [11]. So this sub class of proteins would be
functionally diverse from GLYII. Similarly, class-II contains one protein each from rice (OsGLYII-2), Arabidopsis
(AtGLYII-2), and Selaginella moellendorffii, and four proteins from soybean. AtGLYII-2 has been reported to be
the mitochondrial localized AtGLYII family member [30].
Division of class-III and –IV is more interesting and evolutionarily more significant. Class-III has GLYII proteins
from all monocot plants (rice, Zea mays, Pennisetum,
Brassica, Triticum, Hordeum); while class-IV has exclusively dicot members including Arabidopsis, soybean,
Medicago, lotus etc. (Fig. 2b). Apart from GLYI, GLYII
proteins were found to be diversified after the split of
monocot and dicot.
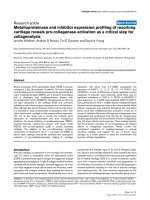
Gene structures of GmGLYI and GmGLYII genes
Detailed analysis of the exon-intron structure of
GmGLYI (Fig. 3a) and GmGLYII (Fig. 3b) genes showed
great variation among themselves. All GmGLYI and
GmGLYII genes contained at least one intron in their
open reading frame (ORF), which means there is no
intron less glyoxalase gene in soybean. The number of
introns varied from 1 to 9 in the ORFs of different
GmGLYI genes (Fig. 3a and Additional file 3: Table S3).
The GmGLYI-6.3, GmGLYI-12, GmGLYI-17, and
GmGLYI-22 contained a single intron in their ORF
while the largest numbers of introns (9) were found in
the GmGLYI-4.2 transcript. In many cases, the borders
of protein-coding sequence, 5′ and 3′ untranslated regions (UTR) also contain large numberof introns [13, 31].
Out of 41 GmGLYI transcripts, there was no intron in the
3′ UTR of any of these genes and only eight of them contained a single intron in their 5′ UTR region. Similarly,
the number of introns varied from 1 to 12 in the ORFs of
different GmGLYII genes (Fig. 3b and Additional file 3:
Table S4). The maximum number of introns (12) was
observed in GmGLYII-12.1, followed by 11 each in
GmGLYII-12.2 and GmGLYII-12.3. GmGLYII-11.1 contained only a single intron in its ORF while the rest
have varied number of introns. Similar to GmGLYI
transcripts, there was no intron in the 3′ UTR of
GmGLYII transcripts. Only six out of 23 transcripts
(GmGLYII-2.2, GmGLYII-2.4, GmGLYII-4.2, GmGLYII6.1, GmGLYII-7.1 and GmGLYII-12.1) have a single intron in their 5′UTR region.
Longer introns are selectively advantageous that
could counterbalance the mutational bias and improve
Ghosh and Islam BMC Plant Biology (2016) 16:87
GmGLYI
a
GmGLYII
b
Page 10 of 25
GmGLYI-1.1
GmGLYI-1.2
GmGLYI-1.3
GmGLYI-2
GmGLYI-3.1
GmGLYI-4.1
GmGLYI-4.2
GmGLYI-5.1
GmGLYI-6.1
GmGLYI-6.2
GmGLYI-6.3
GmGLYI-7.1
GmGLYI-7.2
GmGLYI-7.3
GmGLYI-7.4
GmGLYI-7.5
GmGLYI-7.6
GmGLYI-8.1
GmGLYI-9.1
GmGLYI-10.1
GmGLYI-10.2
GmGLYI-10.3
GmGLYI-10.4
GmGLYI-10.5
GmGLYI-11.1
GmGLYI-11.2
GmGLYI-12.1
GmGLYI-13.1
GmGLYI-14.1
GmGLYI-15.1
GmGLYI-16.1
GmGLYI-16.2
GmGLYI-16.3
GmGLYI-17.1
GmGLYI-18.1
GmGLYI-19.1
GmGLYI-20.1
GmGLYI-21.1
GmGLYI-22.1
GmGLYI-23.1
GmGLYI-24.1
GmGLYII-1
GmGLYII-2.1
GmGLYII-2.2
GmGLYII-2.3
GmGLYII-2.4
GmGLYII-3.1
GmGLYII-4.1
GmGLYII-4.2
GmGLYII-5.1
GmGLYII-5.2
GmGLYII-5.3
GmGLYII-6.1
GmGLYII-7.1
GmGLYII-7.2
GmGLYII-8.1
GmGLYII-8.2
GmGLYII-9.1
GmGLYII-9.2
GmGLYII-10.1
GmGLYII-11.1
GmGLYII-12.1
GmGLYII-12.2
GmGLYII-12.3
0 kb
1 kb
2 kb
3 kb
4 kb
5 kb
6 kb
7 kb
8 kb
9 kb
10 kb
Fig. 3 Gene structures of GmGLYI (a) and GmGLYII (b) family members including the alternative spliced forms. All the exons are shown in filled
black boxes and the introns are indicated by black lines. The 5’-UTR regions are shown using empty boxes and the 3’-UTR regions are shown in
empty arrows which also indicate the direction of the gene. Left to right direction of transcript indicates “+” strand, while the right to left one
indicates “-” strand, relative to the annotation of the genome sequence. The size of the introns, exons, and UTRs could be estimated from the
scale at the bottom
the recombination frequency [32]. A strong evidence
for the presence of ancestral introns was reported by
analyzing introns of animal, plant and fungus [33].
Moreover, the number of exons and introns were found
to be similar in the paralogous genes (Fig. 3) that clustered together in the phylogenetic analysis (Additional
file 1: Figure S1). Such as, GmGLYI-1/-11, GmGLYI-4/8, GmGLYI-10/-21, and GmGLYI-6/-9 have the same
number of introns and exons.
Analysis of GmGLYI proteins for their domain architecture,
catalytic conservance and metal ion dependency
All the predicted GmGLYI (41) proteins were analyzed using Pfam to reveal the presence of conserved
glyoxalase domain (PF00903) among them. Analyses
of GmGLYI proteins revealed that 21 out of forty-one
contains two GLYI domains, while the rest 20 have
only single GLYI domain (Fig. 4). Presence of two
GLYI domain in a single protein have been previously
Two GLYI domain containing proteins (21)
Ghosh and Islam BMC Plant Biology (2016) 16:87
Page 11 of 25
GmGLYI-1.1 1
83
206
216
336
347
GmGLYI-1.2 1
83
204
214
334
345
GmGLYI-1.3 1
83
206
214
GmGLYI-3.1 1
84
335
100
221
231
GmGLYI-4.2 1
100
221
231
GmGLYI-7.1 1
14
145
135
GmGLYI-7.2 1 1
232
135
145
GmGLYI-7.4 1
14
135
145
269
GmGLYI-7.5 1
14
135
145
269
GmGLYI-7.6 1
GmGLYI-8.1 1
14
135
145
GmGLYI-10.3 1
21
215
GmGLYI-10.4 1
21
151
152
142
152
313
285
274
205
215
GmGLYI-11.2 1
84
205
215
142
19
GmGLYI-6.2* 1 1
83
87
2
GmGLYI-9.1 1
14
GmGLYI-12.1 1
15
GmGLYI-13.1 1
141
142
77
171
21
204
129
GmGLYI-20.1 1
19
133
GmGLYI-22.1 1
17
129
235
209
167
173
182
201 206
85
GmGLYI-23.1 1
222
184
133
15
GmGLYI-19.1 1
233
185
88
GmGLYI-18.1 1
248
219
172 174
77
GmGLYI-16.3 1
GmGLYI-17.1 1
0 aa
192
233
27
GmGLYI-16.2 1
263
126
75
GmGLYI-16.1 1
GmGLYI-24.1 1
252
172
66
GmGLYI-15.1 1
285
110
24
GmGLYI-14.1 1
346
272
122
133
64
316
192
133
GmGLYI-6.3* 1
269
276
141
GmGLYI-6.1 1
279
335
152
142
24
296
311
84
356
324
287
189
GmGLYI-11.1 1
GmGLYI-2.1 1
GmGLYI-5.1 1
345
225
276
179
21
280
272
189
161
142
58
GmGLYI-10.5 1
280
267
179
30
GmGLYI-10.2 1
264
253
94
366
280
243
14
58
366
351
GmGLYI-7.3 1
GmGLYI-10.1 1
346
349
269
108
98
309
215
GmGLYI-4.1 1
GmGLYI-21.1 1
One GLYI domain containing proteins (20)
205
252
9
134
100 aa
145
200 aa
300 aa
400 aa
Fig. 4 Domain architectures of GmGLYI proteins. All forty-one soybean GLYI proteins were analyzed for the presence of functional domain(s)
using pfam ( All the GmGLYI proteins possess glyoxalase domain (PF00903) that is represented by boxes. The
position of the domain(s) is indicated by the amino acid number inside the box. Among the 41 GmGLYI members, 20 of them have single
glyoxalase domain, whereas rest 21 have two domains. The length of full proteins is indicated by exact amino acid numbers and relative position
of the domains could be interpreted by the scale given below
reported from Saccharomyces cerevisiae [34], Oryza
sativa [12] and Plasmodium falciparum [35]. Presence
of two domain forms two putative active sites on a
single monomeric protein. Both the active sites are
found to be functional, but allosterically regulated in
Plasmodium falciparum [35], whereas one of the active site is found to be a pseudo-active site in Oryza
sativa [12]. However, GLYI proteins with single domain have also been reported from various species
such as E. coli [36], H. sapiens [37] and function as
homo-dimer.
Activity of GLYI enzyme is highly dependent on divalent
metal ions [2]. On the basis of metal ion specificity GLYI
proteins could be divided into two classes; Zn2+-dependent
or Zn2+-independent (mainly Ni2+/Co2+-dependent). GLYI
from Homo sapiens, Saccharomyces cerevisiae and Pseudomonas putida have been reported as Zn2+-dependent
[38–40], whereas GLYI from E. coli and one of the rice
Ghosh and Islam BMC Plant Biology (2016) 16:87
GLYI (OsGLYI-11.2) showed Ni2+-dependent activity
[12, 36]. The metal dependency of the GLYI enzymes
could be easily predicted from the length of GLYI domain,
as Ni2+-dependent GLYI has a domain length of ~120 aa
and Zn2+-dependent GLYIs are usually 142 aa in length
[2]. Irrespective of the metal ion dependency, the active
site of GLYI proteins has a conserved motif of H/QEH/
QE. Among them, the glutamate residues act as a base by
accepting protons from the substrate and any mutation of
this conserved residue resulted in the complete loss of
activity [12, 41]. Thus, to comment on the presence of
enzymatic activity and metal ion dependency, GLYI domain (only N-terminal one in case of two domain containing members) of all the putative GmGLYI proteins
were aligned (Fig. 5) along with known Ni2+-dependent
OsGLYI-11.2 and Zn2+-dependent OsGLYI-8 [2] proteins. All the metal binding sites were presented inside
black boxes and the regions specific for Zn2+-dependent
GLYI were presented by black arrows (Fig. 5).
Based on the presence of all the four conserved metal
binding site, the expected GLYI enzyme activity of the putative GmGLYI proteins was predicted (Table 4). Out of a
total 41 putative GmGLYI proteins, 20 have all the four
conserved residues and are expected to have functional
GLYI enzyme activity (Fig. 5 and Table 4). Out of this 20
expected functional GLYI enzymes, 16 are predicted to be
Ni2+-dependent as they have the domain length of
around 120 aa and lack of the conserved regions
Page 12 of 25
specific for Zn2+-dependent members. The remaining
four namely GmGLYI-14.1, GmGLYI-15.1, GmGLYI-16.1
and GmGLYI-16.2 are expected to be Zn2+-dependent as
their domain length is more than 145 aa and possessed
the conserved regions (Fig. 5 and Table 4).
Analysis of GmGLYII proteins for their domain architecture
and catalytic efficiency
Genome wide analysis of soybean revealed the presence of
23 GLYII proteins coded by 12 genes (Table 2). All these
GmGLYII proteins were analyzed using Pfam to reveal the
presence of conserved metallo-beta-lactamase domain
(PF00753) among them. Analysis of all GmGLYII proteins
revealed that 12 out of 23 have only metallo-betalactamase domain, while the rest eleven contain additional
Hydroxyacylglutathione hydrolase C-terminus (HAGH-C)
domain (PF16123) along with metallo-beta-lactamase domain (Fig. 6). HAGH-C domain is usually found to be
present at the C-terminus of GLYII enzymes that forms
the substrate binding site along with the catalytic domain (PF00753) [42]. However, GLYII from various species such as E. coli, S. cerevisiae, S. typhimurium, L.
infantum, A. thaliana, B. juncea, O. sativa and H. sapiens, contained the well conserved metal binding motif
(THXHXDH) and active site motif (C/GHT) [9]. Both
these motifs play an important role in the GLYII enzyme activity of a protein. Therefore, to comment on
the presence of enzymatic activity of the putative
OsGLYI-11.2
OsGLYI-8
GmGLYI-1.1
GmGLYI-1.2
GmGLYI-1.3
GmGLYI-2.1
GmGLYI-3.1
GmGLYI-4.1
GmGLYI-4.2
GmGLYI-5.1
GmGLYI-6.1
GmGLYI-6.2
GmGLYI-6.3
GmGLYI-7.1
GmGLYI-7.2
GmGLYI-7.3
GmGLYI-7.4
GmGLYI-7.5
GmGLYI-7.6
GmGLYI-8.1
GmGLYI-9.1
GmGLYI-10.1
GmGLYI-10.2
GmGLYI-10.3
GmGLYI-10.4
GmGLYI-10.5
GmGLYI-11.1
GmGLYI-11.2
GmGLYI-12.1
GmGLYI-13.1
GmGLYI-14.1
GmGLYI-15.1
GmGLYI-16.1
GmGLYI-16.2
GmGLYI-16.3
GmGLYI-17.1
GmGLYI-18.1
GmGLYI-19.1
GmGLYI-20.1
GmGLYI-21.1
GmGLYI-22.1
GmGLYI-23.1
GmGLYI-24.1
Consensus
Fig. 5 Multiple sequence alignment of GLYI domain of all GmGLYI proteins along with that of OsGLYI-11.2 and OsGLYI-8. GLYI domain (N-terminal
one in case of two domain containing proteins) of all GmGLYI proteins were aligned with that of a Ni2+-dependent OsGLYI-11.2 and a Zn2+-dependent
OsGLYI-8 using ClustalW program. The alignment file was viewed using Jalview multiple alignment editor program. All four conserved metal binding
sites were represented as black boxes and the specific region for Zn2+-dependent GLYI was marked with black arrow
Ghosh and Islam BMC Plant Biology (2016) 16:87
Page 13 of 25
Table 4 Analysis of all putative GmGLYI enzymes for their enzymatic activity and metal ion dependency
Sl. no
Proteins
Metal binding sites
H/Q
E
H/Q
E
Expected GLYI
enzyme activity
Length of GLYI
domain (aa)
Metal ion
dependency
1
GmGLYI-1.1
√
√
√
√
Present
124
Ni
2
GmGLYI-1.2
√
√
√
√
Present
122
Ni
3
GmGLYI-1.3
√
√
√
√
Present
124
Ni
4
GmGLYI-2.1
√
√
√
√
Present
125
Ni
5
GmGLYI-3.1
√
√
√
√
Present
122
Ni
6
GmGLYI-4.1
√
√
√
√
Present
122
Ni
7
GmGLYI-4.2
√
√
√
√
Present
122
Ni
8
GmGLYI-5.1
√
√
√
—
Absent
115
-
9
GmGLYI-6.1
√
—
√
√
Absent
121
-
10
GmGLYI-6.2
—
—
√
√
Absent
83
-
11
GmGLYI-6.3
—
—
√
√
Absent
87
-
12
GmGLYI-7.1
√
√
√
—
Absent
122
-
13
GmGLYI-7.2
—
√
√
—
Absent
98
-
14
GmGLYI-7.3
√
√
√
—
Absent
122
-
15
GmGLYI-7.4
√
√
√
—
Absent
122
-
16
GmGLYI-7.5
√
√
√
—
Absent
122
-
17
GmGLYI-7.6
√
√
√
—
Absent
122
-
18
GmGLYI-8.1
√
√
√
√
Present
122
Ni
19
GmGLYI-9.1
√
—
√
√
Absent
120
-
20
GmGLYI-10.1
√
√
√
√
Present
122
Ni
21
GmGLYI-10.2
√
√
√
√
Present
122
Ni
22
GmGLYI-10.3
√
√
√
√
Present
122
Ni
23
GmGLYI-10.4
√
√
√
√
Present
122
Ni
24
GmGLYI-10.5
√
√
√
√
Present
122
Ni
25
GmGLYI-11.1
√
√
√
√
Present
122
Ni
26
GmGLYI-11.2
√
√
√
√
Present
122
Ni
27
GmGLYI-12.1
√
—
—
—
Absent
50
-
28
GmGLYI-13.1
√
—
√
√
Absent
125
-
29
GmGLYI-14.1
√
√
√
√
Present
169
Zn
30
GmGLYI-15.1
√
√
√
√
Present
145
Zn
31
GmGLYI-16.1
√
√
√
√
Present
146
Zn
32
GmGLYI-16.2
√
√
√
√
Present
145
Zn
33
GmGLYI-16.3
√
√
—
—
Absent
96
-
34
GmGLYI-17.1
√
—
√
√
Absent
119
-
35
GmGLYI-18.1
√
—
√
√
Absent
117
-
36
GmGLYI-19.1
√
—
√
√
Absent
121
-
37
GmGLYI-20.1
√
—
√
√
Absent
121
-
38
GmGLYI-21.1
√
√
√
√
Present
122
Ni
39
GmGLYI-22.1
√
—
√
√
Absent
119
-
40
GmGLYI-23.1
√
—
√
√
Absent
117
-
41
GmGLYI-24.1
√
—
√
—
Absent
126
-
Ghosh and Islam BMC Plant Biology (2016) 16:87
Only GLYII domain
containing proteins (12)
GmGLYII-1.1 1
9
GmGLYII-2.2 1
9
85
GmGLYII-2.3 1
9
85
181
161
136
49
GmGLYII-6 1
143
11
174
185
28
GmGLYII-11.1 1 2
71
377
313
141
181
189
85
GmGLYII-12.1 1
225
393
GmGLYII-12.2 1
225
393
488
GmGLYII-12.3 1
225
393
488
GmGLYII-3.1 1 1
54
244
166
230
71
GmGLYII-4.1 1
GLYII+ HAGH-C domain
containing proteins (11)
199
85
GmGLYII-2.4* 1
GmGLYII-10.1 1
202
118
25
GmGLYII-2.1 1
GmGLYII-8.2 1
Page 14 of 25
201
42
GmGLYII-4.2 1
258
315
231
202
286
315
286
GmGLYII-5.1 1
72
231
232
316
316
GmGLYII-5.2 1
71
230
231
315
315
GmGLYII-5.3 1
71
GmGLYII-8.1 1
GmGLYII-9.1 1
GmGLYII-9.2 1
0 aa
206
11
174
241
230
100 aa
200 aa
329
329
291
258
256
83
72
291
207
175
307
245
244
48
GmGLYII-7.2 1
231 274
230
86
GmGLYII-7.1 1
527
242
231
326
315
300 aa
326
315
400 aa
500 aa
600 aa
Fig. 6 Domain architectures of GmGLYII proteins. All 23 soybean GLYII proteins were analyzed for the presence of functional domain(s) using pfam.
There were two types of domains observed in GmGLYII proteins, such as β-lactamase domains (represented by box) and hydroxyacylglutathione
hydrolase C-terminus (HAGH-C) domain (represented by circle). The length of full protein and domain(s) are indicated by exact amino acid numbers
beside and inside of the shape, respectively. The relative size could be identified by using the scale below
GmGLYII proteins, their protein sequences were
aligned by multiple sequence alignment (Fig. 7). Both
these motifs were indicated by black boxes (Fig. 7);
their presence and absence were listed in Table 5.
Out of 23 putative GmGLYII proteins only three of
them do not possess the conserved metal binding
residues, but all of them have the active site motif
(Fig. 7 and Table 5). Thus, it could be expected that
all the predicted GmGLYII proteins have the functional GLYII enzyme activity except GmGLYII-1.1,
GmGLYII-2.4, and GmGLYII-11.1 (Table 5).
Homology modelling of representative GmGLYI and
GmGLYII members
To know the arrangement of active site residues and
overall 3-D coordination, homology model of
GmGLYI-3, GmGLYI-16 and GmGLYII-5 proteins
was built (Fig. 8) based on the closely related template structure of Zea mays GLYI (PDB: 5D7Z) [43],
mouse GLYI (PDB: 4OPN), and AtGLYII-2 (PDB: 2Q42)
[30] proteins, respectively. GmGLYI-3 is a Ni2+-dependent
monomeric GLYI enzyme (Fig. 8a), while GmGLYI-16
is a Zn2+-dependent homodimeric enzyme (Fig. 8b).
GmGLYI-3 has two putative active sites; one consists
of H-156, E-204, Q-217 and E-268, and the other one
consists of H-87, E-138, Q-286 and A-334. The second
putative active site has lack of a highly conserved Glu residues, thus might be inactive in nature like previously
reported OsGLYI-11.2 [12]. The Zn2+-dependent
GmGLYI-16 consists of single GLYI domain (Fig. 4)
and thus forms homo-dimer to create two putative
active sites (Fig. 8b). One putative active site has
Q80 and E146 (from one chain, A) and H174 and
E220 (from another chain, B); another one has opposite members from both chains. Here both the active sites have all four conserved residues and thus
are predicted to be functionally active too. On the
other hand, GmGLYII-5 is a monomeric protein consists of two structural orientations, an N-terminal
domain (L63 to D193) with two βββαβ topology and
a C-terminal domain (T194 to F316) with five αhelices (Fig. 8c). The metal binding and active site
residues are Asn116, His118, Asp120, His121,
His174, Asp193 and His231 (Fig. 8c) are found to be
conserved as compared to template AtGLYII-2
protein.
Ghosh and Islam BMC Plant Biology (2016) 16:87
Page 15 of 25
GmGLYII-1.1
GmGLYII-2.1
GmGLYII-2.2
GmGLYII-2.2
GmGLYII-2.4
GmGLYII-3.1
GmGLYII-4.1
GmGLYII-4.2
GmGLYII-5.1
GmGLYII-5.2
GmGLYII-5.3
GmGLYII-6.1
GmGLYII-7.1
GmGLYII-7.2
GmGLYII-8.1
GmGLYII-8.2
GmGLYII-9.1
GmGLYII-9.2
GmGLYII-10.1
GmGLYII-11.1
GmGLYII-12.1
GmGLYII-12.2
GmGLYII-12.3
Consensus
GmGLYII-1.1
GmGLYII-2.1
GmGLYII-2.2
GmGLYII-2.2
GmGLYII-2.4
GmGLYII-3.1
GmGLYII-4.1
GmGLYII-4.2
GmGLYII-5.1
GmGLYII-5.2
GmGLYII-5.3
GmGLYII-6.1
GmGLYII-7.1
GmGLYII-7.2
GmGLYII-8.1
GmGLYII-8.2
GmGLYII-9.1
GmGLYII-9.2
GmGLYII-10.1
GmGLYII-11.1
GmGLYII-12.1
GmGLYII-12.2
GmGLYII-12.3
Consensus
Fig. 7 Multiple sequence alignment of GmGLYII proteins. All GmGLYII full length protein sequences were aligned using ClustalW program and
viewed using Jalview multiple alignment editor program. The black boxes indicate the most conserved metal binding motif (THHHXDH) and
active site motif (G/CHT)
Expression analysis of GmGLYI and GmGLYII genes at
different soybean tissues
RNA-Seq Atlas of Glycine max provides high-resolution
gene expression data in a diverse set of 14 soybean tissues such as young leaf, flower, one cm pod (7 days after
flowering, DAF), pod-shell(10 DAF and 14 DAF), seed
(10, 14, 21, 25, 28 and 35 DAF), root and nodule. All
these tissues could be broadly divided into three classes;
such as underground, aerial and seed. RNA-seq normalized expression data for all GmGLYI and GmGLYII genes
were retrieved from soybase ( />soyseq/), except GmGLYI-14 and GmGLYI-15 due to
lack of their appropriate probe (Additional file 2:
Table S5). Data were analyzed and represented as heat
maps generated using TIGR MeV software package
(Fig. 9a and b). Expression analyses of all GmGLYI
genes revealed that the different members have different
tissue specific expression. Among all the 22 analyzed
genes, GmGLYI-7 showed highest level of constitutive expression in all the tissues, followed by GmGLYI-21,
GmGLYI-10 and GmGLYI-6. This high level of constitutive expression indicates their significant role at all these
plant tissues (Fig. 9a). A cluster of genes showed
medium to high level of expression in all the underground and aerial tissues only, followed by very low
expression at the seed tissues. They are GmGLYI-2,
GmGLYI-13, GmGLYI-17, GmGLYI-8, GmGLYI-4 and
GmGLYI-16. Previous studies on rice and Arabidopsis
showed the presence of highly seed specific GLYI
genes such as AtGLYI-8, OsGLYI-3 and OsGLYI-10
[12]. Similarly, three of GmGLYI genes such as
GmGLYI-1, GmGLYI-11 and GmGLYI-22 showed
medium level of expression in different seed tissues
only (Fig. 9a), indicating the evolutionary conservance
for the presence of seed specific GLYI genes.
Expression analyses of GmGLYII genes indicate two
clear clades (Fig. 9b). Out of 12 analyzed genes, five
genes such as GmGLYII-1, GmGLYII-2, GmGLYII-3,
GmGLYII-10 and GmGLYII-11 showed almost undetectable expression in all the tissues with few exceptions.
Among others, GmGLYII-8 showed highest level of constitutive expression in all the tissues, followed by
GmGLYII-6. These two genes might play a major role in
all tissues. Similar to GmGLYI, a cluster of genes
Ghosh and Islam BMC Plant Biology (2016) 16:87
Page 16 of 25
Table 5 Sequence analyses of all putative GmGLYII proteins for the presence of conserved motifs and enzyme activity
Sl. no
Proteins
Conserved metal binding motif (THHHXDH)
Active site motif (C/GHT)
Expected GLYII enzyme activity
1
GmGLYII-1.1
Absent
Present
No
2
GmGLYII-2.1
Present
Present
Yes
3
GmGLYII-2.2
Present
Present
Yes
4
GmGLYII-2.3
Present
Present
Yes
5
GmGLYII-2.4
Absent
Present
No
6
GmGLYII-3.1
Present
Present
Yes
7
GmGLYII-4.1
Present
Present
Yes
8
GmGLYII-4.2
Present
Present
Yes
9
GmGLYII-5.1
Present
Present
Yes
10
GmGLYII-5.2
Present
Present
Yes
11
GmGLYII-5.3
Present
Present
Yes
12
GmGLYII-6.1
Present
Present
Yes
13
GmGLYII-7.1
Present
Present
Yes
14
GmGLYII-7.2
Present
Present
Yes
15
GmGLYII-8.1
Present
Present
Yes
16
GmGLYII-8.2
Present
Present
Yes
17
GmGLYII-9.1
Present
Present
Yes
18
GmGLYII-9.2
Present
Present
Yes
19
GmGLYII-10.1
Present
Present
Yes
20
GmGLYII-11.1
Absent
Present
No
21
GmGLYII-12.1
Present
Present
Yes
22
GmGLYII-12.2
Present
Present
Yes
23
GmGLYII-12.3
Present
Present
Yes
a
b
N229.B
c
L345
E220.B
E138
L63
A334
H66.B
H87 Q286
N116 H121 H118
E146.A
D120
H174.B
Q80.A
D193
F75
H231
H156
H174
Q217
Q80.B
H174.A
E220.A
E204
L63.A
E146.B
E268
F316
I227.A
Fig. 8 Three dimensional homology model structure of soybean glyoxalase proteins. Structures of GmGLYI-3 (a), GmGLYI-16 (b) and GmGLYII-5 (c)
were built using Swiss-model server based on available close similar structure from Protein Data Bank (PDB) Zea mays GLYI (5D7Z), mouse GLYI (4OPN),
and AtGLYII-2 (2Q42) proteins, respectively. All the α-helices were marked with orange colour, while β-sheets were marked with cornflower blue. The
active sites residues were identified based on the alignment with template structure and shown by ball-stick model. The structure and active residues
were visualized and generated using chimera program
Ghosh and Islam BMC Plant Biology (2016) 16:87
GmGLYII-12
GmGLYII-7
GmGLYII-8
GmGLYII-5
GmGLYII-4
GmGLYII-9
GmGLYII-6
GmGLYII-2
GmGLYII-11
GmGLYII-10
GmGLYII-1
GmGLYII-3
0.0
0.5
2.0
Dry seeds
Early
maturation
Cotyledon
Heart
Globular
Flower buds
Leaf
Stem
Seedlings
c
Root
S, 42DAF
S, 35 DAF
S, 28 DAF
S, 25 DAF
S, 21 DAF
S, 14DAF
S, 10 DAF
PS, 14 DAF
PS, 10DAF
Flower
P, 1cm
GmGLYI-7
GmGLYI-6
GmGLYI-10
GmGLYI-21
GmGLYI-20
GmGLYI-2
GmGLYI-13
GmGLYI-8
GmGLYI-16
GmGLYI-17
GmGLYI-4
GmGLYI-23
GmGLYI-9
GmGLYI-22
GmGLYI-5
GmGLYI-3
GmGLYI-18
GmGLYI-1
GmGLYI-11
GmGLYI-12
GmGLYI-19
GmGLYI-24
b
Reproductive stages
Vegetative stages
Seed
Aerial
Young Leaf
Nodule
a
Root
Underground
Page 17 of 25
GmGLYI-7
GmGLYI-8
GmGLYI-10
GmGLYI-6
GmGLYI-21
GmGLYI-2
GmGLYI-13
GmGLYI-9
GmGLYI-22
GmGLYI-19
GmGLYI-17
GmGLYI-20
GmGLYI-1
GmGLYI-5
GmGLYI-11
GmGLYI-3
GmGLYI-18
GmGLYI-4
GmGLYI-16
GmGLYI-23
GmGLYI-12
GmGLYI-24
d
GmGLYII-2
GmGLYII-3
GmGLYII-10
GmGLYII-1
GmGLYII-11
GmGLYII-4
GmGLYII-5
GmGLYII-7
GmGLYII-9
GmGLYII-6
GmGLYII-8
GmGLYII-12
0.0
2.0
4.0
Fig. 9 Expression profiling of Soybean glyoxalase genes with hierarchical clustering in different developmental tissues and stages. a, b RNA-seq
expression data of 14 developmental tissues, such as R (root), N (nodule), YL (young leave), F (flower), P.1 cm (one cm pod), PS.10d (pod shell
10DAF), PS.14d (pod shell 14DAF), S.10d (seed 10DAF), S.14d (seed 14 DAF), S.21d (seed 21DAF), S.25d (seed 25DAF), S.28d (seed 28DAF), S.35d
(seed 35DAF), S.42d (seed 42DAF) was used in the analysis. The normalized data was downloaded from soybase ( and
provided as Additional file 2: Table S5. Heatmap generation and hierarchical clustering was performed using MeV software package. The colour scale
below the heat map indicates expression values; green indicates low transcript abundance while red indicates high level of transcript abundance. c, d
Transcriptome data of all GmGLYI and GmGLYII genes at various developmental stages (indicated at the top of each lane) were obtained from
the National Center for Biotechnology Information ( Heatmaps generation and
hierarchical clustering were performed using MeV software package. The colour scale given below the heat map indicates the expression
values where blue indicates low transcript abundance and yellow indicates high transcript abundance
(GmGLYII-4, GmGLYII-5, GmGLYII-7, and GmGLYII12) showed medium level of expression in the underground and aerial tissues, except the seed (Fig. 9b). No
tissue specific expression pattern was observed in case
of GmGLYII genes.
From the expression data analysis of the identified
paralogous pairs of GmGLYI and GmGLYII genes in 14
soybean tissues revealed a high level of expression divergence. For example, GmGLYI-6 showed high level
constitutive expression while its paralogous GmGLYI-9
showed detectable expression in a few tissues. However,
some of the paralogous GmGLYI gene pairs namely
GmGLYI-1/-11, GmGLYI-2/-13, GmGLYI-4/-8, GmGLYI10/-21, and GmGLYI-19/-24 showed similar pattern of expression. The divergence is even more in case of GmGLYII
gene pairs. For instance, GmGLYII-8 is highly expressed in
all the analyzed tissues while its paralogous counterpart
GmGLYII-1 remains mostly undetectable. Similar level of
deviation was also observed in case of GmGLYII-6/-10and
GmGLYII-7/-9 gene pairs.
Expression analysis of GmGLYI and GmGLYII genes at
different developmental stages
Expression of GmGLYI and GmGLYII genes at different
developmental stages was analyzed using publicly-available
genome-wide transcript profiling data of soybean (http://
www.ncbi.nlm.nih.gov/geo/query/acc.cgi?acc=GSE29163).
The dataset contains mainly two broad developmental
sets, one at vegetative stages (roots, seedlings, stems,
leaves) and the other at reproductive stage (floral buds,
Ghosh and Islam BMC Plant Biology (2016) 16:87
Page 18 of 25
different stages of seed development- globular, heart, cotyledon, early-maturation, dry). As shown in Fig. 9c, most of
the GmGLYI genes showed high level of expression, without any distinct pattern of expression. Out of the 24
GmGLYI genes, only GmGLYI-12 showed undetectable expression at all stages. Among others, GmGLYI-7 showed
maximum constitutive expression in all the developmental
stages followed by GmGLYI-21, GmGLYI-6, GmGLYI-10
and GmGLYI-8 (Fig. 9c). Two of GmGLYI members,
GmGLYI-22 and GmGLYI-9 showed only reproductive
stage specific expression. This indicates the development
specific modulation of GmGLYI gene expression.
On the other hand, a distinct division is observed in
the GmGLYII gene expression through the developmental stages (Fig. 9d). A cluster of genes such as GmGLYII1, GmGLYII-2, GmGLYII-3, GmGLYII-6, GmGLYII-10,
and GmGLYII-11 showed either undetectable or very
low level of expression in both vegetative and reproductive phases. However, rest of the GmGLYII members
showed medium to high level of expression in all the developmental stages constitutively (Fig. 9d). High level of
expression of both GmGLYI and GmGLYII genes in all
the developmental stages of soybean indicates the constitutive metabolic/cellular role of glyoxalase pathway
throughout the life cycle of plant.
c
Drought
Control
GmGLYI-20
GmGLYII-4
-1
GmGLYII-5
-2
GmGLYII-9
GmGLYII-10
Tubulin
d
1
0.5
0
GmGLYII-12
GmGLYII-11
GmGLYII-10
GmGLYII-9
GmGLYII-8
GmGLYII-7
GmGLYII-6
GmGLYII-5
GmGLYII-4
GmGLYII-3
GmGLYII-2
GmGLYII-1
-0.5
-1
ABA
GmGLYI-6
0
-1.5
Drought
GmGLYI-16
1
b 1.5
Salinity
GmGLYI-3
2
-3
Fold change in expression
Salinity
3
GmGLYI-1
GmGLYI-2
GmGLYI-3
GmGLYI-4
GmGLYI-5
GmGLYI-6
GmGLYI-7
GmGLYI-8
GmGLYI-9
GmGLYI-10
GmGLYI-11
GmGLYI-12
GmGLYI-13
GmGLYI-14
GmGLYI-15
GmGLYI-16
GmGLYI-17
GmGLYI-18
GmGLYI-19
GmGLYI-20
GmGLYI-21
GmGLYI-22
GmGLYI-23
GmGLYI-24
Fold change in expression
4
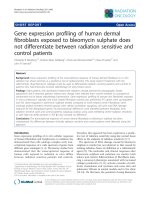
To gain deep insights into the function of glyoxalase
genes in the abiotic stress adaptation of soybean, the expression profiles of all GmGLYI and GmGLYII genes
were analyzed in response to salinity and drought
stresses using publicly available microarray data. Expression data sets were retrieved from gene expression
omnibus database of GSE41125 and GSE40627 for salinity and drought stress, respectively. Data were not available for all these genes due to the limitation of
respective probes. Among the total of 24 GmGLYI and
12 GmGLYII genes; data for 19 GmGLYI and eight
GmGLYII genes were analyzed for salinity, while expression data of 21 GmGLYI and 12 GmGLYII genes were
found for drought stress. Different glyoxalase members
responded differentially in terms of their expression towards both these stresses (Fig. 10a and b). In response
to salinity stress, four GmGLYI genes and two GmGLYII
genes showed up-regulation, while seven GmGLYI genes
and four GmGLYII genes showed down-regulation and
rest of them remained unaltered (Fig. 10a and b). Similarly, drought stress causes upregulation of seven
GmGLYI genes and five GmGLYII genes, and downregulation of eight GmGLYI genes and six GmGLYII
Fold change in expression
a
Expression analysis of soybean glyoxalase genes under
stress
Salinity
0.6
Drought
ABA
0.4
0.2
0.0
-0.2
-0.4
-0.6
I-3
I-6
I-16 I-20
II-4
II-5
II-9 II-10
Fig. 10 Expression analyses of soybean glyoxalase genes in response to salinity, drought and hormonal treatment. Relative expression data of all
available GmGLYI (a) and GmGLYII (b) genes under salinity and drought stresses were obtained from the National Center for Biotechnology
Information GEO database ( Expression data is presented as fold-change by comparing with the corresponding
mock samples. Blue colour bar represents data for salinity stress, while red colour indicates drought stress. c Semiquantitative RT-PCR of four
GmGLYI genes (GmGLYI-3, GmGLYI-6, GmGLYI-16 and GmGLYI-20), four GmGLYII genes (GmGLYI-4, GmGLYI-5, GmGLYI-9 and GmGLYI-10) and one
house-keeping control gene, Tubulin under different conditions such as control, salinity, drought and ABA treatment. d Relative expression analysis
of the representative eight glyoxalase genes were analyzed by measuring the PCR band intensity using Image J software and represent as relative
fold change in expression
Ghosh and Islam BMC Plant Biology (2016) 16:87
genes (Fig. 10a and b). Among 24 GmGLYI genes;
GmGLYI-6 and GmGLYI-9 showed significant upregulation, while other two of them (GmGLYI-3 and
GmGLYI-10) showed down-regulation in both the
stresses (Fig. 10a). In case of GmGLYII; GmGLYII-4 and
GmGLYII-5 showed up-regulation, while GmGLYII-10
showed significant down-regulation in both salinity and
drought stresses (Fig. 10b). Rest of the members of both
GmGLYI and GmGLYII family showed variable expression pattern. This indicates diverse role of different
glyoxalase members in the stress modulation pathways
of soybean plant.
To screen the role of soybean glyoxalase genes in response to salinity, drought and hormonal treatment
(Abscisic Acid, ABA), a semi quantitative RT-PCR was
performed to validate four candidate GmGLYI genes
(GmGLYI-3, −6,-16 and −20) and four candidate
GmGLYII genes (GmGLYII-4, −5,-9 and −10) which were
highly responsive in microarray data analysis (Fig. 10a
and b). For this purpose, 15 days old soybean seedlings
were subjected to normal water (as control), 200 mM
NaCl (for salinity) or withdrawn of water (for drought)
or 10 mM ABA (for hormonal treatment) for 8 h. Expression of all the candidate genes were compared with
that of Tubulin (act as a house-keeping control gene)
(Fig. 10c). Relative transcript abundance of all these
transcripts was measured by scanning the gel image
using Image J software relative fold change in expression
was calculated considering Tubulin as internal control
(Fig. 10d). It could be clearly inferred from Fig. 10d that
GmGLYI-6, GmGLYII-4 and GmGLYII-5 showed strong
up-regulation in response to both salinity and drought,
while GmGLYI-20, GmGLYII-9 and GmGLYII-10 showed
clear down-regulation (Fig. 10d). The remaining two
members, GmGLYI-3 and GmGLYI-16 showed slight up/
down regulation as compared to control sample. Overall,
the pattern of expression of these eight candidate genes
(Fig. 10c) was found to be almost similar to that of
microarray data (Fig. 10a and b).
Identification of cis-elements in the promoter region of
soybean glyoxalase genes
In order to comment on stress responsive expression of
GmGLY genes in response to salinity, drought and ABA
treatment, 1 kb upstream promoter region of each
GmGLYI and GmGLYII genes were retrieved from soybase ( />and analyzed for the presence of cis-acting elements
using PlantCARE [44]. This analysis leads to the identification of several stress-responsive cis elements such as
abscisic acid responsive element (ABRE), auxin responsive element (AuxRR-core), fungal elicitor responsive
element (BOX-W1), ethylene responsive element (ERE),
gibberellin-responsive element (GARE), heat shock
Page 19 of 25
element (HSE), jasmonate and elicitor responsive element (JERE), low temperature responsive element (LTR),
MYB-binding site (MBS), defence and stress responsive
element (TC-rich), wounding and pathogen responsive
elements (W-box and WUN-motif ), salicylic acid responsive element (TCA), Methyl jasmonate-responsive
element (CGTCA box and TGACG motif ), element conferring high transcription level (5’ UTR Py-rich stretch).
All these motifs are very crucial for plant stress
modulation pathways and thus play important role to
regulate the expression of various stress responsive
genes [45, 46]. All these motifs were found to be distributed randomly in both the positive and negative
strands of promoter sequences (Fig. 11). Among
GmGLYI members, GmGLYI-1 and GmGLYI-24 have
maximum cis-elements (12 elements), while GmGLYI14 promoter has minimum two elements on it. In case
of GmGLYII members, GmGLYII-7 has maximum ten elements, while GmGLYII-8 has only one element. ABRE,
HSE, and TGACG motif are found to be present in almost
every promoter of GmGLY genes with few exceptions. Although correlation between the presence of cis-acting
regulatory elements and the observed transcript abundance needs to be confirmed experimentally, these results
indicated the stress-responsive nature of GmGLY genes.
Discussion
Methylglyoxal (MG) is a metabolic by-product generated
naturally in all living cells [7]. But the level of MG goes
up in response to various abiotic stresses in plants [9]. It
has been established in literature that glyoxalase pathway
plays a vital role in the detoxification of MG as well as
provides tolerance against multiple abiotic stresses [5, 7].
Genome wide analysis of glyoxalase pathway has been
done preliminary in the monocot model plant rice and
dicot model plant Arabidopsis [1]. However, this family
has not been studied in any other species including legume. In the present study, we have performed a genome
wide analysis of soybean to identify glyoxalase gene families, including their chromosomal location, gene and
protein structure, conserved active site and catalytic site
motifs and expression profiles. A total of 24 GLYI and
12 GLYII genes were identified in the soybean genome
that codes for 41 GLYI and 24 GLYII proteins, respectively (Tables 1 and 2). The number of GmGLYI genes is
2.2 times more than that of Arabidopsis and rice (eleven
genes each); and GmGLYII shows 2.4 times more abundance than that of Arabidopsis (five AtGLYII genes), and
4 times more abundant than rice (three OsGLYII genes).
The possible reason behind this significant increase in
gene number might be the two duplication events of
soybean [14] that has occurred after the monocot/dicot
split, or most of the soybean genes expanded in a
species-specific manner [17].
Ghosh and Islam BMC Plant Biology (2016) 16:87
Page 20 of 25
a
GmGLYI-1
GmGLYI-2
GmGLYI-3
GmGLYI-4
GmGLYI-5
GmGLYI-6
GmGLYI-7
Promoter of GmGLYI genes
GmGLYI-8
GmGLYI-9
GmGLYI-10
GmGLYI-11
GmGLYI-12
GmGLYI-13
GmGLYI-14
GmGLYI-15
GmGLYI-16
GmGLYI-17
GmGLYI-18
GmGLYI-19
GmGLYI-20
GmGLYI-21
GmGLYI-22
GmGLYI-23
GmGLYI-24
b
GmGLYII-1
Promoter of GmGLYII genes
GmGLYII-2
GmGLYII-3
GmGLYII-4
GmGLYII-5
GmGLYII-6
GmGLYII-7
GmGLYII-8
GmGLYII-9
GmGLYII-10
GmGLYII-11
GmGLYII-12
-1000
-900
-800
-700
-600
-500
-400
-300
-200
-100
Gene
ABRE
GARE
MBS
TGACG motif
AuxRR-core
HSE
TC rich repeat
5’-UTR Py-rich stretch
Box-W1
JERE
WUN motif
ERE
LTR
TCA element
Fig. 11 In silico promoter analysis of GmGLYI and GmGLYII genes. One kb 5’ upstream sequence of all GmGLYI and GmGLYII genes was downloaded
from soybase database and scanned through PlantCARE for the identification of number and position of various cis-acting regulatory elements.
Different regulatory elements were indicated by different colour symbols and placed in their relative position on the promoter. Symbols presented
above the line indicate forward strand of DNA, while below one indicates the reverse strand
To adopt with different adverse environmental conditions, plants tend to duplicate genes to generate novel
members or increase number [17, 47]. There are three
basic principal patterns of gene duplications, such as
tandem duplication, segmental duplication and transposition. In the present analysis, a total of ten duplicated
pairs were observed in GmGLYI family and five in
GmGLYII family (Table 3). All of them showed segmental duplication except one, that is the major pattern of
gene duplication in plant. The tandem duplication pair
GmGLYI-14/-15 was formed 33.9 Mya ago; while the
segmental duplications of GmGLYI genes have occurred
between 3.7 and 13.6 Mya and that of GmGLYII occurred between 6.3 and18.8 Mya. This indicates that
the tandem duplication event has occurred before the
segmental duplication event. Similar pattern of duplication has been reported previously for HD-Zip genes of
soybean [17].
Soybean, including other plants has been found to
possess greater number of GLYI and GLYII genes and
Ghosh and Islam BMC Plant Biology (2016) 16:87
proteins as compared to their animal counterpart to
date. One of the possible reasons behind this is gene duplication of plant during evolution that ultimately leads
to functional divergence of genes [48]. Functional divergence might lead to either subfunctionalization or neofunctionalization, that in turn resulted in novel gene
functions [48]. In the present study, out of 41 predicted
GLYI proteins only twenty of them possess all four conserved metal binding sites and are expected to have
functional GLYI enzyme activity (Fig. 5 and Table 4).
The other proteins might be functionally diverged and
possess some other activities similar to GLYI. Structurally GLYI is the member of vicinal oxygen chelate
(VOC) superfamily that includes extradiol dioxygenases, GLYI and methylmalonyl‐CoA epimerase [49].
One of the earlier predicted GmGLYI (Accession no.
X68819) was found to have Glutathione S-transferase
activity, too [50]. Apart from that, it has been wellcharacterized in literature that there are two metal activation classes of GLYIs; Zn2+ and non-Zn2+ (mainly
Ni2+/Co2+). Both these classes possess same four conserved metal binding residues and octahedral metal
co-ordination; regardless of the metal activation class
[51]. Three dimensional structure of one of the predicted Ni2+-dependent GLYI, GmGLYI-3 (Fig. 8a) and
Zn2+-dependent GLYI, GmGLYI-16 (Fig. 8b) confirms
the presence of same active site residues in both. However, Ni2+-dependent GmGLYI-3 found to be monomer
consisting of two GLYI domains that fold to create two
putative active sites (Fig. 8a). Whereas, single GLYI domain containing Zn2+-dependent GmGLYI-16 need to
be homo- dimer to create two putative active sites
(Fig. 8b). Interestingly, metal specificity of putative
GLYIs could be easily predicted based on the protein’s
amino acid length and sequence [2, 51]. Zn2+- activated GLYIs are relatively larger in amino acid length
than Ni2+/Co2+-activated ones and have unique region
in their sequence (Fig. 5). Based on these criteria, 16
out of 20 predicted functional GmGLYI enzymes are
expected be Ni2+/Co2+-activated. Same pattern of
dominance by Ni2+/Co2+-activated forms was observed
in case of rice GLYIs (3 out of 4 expected active
OsGLYIs) and Arabidopsis GLYIs (two out of three expected functional AtGLYIs) [2].
On contrary, GLYII enzymes contain the β-lactamase
fold structure that includes lactonase, rubredoxin:oxygen
oxidoreductase, GLYII, arylsulfatase, phosphodiesterase,
carboxylesterase and tRNA maturase [52]. Previously,
GLYII family members from Arabidopsis (AtGlx2-5) and
rice (OsGLYII-1) have been reported to lack of GLYII
activity, instead they possess sulphur dioxygenase like
ethylmalonic encephalopathy protein 1 (ETHE1) activity
[11]. Similar to GLYI, three out of 23 predicted
GmGLYII proteins did not possess the conserved metal
Page 21 of 25
binding motif that might have resulted in the absence of
GLYII activity and leads to the functional divergence.
Expression of glyoxalase genes has been found to be
highly specific towards certain tissue or developmental
stages in Arabidopsis and rice [1]. Thus, the expression
pattern of GmGLYI and GmGLYI genes was analyzed at
different developmental stages and tissues (Fig. 9). These
data revealed the tissue specific expression pattern of
glyoxalase genes in soybean too. Out of all, GmGLYI-7,
GmGLYI-21 and GmGLYII-8 are found to be the constitutively expressed members of soybean glyoxalase
system. A cluster of GmGLYI and GmGLYII genes maintained high level of expression in all the underground
and aerial tissues, followed by low level of expression in
the different stages of seed development (Fig. 9). This indicates the presence of functional distribution among
the multiple members in different tissue/developmental
stimuli. On contrary, some of the GmGLYI genes such
as GmGLYI-1, GmGLYI-11, and GmGLYI-22 showed
medium level of expression in the seed tissues only, with
low or no expression in other parts (Fig. 9). This indicates development specific transition/regulation of
GmGLYI genes. In case of GmGLYII genes, two distinguishable clades were observed in their expression where
one set showed high level expression in all the tissues
and another have no expression at all. These low expressive genes might have other cellular/metabolic regulation
expect developmental/tissue regulation. Another interesting expression pattern was observed for soybean
glyoxalase genes under abiotic stresses (Fig. 10). Different members of GmGLYI and GmGLYII families
responded differentially against salinity, drought and
hormone (ABA) treatment (Fig. 10c). GmGLYII-9 and
GmGLYII-10 showed strong down-regulation in response to all three conditions, while GmGLYII-16
showed sharp up-regulation (Fig. 10d). Presence of
various cis-acting regulatory elements on the putative
promoter sequence of GmGLYI and GmGLYII genes
might be a probable reason behind this altered expression (Fig. 11). Similar pattern of expression was
observed previously in rice and Arabidopsis glyoxalase
genes [1], where each member shows specific pattern
of expression towards the particular type of stress
treatment. Overall, the observed information in the
present study will facilitate to find out the appropriate
candidate gene(s) for further functional characterization
and raising stress-tolerant transgenic crop plants.
Conclusions
Taken together, we have performed a comprehensive in
silico analysis of soybean glyoxalase gene families
(GmGLYI and GmGLYII), and provided detailed information about them. Specifically, our results show that
soybean genome contains 24 GmGLYI and 12 GmGLYII
Ghosh and Islam BMC Plant Biology (2016) 16:87
genes that code for 41 GmGLYI and twenty-three
GmGLYII proteins, respectively; the largest identified
glyoxalase gene family to date in any species/organism.
Present study indicates genome-wide duplication (both
segmental and tandem) of glyoxalase genes that lead to
the expansion of family. Based on the presence of conserved motifs and sequence homology, we have provided
insight into their putative function and metal dependency. Finally, expression data confirms the development,
tissue and stress specific response of each and every
gene in spite of having large multi-member family.
Methods
Identification of GmGLYI and GmGLYII genes in soybean
The putative GLYI and GLYII proteins in soybean genome
were identified by BLASTP search against the new soybean
genome database (Wm82.a2.v1) ( />[53] with an e-value of 1 using previously reported soybean
GLYI protein sequence (GenBank: NM_001249223.1) and
Brassica juncea GLYII protein sequence (GenBank:
AAO26580.1) as query, respectively. Subsequently, each of
the identified sequences was used as secondary queries to
find other new members. All the protein sequences were
checked individually using Pfam ( />with default parameters and e-value of 1, for the presence
of glyoxalase domain (PF00903) in GLYI proteins and
metallo-beta-lactamase domain (PF00753) in the GLYII
proteins. All the identified putative glyoxalase proteins
were nomenclature as prefix “Gm” for Glycine max,
followed by GLYI or GLYII and Arabic numbers serially
starting from 1 depending on their chromosomal position.
Alternate splice forms were represented by adding arabic
numbers after “.” sign sequentially. The chromosomal
locations for all the putative GmGLYI and GmGLYII
genes were identified from soybase (http://soybase.
org/gb2/gbrowse/gmax1.01/) [53] database to draw
the chromosomal map. Various physio-chemical properties of all the identified GmGLYI and GmGLYII
proteins were calculated using Prot-Param software
( Localization of proteins were predicted using CELLO v.2.5: sub-cellular
localization predictor ( [23]
and pSORT prediction software (script.
com/wolf-psort.html) [24]. Chloroplast localization was
further confirmed by ChloroP ( />services/ChloroP/) [25].
Multiple sequence alignment and phylogenetic analysis
To investigate the phylogenetic relationship and conserved motifs/metal binding sites among GLYI and
GLYII proteins from various plant species, sequences
were downloaded from NCBI (.
gov/), PDB ( />rice genome database ( />
Page 22 of 25
Arabidopsis genome database ( and soybean database ( />Protein sequences used in the study of phylogenetic
analysis were available in Additional files 4 and 5. Multiple sequence alignment was performed using ClustalW [54] and phylogenetic tree was constructed using
MEGA 5.2 [55] with Neighbour-Joining method and
1000 bootstrap replicates.
Gene duplication and Ka/Ks calculation
Gene duplication was analyzed using plant genome duplication database ( />index/downloads) [26] for soybean. Genes having more
than 90 % sequence similarities were considered as segmental duplication, while tandem duplicated genes were
separated by five or fewer genes in a 100-kb region. Synonymous (Ks) and nonsynonymous substitution (Ka) rates
were retrieved from plant genome duplication database or
calculated from PAL2NAL program (k.
embl.de/pal2nal/) [56]. Divergence time (in millions of
years) was calculated for each gene pair considering a rate
of 6.1X10⁻⁹ substitutions per site per year [17]. Thus, divergence time (T) = Ks/(2X6.1X10−9)X10−6 Mya.
Assessment of domain architecture, catalytic conservance
and metal ion specificity of GLYI and GLYII proteins
All the predicted GmGLYI (41) and GmGLYII (24) proteins were analyzed using Pfam to reveal the presence of
conserved glyoxalase domain (PF00903) and metallo-betalactamase domain (PF00753), respectively. Glyoxalase domain (PF00903) of GmGLYI and metallo-beta-lactamase
domain (PF00753) of GmGLYII proteins were aligned separately with previously characterized members using ClustalW and analyzed for the presence of conserved motifs.
GLYI has a conserved H/QEH/QE motif for metal binding
and catalysis, whereas GLYII has two separate metal binding motif (THXHXDH) and active site motif (C/GHT).
The metal ion specificity of GmGLYI proteins was predicted based on the previous studies [2, 51].
Homology based structural modelling of various soybean
glyoxalase proteins
Homology based model of GmGLYI-3, GmGLYI-16 and
GmGLYII-5 was built using SWISSMODEL program
( [57]. Respective protein
sequences were first analyzed by template search, followed
by model building using best template structure with
highest similarities. Structures of GmGLYI-3, GmGLYI-16
and GmGLYII-5 were built using most similar structure
available from Protein Data Bank (PDB) i.e. Zea mays
GLYI (5D7Z), mouse GLYI (4OPN), and AtGLYII-2
(2Q42) proteins, respectively. Resulting structures were visualized using UCSF Chimera ( />
Ghosh and Islam BMC Plant Biology (2016) 16:87
chimera) [58]. Active site residues were identified and
marked based on previous template structure analysis.
Expression analysis using RNA-Seq Atlas of Glycine max
To analyze the tissue-specific expression data of 24
GmGLYI and 12 GmGLYII genes, their corresponding
probe sets were indentified using soybase tool (http://
www.soybase.org/correspondence/index.php). Normalized
transcript data was downloaded from soybase ( for 14 different tissues, including root,
nodule (underground tissues); leaf, flower, pod-shell 10-day
after flowering (DAF), pod-shell 14-DAF, one-cm pod (aerial tissues); and different stages of seed development (seed
of 10-DAF, 14-DAF, 21-DAF, 25-DAF, 28-DAF, 35-DAF
and 42-DAF). This normalized expression was used to generate heatmap and hierarchical clustering using the Institute for Genomic Research MeV software package [59].
Expression analysis of GmGLYI and GmGLYII genes at
different developmental stages
Expression patterns of GmGLYI and GmGLYII genes at
different developmental stages were determined using the
publically available transcriptomes data (i.
nlm.nih.gov/geo/query/acc.cgi?acc=GSE29163). Transcript
data of ten different soybean stages (root, seedlings, stem,
leaf, flower buds, and different stages of seed development- globular, heart, cotyledon, early maturation, and
dry seeds) were downloaded from the NCBI database
( with accession numbers
of SRX062325 to SRX062334. After normalization, the
values were used for heatmap generation using the Institute for Genomic Research MeV software package [59].
Expression analysis of GmGLYI and GmGLYII genes in
response to salinity and drought stresses
Expression data of glyoxalase genes in response to
salinity and drought stresses were retrieved from the
National Center for Biotechnology Information Gene
Expression Omnibus (GEO) database [60] with accession numbers GSE41125 and GSE40627, respectively.
Corresponding probe sets for GmGLYI and GmGLYII
genes were identified using NetAffx Analysis Center
( online Probe Match
tool. More than one gene with the same probe set,
were considered as same transcriptional profile, while in
case of gene having more than one probe set, the highest
value was considered. Expression data were normalized
using that of mock, and represented as bar diagram.
Plant material, stress treatments and semiquantitative
RT-PCR
Soybean (Glycine max L. variety Sohag) seedlings were
grown in a condition with continuous 30 °C temperature
Page 23 of 25
and 12 h/12 h of photoperiod [17]. Fifteen days old seedlings were irrigated with normal water as experimental
control or 200 mM NaCl solution for salinity stress or
10 mM ABA solution for hormonal treatment for 8 h.
Seedlings were placed onto filter paper and exposed to
the air to mimic drought stress. Leaves were collected
from all these seedlings after 8 h (with triplicates) and
total RNA was extracted using TRIzol® Reagent (Thermo
Fisher Scientific, USA). First-strand cDNA was synthesized using RevertAid First Strand cDNA Synthesis Kit
(Thermo Fisher Scientific, USA). Gene-specific primer
for eight candidates genes, listed in Additional file 3:
Table S6, were designed using Primer-Blast (http://
www.ncbi.nlm.nih.gov/tools/primer-blast/), and soybean
Tubulin gene was used as an internal control [22].
Promoter sequence analysis for putative cis-regulatory
elements
To identify various cis-acting regulatory elements in the
promoter sequences of GmGLYI and GmGLYII genes,
1 kb 5′ upstream region sequences were retrieved from
soybean genome database ( />dlpages/flank/index.php). Promoter sequences were analyzed using PlantCARE databases [44] to find out the
presence of cis-acting regulatory elements.
Availability of data and materials
All sequence information regarding soybean is available
at a public database, Soybase ( Apart
from that, most datasets supporting the conclusions of
this article are included as additional files. All protein sequences used in the phylogenetic analysis had been
already deposited in Uniprot ( />and provided as additional data too. The seeds of
Soybean (Glycine max L. variety Sohag) are available
from Bangladesh Agriculture Research Institute, Gazipur,
Bangladesh.
Additional files
Additional file 1: Figure S1. Phylogenetic relationship of GmGLYI (A)
and GmGLYII (B) proteins. An unrooted tree was generated using
Neighbor-Joining method with 1000 bootstrap by MEGA5.2 software
using the full-length amino acid sequences of the twenty-four GmGLYI
and twelve GmGLYII proteins (only the first splice variants were taken in
case of multiple members). The numbers next to the branch shows the
result of 1000 bootstrap replicates expressed in percentage, and scores
higher than 50 % are indicated on the nodes. (PDF 17 kb)
Additional file 2: Table S1. Pairwise identities between paralogous
pairs of GLYI proteins from Soybean. Table S2. Percentage of identities
between all GLYII proteins from Soybean. Table S5. Expression analysis of
soybean GLYI and GLYII genes through RNA-seq data (XLS 40 kb)
Additional file 3: Table S3. Number of exons and introns in all the
splice variants of GmGLYI genes. Table S4. Number of exons and introns
in all the splice variants of GmGLYII genes. Table S6. Primers used in the
semi-quantitative RT-PCR. (DOCX 26 kb)
Ghosh and Islam BMC Plant Biology (2016) 16:87
Additional file 4: Protein sequences used for phylogenetic analysis of
GLYI. (DOCX 21 kb)
Additional file 5: Protein sequences used for phylogenetic analysis of
GLYII. (DOCX 17 kb)
Abbreviations
aa: amino acid; ABA: abscisic acid; bp: base pair; DAF: day after flowering;
GLYI: Glyoxalase I; GLYII: Glyoxalase II; GSH: reduced glutathione; h: hour;
MG: methylglyoxal; Mya: million years.
Competing interests
The authors declare that they have no competing interest.
Authors’ contributions
AG designed and performed the experiments, and analysed the data. TI
performed semiquantitative RT-PCR experiment. AG and TI wrote the
manuscript. Both authors read the manuscript and approved the final version.
Acknowledgements
AG acknowledges Shahjalal University of Science and Technology, Sylhet,
Bangladesh for providing the logistic support and Department of Biochemistry
and Molecular Biology of the same University for providing the laboratory
space. TI acknowledges Plant Breeding and Biotechnology Laboratory,
Department of Botany, Dhaka University for providing laboratory facilities.
Authors thank Prof. Dr. M. Mozammel Haque, Department of Botany,
University of Dhaka, Dhaka-1000, Bangladesh and Prof. Dr. Yasmeen Haque,
Department of Physics, Shahjalal University of Science and Technology,
Sylhet-3114, Bangladesh for their valuable time for copy-editing the manuscript.
Author details
1
Department of Biochemistry and Molecular Biology, Shahjalal University of
Science and Technology, Sylhet 3114, Bangladesh. 2Plant Breeding and
Biotechnology Laboratory, Department of Botany, Dhaka University, Dhaka
1000, Bangladesh.
Received: 8 September 2015 Accepted: 11 April 2016
References
1. Mustafiz A, Singh AK, Pareek A, Sopory SK, Singla-Pareek SL. Genomewide analysis of rice and Arabidopsis identifies two glyoxalase genes
that are highly expressed in abiotic stresses. Funct Integr Genomics.
2011;11(2):293–305.
2. Kaur C, Vishnoi A, Ariyadasa TU, Bhattacharya A, Singla-Pareek SL, Sopory SK.
Episodes of horizontal gene-transfer and gene-fusion led to co-existence of
different metal-ion specific glyoxalase I. Sci Rep. 2013;3:3076.
3. Rabbani N, Thornalley PJ. Glyoxalase in diabetes, obesity and related
disorders. Semin Cell Dev Biol. 2011;22(3):309–17.
4. Thornalley PJ. The glyoxalase system: new developments towards functional
characterization of a metabolic pathway fundamental to biological life.
Biochem J. 1990;269(1):1–11.
5. Kaur C, Ghosh A, Pareek A, Sopory SK, Singla-Pareek SL. Glyoxalases and
stress tolerance in plants. Biochem Soc Trans. 2014; 42(2). doi:10.1042/
BST20130242.
6. Singla-Pareek SL, Reddy MK, Sopory SK. Genetic engineering of the
glyoxalase pathway in tobacco leads to enhanced salinity tolerance. Proc
Natl Acad Sci U S A. 2003;100(25):14672–7.
7. Kaur C, Singla-Pareek SL, Sopory SK. Glyoxalase and methylglyoxal as
biomarkers for plant stress tolerance. Crit Rev Plant Sci. 2014;33(6):429–56.
8. Guo YL. Gene family evolution in green plants with emphasis on the
origination and evolution of Arabidopsis thaliana genes. Plant J. 2013;73(6):
941–51.
9. Ghosh A, Pareek A, Sopory SK, Singla-Pareek SL. A glutathione responsive
rice glyoxalase II, OsGLYII-2, functions in salinity adaptation by maintaining
better photosynthesis efficiency and anti-oxidant pool. Plant J. 2014;80(1):
93–105.
10. Singla-Pareek S, Yadav S, Pareek A, Reddy M, Sopory S. Enhancing salt
tolerance in a crop plant by overexpression of glyoxalase II. Transgenic Res.
2008;17(2):171–80.
Page 24 of 25
11. Kaur C, Mustafiz A, Sarkar AK, Ariyadasa TU, Singla-Pareek SL, Sopory SK.
Expression of abiotic stress inducible ETHE1-like protein from rice is higher
in roots and is regulated by calcium. Physiol Plant. 2014;152(1):1–16.
12. Mustafiz A, Ghosh A, Tripathi AK, Kaur C, Ganguly AK, Bhavesh NS, Tripathi
JK, Pareek A, Sopory SK, Singla-Pareek SL. A unique Ni -dependent and
methylglyoxal-inducible rice glyoxalase I possesses a single active site and
functions in abiotic stress response. Plant J. 2014;78:951–63.
13. Mainali HR, Chapman P, Dhaubhadel S. Genome-wide analysis of Cyclophilin
gene family in soybean (Glycine max). BMC Plant Biol. 2014;14:282.
14. Schmutz J, Cannon SB, Schlueter J, Ma J, Mitros T, Nelson W, Hyten DL,
Song Q, Thelen JJ, Cheng J, et al. Genome sequence of the palaeopolyploid
soybean. Nature. 2010;463(7278):178–83.
15. Manavalan LP, Guttikonda SK, Tran LS, Nguyen HT. Physiological and
molecular approaches to improve drought resistance in soybean. Plant Cell
Physiol. 2009;50(7):1260–76.
16. Singleton PW, Bohlool BB. Effect of salinity on nodule formation by
soybean. Plant Physiol. 1984;74(1):72–6.
17. Chen X, Chen Z, Zhao H, Zhao Y, Cheng B, Xiang Y. Genome-wide analysis
of soybean HD-Zip gene family and expression profiling under salinity and
drought treatments. PLoS One. 2014;9(2), e87156.
18. Du H, Yang SS, Liang Z, Feng BR, Liu L, Huang YB, Tang YX. Genome-wide
analysis of the MYB transcription factor superfamily in soybean. BMC Plant
Biol. 2012;12:106.
19. Fan CM, Wang X, Wang YW, Hu RB, Zhang XM, Chen JX, Fu YF. Genomewide expression analysis of soybean MADS genes showing potential
function in the seed development. PLoS One. 2013;8(4), e62288.
20. Xu H, Li Y, Yan Y, Wang K, Gao Y, Hu Y. Genome-scale identification of
soybean BURP domain-containing genes and their expression under stress
treatments. BMC Plant Biol. 2010;10:197.
21. Yin G, Xu H, Xiao S, Qin Y, Li Y, Yan Y, Hu Y. The large soybean (Glycine max)
WRKY TF family expanded by segmental duplication events and subsequent
divergent selection among subgroups. BMC Plant Biol. 2013;13:148.
22. Zhang G, Chen M, Chen X, Xu Z, Guan S, Li LC, Li A, Guo J, Mao L, Ma Y.
Phylogeny, gene structures, and expression patterns of the ERF gene family
in soybean (Glycine max L.). J Exp Bot. 2008;59(15):4095–107.
23. Yu CS, Chen YC, Lu CH, Hwang JK. Prediction of protein subcellular
localization. Proteins. 2006;64(3):643–51.
24. Horton P, Park KJ, Obayashi T, Fujita N, Harada H, Adams-Collier CJ, Nakai K.
WoLF PSORT: protein localization predictor. Nucleic Acids Res. 2007;35(Web
Server issue):W585–7.
25. Emanuelsson O, Nielsen H, von Heijne G. ChloroP, a neural network-based
method for predicting chloroplast transit peptides and their cleavage sites.
Protein Sci. 1999;8(5):978–84.
26. Lee TH, Tang H, Wang X, Paterson AH. PGDD: a database of gene and genome
duplication in plants. Nucleic Acids Res. 2013;41(Database issue):D1152–8.
27. Li WH, Gojobori T, Nei M. Pseudogenes as a paradigm of neutral evolution.
Nature. 1981;292(5820):237–9.
28. Juretic N, Hoen DR, Huynh ML, Harrison PM, Bureau TE. The evolutionary
fate of MULE-mediated duplications of host gene fragments in rice.
Genome Res. 2005;15(9):1292–7.
29. Lynch M, Conery JS. The evolutionary fate and consequences of duplicate
genes. Science. 2000;290(5494):1151–5.
30. Marasinghe GP, Sander IM, Bennett B, Periyannan G, Yang KW, Makaroff CA,
Crowder MW. Structural studies on a mitochondrial glyoxalase II. J Biol
Chem. 2005;280(49):40668–75.
31. Pesole G, Mignone F, Gissi C, Grillo G, Licciulli F, Liuni S. Structural and
functional features of eukaryotic mRNA untranslated regions. Gene. 2001;
276(1–2):73–81.
32. Carvalho AB, Clark AG. Intron size and natural selection. Nature. 1999;
401(6751):344.
33. Fedorov A, Merican AF, Gilbert W. Large-scale comparison of intron
positions among animal, plant, and fungal genes. Proc Natl Acad Sci U S A.
2002;99(25):16128–33.
34. Frickel EM, Jemth P, Widersten M, Mannervik B. Yeast glyoxalase I is a
monomeric enzyme with two active sites. J Biol Chem. 2001;276(3):1845–9.
35. Deponte M, Sturm N, Mittler S, Harner M, Mack H, Becker K. Allosteric
coupling of two different functional active sites in monomeric Plasmodium
falciparum glyoxalase I. J Biol Chem. 2007;282(39):28419–30.
36. He MM, Clugston SL, Honek JF, Matthews BW. Determination of the
structure of Escherichia coli glyoxalase I suggests a structural basis for
differential metal activation. Biochemistry. 2000;39(30):8719–27.
Ghosh and Islam BMC Plant Biology (2016) 16:87
37. Cameron AD, Olin B, Ridderstrom M, Mannervik B, Jones TA. Crystal
structure of human glyoxalase I–evidence for gene duplication and 3D
domain swapping. EMBO J. 1997;16(12):3386–95.
38. Aronsson AC, Marmstal E, Mannervik B. Glyoxalase I, a zinc metalloenzyme
of mammals and yeast. Biochem Biophys Res Commun. 1978;81(4):1235–40.
39. Ridderstrom M, Mannervik B. Optimized heterologous expression of the
human zinc enzyme glyoxalase I. Biochem J. 1996;314(Pt 2):463–7.
40. Saint-Jean AP, Phillips KR, Creighton DJ, Stone MJ. Active monomeric and
dimeric forms of Pseudomonas putida glyoxalase I: evidence for 3D domain
swapping. Biochemistry. 1998;37(29):10345–53.
41. Ridderstrom M, Cameron AD, Jones TA, Mannervik B. Involvement of an
active-site Zn2+ ligand in the catalytic mechanism of human glyoxalase I. J
Biol Chem. 1998;273(34):21623–8.
42. Campos-Bermudez VA, Leite NR, Krog R, Costa-Filho AJ, Soncini FC,
Oliva G, Vila AJ. Biochemical and structural characterization of
Salmonella typhimurium glyoxalase II: new insights into metal ion
selectivity. Biochemistry. 2007;46(39):11069–79.
43. Turra GL, Agostini RB, Fauguel CM, Presello DA, Andreo CS, Gonzalez JM,
Campos-Bermudez VA. Structure of the novel monomeric glyoxalase I from
Zea mays. Acta Crystallogr D Biol Crystallogr. 2015;71(Pt 10):2009–20.
44. Lescot M, Dehais P, Thijs G, Marchal K, Moreau Y, Van de Peer Y, Rouze P,
Rombauts S. PlantCARE, a database of plant cis-acting regulatory elements
and a portal to tools for in silico analysis of promoter sequences. Nucleic
Acids Res. 2002;30(1):325–7.
45. Chen W, Provart NJ, Glazebrook J, Katagiri F, Chang HS, Eulgem T, Mauch F,
Luan S, Zou G, Whitham SA, et al. Expression profile matrix of Arabidopsis
transcription factor genes suggests their putative functions in response to
environmental stresses. Plant Cell. 2002;14(3):559–74.
46. Yamaguchi-Shinozaki K, Shinozaki K. Organization of cis-acting regulatory
elements in osmotic- and cold-stress-responsive promoters. Trends Plant
Sci. 2005;10(2):88–94.
47. Gu Z, Steinmetz LM, Gu X, Scharfe C, Davis RW, Li WH. Role of duplicate genes
in genetic robustness against null mutations. Nature. 2003;421(6918):63–6.
48. Gu X. Functional divergence in protein (family) sequence evolution.
Genetica. 2003;118(2–3):133–41.
49. Pakhomova S, Rife CL, Armstrong RN, Newcomer ME. Structure of
fosfomycin resistance protein FosA from transposon Tn2921. Protein Sci.
2004;13(5):1260–5.
50. Skipsey M, Andrews CJ, Townson JK, Jepson I, Edwards R. Cloning and
characterization of glyoxalase I from soybean. Arch Biochem Biophys. 2000;
374(2):261–8.
51. Suttisansanee U, Lau K, Lagishetty S, Rao KN, Swaminathan S, Sauder JM,
Burley SK, Honek JF. Structural variation in bacterial glyoxalase I enzymes:
investigation of the metalloenzyme glyoxalase I from Clostridium
acetobutylicum. J Biol Chem. 2011;286(44):38367–74.
52. Limphong P, Nimako G, Thomas PW, Fast W, Makaroff CA, Crowder MW.
Arabidopsis thaliana mitochondrial glyoxalase 2–1 exhibits beta-lactamase
activity. Biochemistry. 2009;48(36):8491–3.
53. Grant D, Nelson RT, Cannon SB, Shoemaker RC. SoyBase, the USDA-ARS
soybean genetics and genomics database. Nucleic Acids Res. 2010;
38(Database issue):D843–6.
54. Larkin MA, Blackshields G, Brown NP, Chenna R, McGettigan PA, McWilliam H,
Valentin F, Wallace IM, Wilm A, Lopez R et al. Clustal W and Clustal X version 2.
0. Bioinformatics. 2007;23(21):2947–8.
55. Tamura K, Peterson D, Peterson N, Stecher G, Nei M, Kumar S. MEGA5: molecular
evolutionary genetics analysis using maximum likelihood, evolutionary distance,
and maximum parsimony methods. Mol Biol Evol. 2011;28(10):2731–9.
56. Suyama M, Torrents D, Bork P. PAL2NAL: robust conversion of protein
sequence alignments into the corresponding codon alignments. Nucleic
Acids Res. 2006;34(Web Server issue):W609–12.
57. Biasini M, Bienert S, Waterhouse A, Arnold K, Studer G, Schmidt T, Kiefer F,
Cassarino TG, Bertoni M, Bordoli L et al. SWISS-MODEL: modelling protein
tertiary and quaternary structure using evolutionary information. Nucleic Acids
Res. 2014;42(Web Server issue):W252–8.
58. Pettersen EF, Goddard TD, Huang CC, Couch GS, Greenblatt DM, Meng EC,
Ferrin TE. UCSF Chimera–a visualization system for exploratory research and
analysis. J Comput Chem. 2004;25(13):1605–12.
59. Eisen MB, Spellman PT, Brown PO, Botstein D. Cluster analysis and display of
genome-wide expression patterns. Proc Natl Acad Sci U S A. 1998;95(25):14863–8.
60. Barrett T, Edgar R. Gene expression omnibus: microarray data storage,
submission, retrieval, and analysis. Methods Enzymol. 2006;411:352–69.
Page 25 of 25
Submit your next manuscript to BioMed Central
and we will help you at every step:
• We accept pre-submission inquiries
• Our selector tool helps you to find the most relevant journal
• We provide round the clock customer support
• Convenient online submission
• Thorough peer review
• Inclusion in PubMed and all major indexing services
• Maximum visibility for your research
Submit your manuscript at
www.biomedcentral.com/submit