Proteomic analysis of maize grain development using iTRAQ reveals temporal programs of diverse metabolic processes
Bạn đang xem bản rút gọn của tài liệu. Xem và tải ngay bản đầy đủ của tài liệu tại đây (1.4 MB, 14 trang )
Yu et al. BMC Plant Biology (2016) 16:241
DOI 10.1186/s12870-016-0878-1
RESEARCH ARTICLE
Open Access
Proteomic analysis of maize grain
development using iTRAQ reveals temporal
programs of diverse metabolic processes
Tao Yu†, Geng Li†, Shuting Dong*, Peng Liu*, Jiwang Zhang and Bin Zhao
Abstract
Background: Grain development in maize is an essential process in the plant’s life cycle and is vital for use of the
plant as a crop for animals and humans. However, little is known regarding the protein regulatory networks that
control grain development. Here, isobaric tag for relative and absolute quantification (iTRAQ) technology was used
to analyze temporal changes in protein expression during maize grain development.
Results: Maize grain proteins and changes in protein expression at eight developmental stages from 3 to 50 d after
pollination (DAP) were performed using iTRAQ-based proteomics. Overall, 4751 proteins were identified; 2639 of
these were quantified and 1235 showed at least 1.5-fold changes in expression levels at different developmental
stages and were identified as differentially expressed proteins (DEPs). The DEPs were involved in different cellular
and metabolic processes with a preferential distribution to protein synthesis/destination and metabolism categories.
A K-means clustering analysis revealed coordinated protein expression associated with different functional
categories/subcategories at different development stages.
Conclusions: Our results revealed developing maize grain display different proteomic characteristics at distinct
stages, such as numerous DEPs for cell growth/division were highly expressed during early stages, whereas those
for starch biosynthesis and defense/stress accumulated in middle and late stages, respectively. We also observed
coordinated expression of multiple proteins of the antioxidant system, which are essential for the maintenance of
reactive oxygen species (ROS) homeostasis during grain development. Particularly, some DEPs, such as zinc
metallothionein class II, pyruvate orthophosphate dikinase (PPDK) and 14-3-3 proteins, undergo major changes in
expression at specific developmental stages, suggesting their roles in maize grain development. These results
provide a valuable resource for analyzing protein function on a global scale and also provide new insights into the
potential protein regulatory networks that control grain yield and quality.
Keywords: Maize, Grain development, Proteomics, iTRAQ, Starch
Abbreviations: 1cys-Prx, 1-cys-peroxiredoxin; 2-DE, two-dimensional electrophoresis; 6PGDH, 6-phosphogluconate
dehydrogenase; ADP-Glu, ADP-glucose; AGPase, ADP-glucose pyrophosophorylase; BT1, ADP-glucose brittle-1
transporter; DAP, day after pollination; DEPs, differentially expressed proteins; G1P, glucose-1-phosphate;
G6PDH, glucose-6-phosphate 1-dehydrogenase; GBSS, granule-bound starch synthase; ISA, isoamylase;
iTRAQ, isobaric tag for relativeand absolute quantitation; LEA, late embryogenesis abundant;
PEP, phosphoenolpyruvate; PPDK, pyruvate orthophosphate dikinase; PPP, pentose phosphate pathway;
Pyr, pyruvate; RNA-seq, RNA sequencing; ROS, reactive oxygen species; SBE, starch branching enzyme; SSS, soluble
starch synthase; SuSy, sucrose synthase; TCA, tricarboxylic acid
* Correspondence: ;
†
Equal contributors
State Key Laboratory of Crop Biology and College of Agronomy, Shandong
Agricultural University, Taian 271018, Shandong, People’s Republic of China
© 2016 The Author(s). Open Access This article is distributed under the terms of the Creative Commons Attribution 4.0
International License ( which permits unrestricted use, distribution, and
reproduction in any medium, provided you give appropriate credit to the original author(s) and the source, provide a link to
the Creative Commons license, and indicate if changes were made. The Creative Commons Public Domain Dedication waiver
( applies to the data made available in this article, unless otherwise stated.
Yu et al. BMC Plant Biology (2016) 16:241
Background
The grains of cereal crops have high agronomic value;
this is particularly true of maize (Zea mays L.), which is
cultivated worldwide and is one of the most important
crops as a source of food, animal feed, and renewable resources. Improvement of the yield and quality of grain is
a major objective of maize breeding. Molecular biology
technologies and genomics have received increasing attention for maize breeding as they provide new and
more efficient selection criteria [1]. Therefore, a better
understanding of the metabolic processes and underlying
molecular mechanisms associated with grain development
will provide new insights that will enable future increases
in grain yield and quality.
Over the past several decades, much progress has been
made in understanding maize grain development, which
is initiated by a double fertilization process and is divided into three main stages: the lag, grain filling, and
maturation stages [2, 3]. The lag stage encompasses
events up to 12 d after pollination (DAP) and is characterized by a rapid expansion in cell number and sizes;
this increase determines the size of the sink for the subsequent accumulation of storage molecules. The grain
filling stage lasts from 12 to 40 DAP, and is characterized by the onset of synthesis and accumulation of
storage molecules. During this stage, starch, which is
composed of amylose and amylopectin, is the major
stored component and is synthesized from imported
sucrose. Various enzymes synthesize starch and then
trim and pack the molecules as semi-crystalline starch
granules in amyloplasts [4–6]. The maturation stage
occurs from 40 to 70 DAP, and is characterized by dehydration of the grains, which gradually go into a quiescent
dormancy state. The duration of each stage varies depending on genetic background, environmental, and cultural conditions [7]. Although our understanding of the
morphological and physiological changes during grain
development has increased, the underlying molecular
regulatory mechanisms are still largely unknown [8–10].
The identification of gene activities and functions is
an effective method for exploring molecular regulatory
mechanisms. Large-scale genome-wide expression analyses using microarrays, cDNA libraries, and RNA
sequencing (RNA-seq) have described large numbers of
genes that are preferentially expressed in embryogenesis or accumulation of storage compounds during
maize grain development [1, 9–13]. For example, a dynamic transcriptomics analysis using an RNA-seq strategy in maize embryo, endosperm, and whole grain from
fertilization to maturity identified 26,105 genes involved
in programming grain development; moreover, 1258 of
these genes were determined to be grain-specific [10].
Although information has been reported on the genes involved in grain development, there is a lack of equivalent
Page 2 of 14
detail at the protein level despite their role as direct
regulators of cell activity. More importantly, transcription patterns are not always directly associated with the
expression of the corresponding protein, as has been
shown in maize [14], rice [15], cotton [16], and Arabidopsis
[17]. Therefore, direct proteomics research is also essential
for monitoring grain developmental profiles.
To date, the reported proteomic studies of grain development have mainly used two-dimensional gel electrophoresis (2-DE). Such studies have been performed in
many species, including rice [15, 18, 19], wheat [20],
Arabidopsis [17], barley [21], castor [22], Medicago truncatula [23], and soybean [24, 25]. However, some types
of protein can’t be analyzed by 2-DE as it has the inherent restrictions of being unable to separate hydrophobic
proteins, low identification rate, and lack of accurate
quantitative information [26, 27]. Recently, an alternative
approach has been developed using isobaric tag for
relative and absolute quantitation (iTRAQ) as a mass
spectrometry-based quantitative technology; this technique overcomes some of the limitations of 2-DE, especially for multiple samples, and allows identification of a
greater number of proteins to provide more reliable quantitative information [28, 29]. The advantages of iTRAQ
technology have been exploited to identify and quantify
2165 proteins in developing rice embryos [30] and 1815
proteins in wheat grains [31].
In the past, several proteomics analysis of maize whole
grain or embryo and endosperm has been carried out.
Based on 2-DE, Méchin et al. [32] established a proteome
reference map for maize endosperm, and 504 proteins
were identified that were mainly assigned to the metabolic
and protein destination category. They subsequently
quantified 409 proteins at seven development stages between 4 and 40 DAP and showed that the dynamic expression patterns of these proteins are consistent with the
important developmental shift from cell growth and differentiation to storage [8]. In order to explore the regulatory factors which are critical for maize grain filling, Jin et
al. [7] found 39 proteins in endosperm and 43 proteins in
embryo, which were differentially expressed in three elite
maize hybrids during the linear filling phase (17–28 DAP),
by using 2-DE, and the further functional analysis revealed
that proteins related to glycolysis and redox homeostasis
were emphasized in the endosperm, while proteins involved in fatty acid biosynthesis were emphasized in the
embryo. 40 proteins were also found to be differentially
expressed after grain ageing by 2-DE, indicating that artificial ageing affected the proteome of the dry maize grains
[33]. In other studies using 2-DE, the expression level of
proteins related to maize embryo desiccation tolerance
was studied [34] and grain viability was investigated [35].
However, because of the limitations of the 2-DE method,
these studies could only study a relatively small number of
Yu et al. BMC Plant Biology (2016) 16:241
proteins. In a recent study, using mass spectrometry, Walley et al. [14] mapped an atlas of proteotypes for the developing maize grain based on protein abundance and levels
of protein phosphorylation. As a result, 14,165 proteins
and 18,405 phosphopeptides (from 4511 proteins) were
quantified in different grain compartments and development stages, including embryo (20, 38 DAP and 2 d after
imbibition), endosperm (8, 10, 12 and 27 DAP) and aleurone/pericarp (27 DAP), and this study further revealed
that many of the most abundant proteins were not associated with detectable levels of their mRNAs [14]. The atlas
provided rich resources for identify kinase-substrate relationships as well as the reconstruction of biochemical and
signaling networks that underpin grain development and
grain storage product production. Although considerable
work of proteomics investigation in maize grain has been
performed, these studies mainly focused on maize grain
different components (embryo, endosperm and aleurone/
pericarp) and several time points. Meanwhile, maize had a
larger genome and a more complex proteome than model
plants such as Arabidopsis and rice, the regulatory mechanisms that are important for maize grain development still
require further study. Importantly, to our knowledge, a
systematic proteomics analysis of the entire development
process in maize grain based on iTRAQ has not been reported. Therefore, we analyzed the dynamic changes in
Page 3 of 14
protein expression in maize grain at eight sequential
developmental stages from 3 to 50 DAP, a period that
covers three major development processes using
iTRAQ technology. Our results revealed a global shift
of protein expression patterns corresponding to grain
development, which serve as a valuable resource for
analyzing protein function on a global scale and providing new insights into the potential protein regulatory
networks that control grain yield and quality.
Results and discussion
Physiology characteristics of maize grain at eight
developmental stages
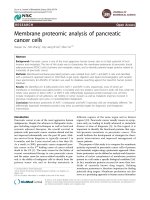
Whole maize grains were sampled at 3, 5, 10, 15, 20, 30,
40, and 50 DAP (Fig. 1a), and the characteristics of the
developing grains were recorded at each sampling day
(Fig. 1b–d). During grain development, both fresh and
dry grain weight slowly increased from 3 to 10 DAP,
followed by a more rapid increase to 40 DAP (Fig. 1b).
After 40 DAP, dry weight continued to increase until 50
DAP, whereas fresh weight declined, indicating that the
developing grains had entered the desiccation stage after
40 DAP. Total starch content increased rapidly between
10 and 30 DAP, and then more slowly until 50 DAP
(Fig. 1c), indicating that the period 10–30 DAP was the
key stage for grain starch synthesis and accumulation. In
Fig. 1 Development of maize grains during the experimental period. a Maize grains at the eight stages of development. b Changes in fresh and
dry weights of developing grains. At least 100 grains were analyzed at each stage. c Changes in total starch contents of developing grains. Values are
expressed as a percentage of grain dry weights. d Dynamic changes of endosperm cell number in grains. Error bars represent SD of three replicates
Yu et al. BMC Plant Biology (2016) 16:241
addition, analysis of endosperm proliferation showed
that the number of endosperm cells increased rapidly
from 3 to 10 DAP, and then more slowly to reach a maximum at 20 DAP (Fig. 1d). Overall, our results suggest
that up to 10 DAP developing grains mainly undergo
active cell division and differentiation, followed by grain
filling until 40 DAP, and then enter into the desiccation
stage after 40 DAP. Therefore, these three periods are
approximately representative of the three main stages of
maize grain development, i.e., early (3–10 DAP), middle
(10–40 DAP), and late (40–50 DAP).
Identification and relative quantitation of proteins in
maize grain
The analysis of total proteins and of changes in protein
expression was performed using iTRAQ-based proteomics with three biological replicates. Strict identification and quality criteria were also used (for details, see
“Methods”). The analysis identified 4751 proteins in
maize grain, of which 2755 proteins were common in
two biological replicates (Fig. 2; Additional file 1); 2639
of these proteins were quantified (Additional file 2).
The number of identified and quantified proteins was
greater than that from previous proteomic analyses
using 2-DE [8, 32], clearly demonstrating that iTRAQ
technology has greater potential for protein identification
and quantification compared to conventional gel-based
methods. Simultaneously, compared to a recent
Page 4 of 14
proteomics analysis that had quantified 14,165 proteins
and 18,405 phosphopeptides (from 4511 proteins) in the
developing maize embryo (20, 38 DAP and 2 d after imbibition), endosperm (8, 10, 12 and 27 DAP) and aleurone/
pericarp (27 DAP) by mass spectrometry [14], the number
of identified and quantified proteins was still relatively
small in our study. However, our study described the
dynamic changes of proteome in maize grain during entire
development stages. A 1.5-fold cut-off change in expression (p ≤ 0.05) during development was used to identify
significant changes in the abundance of differentially
expressed proteins (DEPs). A total of 1235 proteins were
classified as DEPs and K-means clustering analysis
assigned these proteins to five expression cluster groups
(c0, c1, c2, c3, and c4; Table 1; Fig. 3). The largest cluster
was c0, with 466 proteins in this group; expression of
these proteins gradually declined from 3 to 50 DAP. The
next largest clusters were c2 (279 proteins) and c1 (243
proteins). The level of expression of c2 proteins increased
gradually at 30 DAP and reached a maximum at 50 DAP.
By contrast, c1 proteins showed considerable accumulation at 15–20 DAP, and occasionally to 30 DAP, but
decreased thereafter. Cluster c3 consisted of 82 proteins
whose expression patterns were similar to those of c2
proteins except that they showed a large increased from
30 to 50 DAP. Cluster c4 consisted of 165 proteins and
their expression contrasted that of c1 proteins by having
peaks at 6 and 50 DAP. These results suggested that different patterns of protein regulation were correlated with
early, middle, and late stages of grain development.
Among the 1235 DEPs, 572 were annotated as uncharacterized proteins. To obtain functional information on
these proteins, we performed a BLAST analysis to search
for homologous proteins; this search identified homologous sequences in other species for 437 of the uncharacterized protein sequences (Additional file 3). According
to the presumed biological function listed in UniProt
and the scheme for functional category classification for
maize endosperm [8] and rice grain [15] proteins, the
1235 DEPs were classified into different functional categories. Proteins involved in protein synthesis/destination and metabolism comprised the largest groups,
approximately 25.18 and 20 %, respectively (Fig. 4), suggesting the functional importance of metabolism and
protein synthesis/destination during grain development.
In order to obtain more detailed information about these
two functional categories, DEPs involved in protein synthesis/destination and metabolism were further assigned
to 5 and 11 subcategories, respectively (Table 1).
Protein expression characteristics during grain lag stage
Fig. 2 Venn diagram representing the overlap of the identified
proteins in the three biological repeats. The Bio1, Bio2, Bio3 represent
the first, second and third biological replicates, respectively
The grain lag stage (0–10 DAP) was characterized by active cell division and enlargement to increase the grain
sink size for subsequent accumulation of storage material.
Yu et al. BMC Plant Biology (2016) 16:241
Page 5 of 14
Table 1 K-means clusters of DEPs and distribution of proteins
involved in each category or subcategory in different clusters
Categories or Subcategories
c0
c1
c2
01 Metabolism
84
95
01.01 Carbohydrate metabolism
5
7
01.02 Starch synthesis
2
01.03 Glycolysis
4
c4
Total
32 7
29
247
9
1
10
32
17
3
0
1
23
15
3
0
2
24
01.04 Pyruvate dehydrogenase complex 1
3
1
0
0
5
01.05 TCA pathway
2
2
0
0
8
4
c3
01.06 Alcoholic fermentation
2
5
0
0
0
7
01.07 Pentose phosphate pathway
6
1
0
0
0
7
01.08 Amino acid metabolism
18
22
5
0
3
48
01.09 Nucleotides metabolism
6
7
2
0
2
17
01.10 Lipid and sterol metabolism
23
9
5
6
7
50
01.11 Secondary metabolism
13
7
2
0
4
26
02 Protein synthesis and destination
124
63
82 15
27
311
02.01 Protein synthesis
56
21
24 0
13
114
02.02 Protein folding and modification
23
18
26 3
7
77
02.03 Proteolysis
20
13
21 2
4
60
02.04 Storage protein
2
3
6
10
0
21
02.05 Protein transport
23
8
5
0
3
39
03 Cell growth/division
75
11
13 1
13
113
03.01 Cell growth and DNA related
60
10
10 0
8
88
03.02 Cell wall related
15
1
3
5
25
04 ROS homeostasis
14
12
15 2
15
58
05 Defense/stress response
14
7
35 41
8
105
06 Signal transduction
16
9
13 1
7
46
1
07 Transporters
50
5
17 1
15
88
08 Transcription
18
3
23 1
10
55
09 Photosynthesis
1
1
0
0
6
8
10 PPDK
0
2
0
0
0
2
11 14-3-3 protein
3
0
0
0
0
3
12 Unclassified
67
35
49 12
36
199
The clusters (c0 to c4) were created by Gene Cluster 3.0; raw data for the
clusters are listed in Additional file 4
Previous proteomic analysis had showed that cytoskeleton
proteins (actin and tubulin) which play crucial roles in cell
division and enlargement during embryogenesis [36], were
accumulated to highest levels at this stage. In this study,
we confirmed that most DEPs related to cell growth/division (75 of 113 proteins) preferentially accumulated at
this stage (c0; Table 1), not only including the cytoskeleton
proteins but also other proteins, such as proliferating cell
nuclear antigen and histone (Additional file 4). Proliferating cell nuclear antigen is involved in DNA repair and cell
cycle regulation [37]. Meanwhile, the formation of cell
wall and unit membranes (the structural components of
cells) is also enhanced [38, 39]. As a result, most of the
Fig. 3 K-means clustering of functional DEPs at the eight
developmental stages. The functional DEPs are listed in Additional
file 4, with information on their cluster assignment
DEPs associated with cell wall formation (15 of 25 proteins), such as UDP-glucose 6-dehydrogenases (B6T9P0
and B6TBY8) and the xyloglucan endotransglucosylase/
hydrolase (B4G1Z2) showed maximal accumulation at
this early stage (Additional file 4). The UDP-glucose 6dehydrogenases are involved in cell wall polysaccharide
synthesis, while xyloglucan endotransglucosylase/hydrolase functions in loosening and extending the cell wall
[38]. For the formation of cell membranes, approximately
half of the lipid/sterol metabolism-related proteins (23 of
50 proteins) showed enhanced accumulation, similar to
that found for cell wall-associated proteins (c0; Table 1);
among the enhanced lipid/sterol metabolism-related proteins was as saposin-like type B protein (B6T780), which
can interact with lipids [40] and may function as a surfactant to reduce surface tension [41]. It will be of interest to
fully elucidate the role of this protein in reducing the cell
surface tension that results from cell expansion at this
early stage of maize grain development.
Yu et al. BMC Plant Biology (2016) 16:241
Page 6 of 14
Fig. 4 The functional distribution of DEPs identified from developing maize grains
Active protein turnover was found during early development of rice grain [15]. Here, our analysis showed
that one-third of DEPs involved in proteolysis (20 of 60
proteins) showed maximal accumulation at the early
stage (c0; Table 1). Some of these DEPs were key components of the ubiquitin/26S proteasome pathway (9 of
20 proteins), an important protein degradation pathway
for diverse cellular and developmental events [42, 43].
Meanwhile, a large number of DEPs related to protein
synthesis (56 of 114 proteins) and protein transport (23
of 39 proteins) showed similar accumulation patterns
to those of proteolysis-related proteins (c0; Table 1).
Overall, these results suggested that protein turnover
and rearrangements were also important for maize grain
cell division and enlargement at the early stage.
In maize, proteomics analysis about developing grain
had revealed the regulation of glycolysis and tricarboxylic acid (TCA) cycle at protein levels [7, 8]. The
significantly decreased expression of proteins involved
in these two pathways marks that the grain are entering
mature stage, which indicates the importance of the
regulation of glycolysis and TCA cycle for grain development. However, the regulation of pentose phosphate
pathway (PPP) as another important respiratory pathway in maize grain is relatively little known. The PPP is
central to plant metabolism and functions in providing
reducing power and pentose phosphates for multiple
metabolic pathways [44]. The reducing power is produced in the oxidative part of the PPP (oxPPP) by
glucose-6-phosphate 1-dehydrogenase (G6PDH) and 6phosphogluconate dehydrogenase (6PGDH); G6PDH is
considered to be rate-limiting for oxPPP [44, 45]. Our
analysis identified seven DEPs related to PPP, including
two G6PDHs (B6TSB3 and C0PFX0) and three 6PGDHs
(A0A096SF47, Q9SBJ3 and B4FSV6); these two types of
PPP proteins have not been identified in previous proteomics investigations of maize grain [8, 34, 35]. Surprisingly,
these PPP protein types preferentially accumulated at the
early stage (Table 1; Additional file 4), suggesting that
oxPPP is highly active. G6PDH has been found to show a
similar pattern of decreasing expression during castor
grain development [22]. Overall, these results suggested
that active PPP was crucial for maize early grain development, possibly providing reducing power and pentose
phosphates for the fatty acid and nucleic acid synthesis
required for membrane synthesis and cell division at this
stage [44].
Grain filling in the transition from cell growth to starch
synthesis and accumulation
At the mid stage of grain development (10–40 DAP),
grains showed a small increase in cell numbers and size,
whereas storage materials (mainly starch) began to be rapidly synthesized and accumulated. A striking observation
is that DEPs related to cell growth were rapidly downregulated compared to the early stage, while starch
synthesis related proteins reached their maximal levels at
the mid stage (Table 1), reflecting the transition from
cell division and differentiation to grain filling. In previous studies, the proteomic analysis of the expression
changes of proteins related to starch synthesis during
maize grain development had suffered many restrictions because a small number of these proteins were
detected in grain [7, 8] and quantitative information of
Yu et al. BMC Plant Biology (2016) 16:241
these proteins didn’t cover the entire grain development
stages [14]. In contrast, the iTRAQ method identified and
quantized a considerable number of key proteins related
to starch biosynthesis, including sucrose synthase (SuSy),
ADP-glucose pyrophosphorylase (AGPase), ADP-glucose
brittle-1 transporter (BT1), starch synthase (SS), starch
branching enzyme IIb (SBEIIb), isoamylase I (ISAI), and
starch phosphorylase (SP). Most of these proteins were
grouped into the c1 cluster (Table 1); this analysis provides a comprehensive view of starch biosynthesis during
maize grain development.
1. SuSy, AGPase, and BT1
In plant sink organs, the primary mobilization of
sucrose for starch synthesis is regulated by SuSy
[46]; AGPase catalyzes the first key regulatory step
in starch synthesis by converting glucose-1phosphate (G1P) into ADP-glucose (ADP-Glu) [5].
In maize grain, SuSy transcript levels were reported
to increase until the middle of development and to
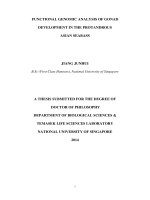
decline thereafter [10]. In our study, four isozymes
of SuSy were identified as DEPs (Fig. 5). One SuSy
isozyme (C0P6F8) exhibited a stable expression level
until 20 DAP, and rapidly decreased thereafter. Two
other isozymes (Q93WS3 and B6U1D7) increased
until 20 DAP and one (K7VDR8) until 30 DAP, and
then all decreased; these patterns are consistent with
those of transcription. This suggests that two types
of SuSy may be active during the early (type I) and
middle (type II) stages of grain development. Five
isoforms of AGPase were identified as DEPs (Fig. 5),
and the expression level of four of these peaked
around 20 DAP, when starch synthesis was at its
greatest. In cereal grain such as maize and rice,
cytoplasmic AGPases contribute most of the total
AGPase activity [5]. Much of the ADP-Glu used for
the biosynthesis of starch is synthesized in the
cytosol and then imported into the amyloplast by
BT1, the activity of which is closely related to the
transport efficiency of ADP-Glu [47, 48]. One BT1
was identified in our study (Fig. 5), and peaked in
level around 20 DAP, similar to the expression
pattern of AGPase. The co-expression of AGPase
and BT1 may ensure the efficient supply of ADPGlu necessary for starch synthesis.
2. SS and SBEIIb
SS functions in the elongation of glucan chains
through the action of granule-bound starch
synthases (GBSSI and II) and soluble starch
synthases (SSSI to IV) that are responsible for
amylose and amylopectin synthesis, respectively [5].
Our study identified differential expression patterns
of two isoforms of GBSSI, one of GBSSIIa, two of
SSSI, one of SSSIIa, and one of SSSIII in developing
Page 7 of 14
grain (Fig. 5). GBSSIIa was down-regulated,
whereas GBSSI was continuously up-regulated as
starch accumulation increased (Fig. 5), supporting
previous reports that GBSSI is dedicated to the
synthesis of amylase [5, 49]. Previous studies have
found that most SSS activity was dependent on
SSSI and SSSIII products [50]. We found that SSSI
peaked around 20 DAP, consistent with the
dynamic changes of starch accumulation, whereas
the abundance of SSSIII peaked at 6 and 50 DAP.
Interestingly, SSSIIa was also identified as a DEP,
and was found to show peak expression at 20 DAP,
similar to the expression pattern of SSSI (Fig. 5).
This result suggests that the contribution of SSSIIa
to global SSS activity in the maize grain needs to be
re-evaluated. Three types of starch branching enzyme (SBEIa, SBEIIa, and SBEIIb) are present in
maize, and are involved in determining the branch
density and branching pattern of amylopectin [51].
Four isoforms of SBEIIb were identified as DEPs
(Fig. 5); three of the isoforms showed peak
expression around 20 DAP, similar to the expression patterns of AGPase, BT1, SSSI, and SSSIIa.
Together, these results suggested that synchronized
expression and/or activity of AGPase, BT1, SBE,
and SSS are essential for starch synthesis.
3. ISA and SP
ISA is comprised of three types, namely ISAI,
ISAII, and ISAIII, and is a starch debranching
enzyme that hydrolyzes the α-1, 6-glucosic linkages of polyglucans. In contrast, SP catalyzes the
reversible transfer of glucosyl units from G1P to
the non-reducing end of an α-1, 4-linked glucan
chain [5]. In this study, two DEPs were identified
as ISAI and SP (Fig. 5), and both peaked in expression around 15 DAP. In rice grain, ISAs show their
maximum accumulation at the grain filling stage
[15], and they determined the amount of starch
granules by affecting the initiation of starch granules [52]. In maize, ISAs were also required for
normal starch granule growth [53]. Initially, it was
thought that SP had a degradative rather than a
biosynthetic function in starch metabolism;
however, genetic analysis of rice grain mutants
suggested a role for SP in facilitating the starch
synthesis initiation process [54]. A recent study
proposed that SP has a significant role in establishing the pool of linear short-chain maltooligosaccharides that may serve as a primer for
starch synthesis in rice grains [55]. Therefore, in
maize grain, the co-expression of ISA and SP
during rapid starch accumulation stage suggests
that SP may have a role in the process of starch
synthesis initiation.
Yu et al. BMC Plant Biology (2016) 16:241
Page 8 of 14
Fig. 5 The expression levels of proteins involved in starch metabolism. The vertical axis shows the relative expression ratio to 3 DAP of each isoform at
each developmental stage (DAP; horizontal axis)
Protein expression characteristics during grain maturation
stage
At the maturation stage (40–50 DAP), grains showed
slow accumulation of storage materials but also began
to undergo desiccation to finally acquire desiccation
tolerance. Almost all storage related DEPs (16 of 21
proteins; e.g., globulins, legumins, alpha and gamma
zeins) accumulated at their maximal levels at this stage
(c2 and c3; Table 1). These proteins gradually degenerate during germination and act as a nitrogen source
and carbon skeleton for seedling growth and development. The folding of nascent polypeptides into mature
proteins is controlled by a number of molecular chaperones and protein-folding catalysts. Accordingly, a
substantial proportion of DEPs involved in protein
folding/modification (29 of 77 proteins; e.g., heat shock
Yu et al. BMC Plant Biology (2016) 16:241
proteins and chaperones/chaperonins) were concurrently expressed with storage proteins (c2 and c3;
Table 1); these proteins are good candidates for studying the folding and assembly of storage proteins in
maize grain. Surprisingly, many DEPs related to proteolysis (23 of 60 proteins) also showed significant accumulation at this stage (c2 and c3; Table 1), and most of
these were ubiquitin proteins (13 of 23 proteins). Ubiquitin is a highly conserved protein, and ubiquitination
is a major modifier of signaling in all eukaryotes. The
ubiquitin/26S proteasome pathway is the primary
proteolysis mechanism for diverse cellular and developmental events [42, 43]. Therefore, the changes in
expression abundance of ubiquitin proteins indicated
that ubiquitination might play an important role during the maturation stage.
Interestingly, we also noticed four oleosins (B6SIZ2,
B6SI42, B6TMT0 and P21641) and one steroleosin
(B6UGU4) showed their highest accumulation levels at a
late stage (Additional file 4). Both oleosins and steroleosins can be embedded in the monolayer membrane of
phospholipids that surround oilbodies, the main lipid
storage organelle in cereal crops [56, 57]. Oleosins are
the major proteins preventing oilbody coalescence [56]
and/or modulating the size of oilbodies [57]. During
maize grain dehydration, oilbodies may coalesce due to
cytoplasmic compression; thus, the accumulation of
oleosins and steroleosins may have a role in the control
of oilbody structure and lipid accumulation in maize
grain.
During the maturation stage, another remarkable feature is that a large number of DEPs related to stress/
defense (76 of 105 proteins) showed maximal accumulation (c2 and c3; Table 1); examples are late embryogenesis abundant (LEA) proteins, including one from LEA
group 1 (K7VM99), three from LEA 14-A (B4F9K0,
B4G1C1 and B6UH99), three from LEA group 3
(B6SID7, B6SJ28 and B6UI06), and four from LEA D-34
(A0A096TZ44, B6SN63, B6SNS4 and B6UH67) (Additional file 4). The increased expression of LEA proteins
during the grain maturation stage has also been observed in rice [19] and wheat [31]. The presence and increased level of LEA proteins is correlated with
desiccation tolerance [58, 59], and their expression is
also induced in response to diverse abiotic or biotic
stresses [59]. Therefore, the LEA proteins may be involved in protecting grain from serious dehydration at
the late developmental stage. A recent proteomics study
suggested that LEA proteins may also be an essential
factor for maize grain viability [35]. Overall, these
stress/defense-related proteins indicate the presence of
a coordinated adverse response and defense mechanism
during maize grain development, which could protect
grain from adverse environments. More importantly,
Page 9 of 14
single or multiple proteins related to stress/defense
might be of use as protein markers for the breeding of
stress tolerant maize.
ROS homeostasis regulation during grain development
At the early stages of maize grain development (4–14
DAP), oxygen levels are high and mitochondrial respiration is intense; at the late stages, grain primarily suffer
from various stresses such as dehydration and hypoxia
[60]. Under stress conditions, reactive oxygen species
(ROS), such as superoxide radicals, hydrogen peroxide,
and hydroxyl radicals, can be continuously generated
[61]; these can damage cellular components but are
also important for signaling in the regulation of many
biological processes [62]. Cells have developed a wide
range of antioxidant systems to maintain ROS homeostasis [61, 62]. In developing maize grain, 58 DEPs were
identified as ROS related proteins (e.g., dehydroascorbate reductase, glutathione S-transferase, superoxide
dismutase, and thioredoxin); these were involved in diverse antioxidant systems [61]. Further analysis showed
that 14, 12, and 17 DEPs were at their maximal levels
of accumulation in early, middle, and late stages, respectively. Fifteen DEPs showed significant accumulation at both early and late stages (Table 1; Additional
file 4). The diverse expression patterns of these proteins
suggested coordination of multiple complex antioxidant
systems at different developmental stages. Among the
identified DEPs were 1-cys-peroxiredoxin (1cys-Prx;
A2SZW8) and zinc metallothionein class II (P43401),
both of which showed maximum accumulation levels at
the late stage (Additional file 4). Although 1cys-Prx was
proposed to be involved in the maintenance of grain
dormancy [63], other lines of evidence indicate that it
has no significant correlation with dormancy but does
confer higher resistance to oxidative stress [64] or can
act as a sensor to inhibit grain germination under unfavorable conditions [65]. A recent study has further
proposed that 1cys-Prx in grain may act as a molecular
chaperone for protection of grain development under
severe conditions [66]. The zinc metallothionein class
II protein belongs to the metallothionein family, which
might play important roles in maintaining essential
metal homeostasis, detoxification of toxic metals, and
protection against intercellular oxidative stress [67, 68].
In light of these functions, the high level of zinc metallothionein class II accumulation may be required for
functions against intercellular oxidative stress and/or
provide a means for storing Zn and other metals required for seedling growth after germination. The peak
accumulation of zinc metallothionein class II proteins
was similarly observed during the late stage of wheat
grain development [69].
Yu et al. BMC Plant Biology (2016) 16:241
Possible role for PPDK in starch synthesis and energy
supply
The pyruvate orthophosphate dikinase (PPDK) catalyzes
the reversible conversion of pyruvate (Pyr), ATP, and Pi
into phosphoenolpyruvate (PEP), AMP, and PPi. It is a
photosynthetic enzyme in the C4 cycle, but many proteomic studies have found that multiple isoforms of PPDK
accumulate at high levels in the developing grain of
cereals such as rice [15] and wheat [31], indicating that
PPDK has an essential role in grain development. In
maize, the genome has two loci encoding three types of
PPDK proteins: PPDKZM1 encode a C4-type chloroplastic PPDK1 and cytosolic PPDK1 by alternative
splicing, and PPDKZM2 contributes another cytosolic
PPDK2 [70]. In this study, PPDK1 (B7ZYP6) and
PPDK2 (K7UZT6) were identified as DEPs, and both
grouped into cluster 1, displayed low expression levels
during the early stage, increased significantly at 15–20
DAP, and decreased thereafter (Table 1; Additional file
4). In contrast, in rice grain, PPDK proteins are mostly
expressed in the early stage rather than the grain filling
stage [71]. The different expression patterns among
species, as well as the cycle between PEP and Pyr and
the PPi-ATP balance, might reflect the multiple functions of PPDK proteins during grain development [71].
However, their precise function (s) in maize grain
development remains to be elucidated.
Based on our results, PPDK may function preferentially in the PEP to Pyr forming direction. Consistent
with the PPDK expression pattern, most DEPs related to
glycolysis (15 of 24 proteins) showed their highest
expression levels at 15–20 DAP (c1; Table 1). The exception was pyruvate kinase (PK, B6TII5) which is an irreversible enzyme that converts PEP to Pyr; this enzyme
showed continuous down-regulation during grain development (Additional file 4). These results suggest that
proteins involved in active glycolysis participate in reactions leading to the increased production of PEP,
whereas PEP is not efficiently converted to Pyr owing to
the down regulation of PK. Meanwhile, most of the proteins involved in alcoholic fermentation (5 of 7 proteins),
such as pyruvate decarboxylase, alcohol dehydrogenase,
and those involved in the pyruvate dehydrogenase complex (3 of 5 proteins), were preferentially grouped into
cluster 1 (Table 1; Additional file 4). This pattern of
expression was comparable with that of PPDK and
glycolysis. These results indicate that Pyr, as a reaction
substrate, was a principal target for the active pyruvate
dehydrogenase complex and alcoholic fermentation
pathway. Therefore, as an additional complement pathway, PPDK may act to catalyze PEP to generate sufficient
Pyr for the above two processes.
Importantly, Pyr formation may be beneficial to starch
synthesis and energy supply at the grain filling stage.
Page 10 of 14
Our results showed that most starch synthesis related
proteins including AGPase were grouped into cluster 1
(Table 1; Additional file 4), which was consistent with
the PPDK expression pattern. As a key rate-limiting enzyme of starch synthesis, AGPase catalyzes a completely
reversible reaction, and the direction of the reaction depends on the relative concentrations of PPi and ATP.
Thus, the PPDK-dominated PEP to Pyr formation might
reduce cytosolic PPi accumulation and push the reaction
to ADP-Glu synthesis, which facilitates starch synthesis
and accumulation. This proposal is supported by the
findings of another study in rice grain in which mutations of the gene encoding PPDK showed the importance of the function of this enzyme in starch synthesis
[72]. In addition, the cereal endosperm of species such
as maize and rice is typically a hypoxic tissue in which
ATP generation is inhibited by a decrease in internal
oxygen concentration during grain development [60, 73].
Therefore, the PPDK-dominated PEP to Pyr formation
may contribute to the energy supply by converting AMP
to ATP and also by producing Pyr as a substrate for the
active alcoholic fermentation pathway (see above). The
latter pathway generates ATP without the consumption
of oxygen [74], and helps to maintain the appropriate
ATP level for starch synthesis under low oxygen tension.
A further clue to PPDK function is provided by the fact
that its expression is enhanced under low-oxygen stress
in rice roots [75]. Together, these lines of evidence indicate that PPDK may function preferentially in the PEP
to Pyr forming direction, and thereby reduce cytosolic
PPi accumulation and increase ATP content, to finally
facilitate starch synthesis and energy supply at the grain
filling stage.
14-3-3 proteins may perform an important role during
grain development
In this study, three isoforms of 14-3-3 proteins (B4FRG1,
B6SZB9, and B6T7L9) were identified as DEPs. Interestingly, all three showed significant accumulation at the
early stage (3–10 DAP), and then decreased to low levels
until grain maturity (c1; Table 1). Similar expression patterns have also been observed in other species, such as
castor [22] and rice [15], suggesting a possible role in
grain development. Several studies have reported that 143-3 proteins are involved in various cellular physiological
processes, such as cell signal transduction, cell cycle regulation, nitrogen and carbon assimilation, and defense
mechanisms [76, 77]. In barley and maize grain, 14-3-3
proteins might interact with starch synthesis related
enzymes, such as ADPase, GBSS, SBE, and ISA [78, 79],
indicating that they might be involved in the regulation of
starch synthesis. Interestingly, in Arabidopsis leaves,
reduction or over-expression of 14-3-3 proteins is correlated with dramatic increases or decreases, respectively, in
Yu et al. BMC Plant Biology (2016) 16:241
starch content [80, 81]. In addition, proteomic and western blotting analyses of rice grain showed that 14-3-3 proteins display a lower level of expression in grains with
high starch content than in grain with low starch content
[82]. Therefore, it has been suggested that high expression
of 14-3-3 proteins may decrease the activity of enzymes
related to starch synthesis, and may consequently be detrimental to starch formation and accumulation [80, 82].
Consistent with this hypothesis, we found here that the
highest level of expression of 14-3-3 proteins occurred
at the early stage, and that this level fell dramatically
after 10 DAP when starch synthesis enzymes began to
be up-regulated. Nonetheless, the underlying mechanism of 14-3-3 proteins in regulating starch synthesis
still remains to be elucidated; determination of the role
of these proteins may be of value for improving starch
productivity in crop plants.
Conclusions
We explored the dynamic changes in protein expression
during eight sequential developmental stages from 3 to
50 DAP in maize grain. Applying iTRAQ technology,
4751 proteins were identified and 1235 were classified as
DEPs during grain development, reflecting the fact that
iTRAQ-based quantitative proteome analysis is a powerful technique for describing complex metabolic processes.
Our results indicated that coordination of metabolism and
cellular processes is associated with different developmental stages in grain; for example, the DEPs involved in cell
growth/division are down-regulated after the early stage,
whereas those related to starch biosynthesis and defense/
stress are significantly up-regulated at the middle and late
stages, respectively. We also demonstrate coordination of
a multiplicity of proteins in the antioxidant system at different developmental stages, which is essential for maintenance of ROS homeostasis. In addition, some DEPs,
such as zinc metallothionein class II, PPDK, and 14-3-3
proteins, undergo major changes in expression at specific
developmental stages, suggesting their important roles in
maize grain development. These results provide novel
clues for the further understanding of the molecular
mechanisms influencing maize grain yield and quality.
Methods
Plant material and sampling
The elite Chinese maize cultivar Denghai 661 (DH351/
DH372) was used in this study. The seed was obtained
from Shandong Denghai Seeds Co., Ltd. (Laizhou, China).
Plants were grown during the maize growing season at the
experimental farm of Shandong Agricultural University,
Taian (36°10′E, 117°04′N), China. Plants flowering on the
same day were tagged and artificially self-pollinated. Nine
ears were collected at each stage of 3, 5, 10, 15, 20, 30, 40,
and 50 DAP. In order to increase the uniformity of the
Page 11 of 14
material, fertilized grains from the middle part of each ear
were sampled. For each stage, three samples were prepared by mixing an equal number of grains from three
cobs; the samples were stored immediately at −80 °C until
protein extraction. Fresh weight and dry weight were
measured at each grain stage. Grains of 10–50 DAP and
3–30 DAP were collected for the determination of total
starch content and number of endosperm cells, respectively, as described previously [83].
Protein extraction
Grain samples were ground into fine powder in liquid nitrogen using a mortar and pestle; the powder was suspended in a 10-fold volume of precooled acetone (−20 °C)
containing 10 % (v/v) trichloroacetic acid (TCA). The
homogenate was then precipitated for 2 h at −20 °C after
thorough mixing. The homogenate was then centrifuged
for 30 min at 20,000 g at 4 °C, and the supernatant was
carefully removed; the pellet was rinsed three times with
cold acetone, left at −20 °C for 30 min, and then centrifuged at 20,000 g for 30 min at 4 °C. The resulting pellets
was dissolved in lysis buffer containing 8 M urea, 30 mM
HEPES, 1 mM polyvinylpolypyrrolidone (PMSF), 2 mM
EDTA, and 10 mM dithiothreitol (DTT) and then sonicated for 5 min. The dissolved protein extract was centrifuged at 20,000 g for 30 min at 4 °C, the supernatant was
collected and reduced with 10 mM DTT at 56 °C for 1 h,
and then alkylated with 55 mM iodoacetamide (IAM) for
1 h in the dark. The mixture was precipitated using a 5fold volume of cold acetone at −20 °C for 3 h, followed by
centrifugation at 20,000 g for 30 min. The resulting pellet
was dissolved in 0.5 M triethylammonium bicarbonate
(TEAB) buffer with 0.1 % SDS, sonicated for 5 min, and
centrifuged at 20,000 g for 30 min. The supernatant was
used for liquid digestion, and the protein concentration
was determined using the Bradford assay (Bio-Rad,
Hercules, CA, USA) with BSA as a standard.
In solution digestion and iTRAQ labeling
For each sample, 3.3 μL trypsin (1 μg/μL) (Promega,
Madison, WI, USA) was added to 100 μg of protein in
TEAB buffer and the proteins were digested at 37 °C for
24 h. A fresh aliquot of trypsin (1 μL) was added, and
the sample was digested again for 12 h. The precipitate
was dissolved in 30 μL 0.5 M TEAB and mixed with
70 μL isopropanol. Then, the digested peptides were labeled with iTRAQ reagents (AB SCIEX, Framingham,
MA, USA) according to the manufacturer’s instructions.
The grain samples obtained from 3, 5, 10, 15, 20, 30, 40,
and 50 DAP were labeled with iTRAQ reagents 113,
114, 115, 116, 117, 118, 119, and 121, respectively. Three
independent biological experiments were performed.
Yu et al. BMC Plant Biology (2016) 16:241
SCX and LC-MS/MS
The pooled peptides were dissolved in strong cation exchange (SCX) buffer A (10 mM potassium phosphate
monobasic (KH2PO4) in 25 % acetonitrile, pH 2.8). The
mixture was adjusted to pH 3 using phosphoric acid, and
then fractionated using a high-performance liquid chromatography (HPLC) system (Shimadzu, Kyoto, Japan)
equipped with a silica-based SCX column (250 × 4.6 mm,
5 μm, 100 Å, Phenomenex, Torrance, CA, USA). In total,
36 fractions were collected at a flow rate of 1 mL/min with
buffer B (10 mM KH2PO4 and 2 M potassium chloride
(KCl) in 25 % acetonitrile, pH 2.8) with the following gradient: 0 % for 45 min, 0–5 % for 1 min, 5–30 % for
20 min, 30–50 % for 5 min and maintained for 5 min, and
50–100 % for 5 min, and maintained for 10 min. The fractions were desalted with a strata-X 33 μm PolyRevStage
SPE (Phenomenex) following the manufacturer’s instructions and lyophilized in a centrifugal speed vacuum concentrator. Then, 30 μL of 0.1 % formic acid was added to each
dried fraction tube, and 0.1 μL of the re-dissolved solution
was spotted on the target well of an Anchor-chip plate for
MALDI-TOF testing. After the MALDI-TOF (Bruker Daltonics, Germany) test, the 36 fractions were combined into
16 final fractions according to the peak area.
The mass spectrometry analysis was performed on a
Dionex Ultimate 3000 Nano LC system connected to a
Q-Exactive mass spectrometer (Thermo Fisher Scientific,
MA, USA). The peptide mixtures were loaded onto a
Acclaim PePmap C18-reversed phase column (75 μm ×
2 cm, 3 μm, 100 Å, Thermo Scientific) and separated with a
reversed phase C18 column (75 μm × 10 cm, 5 μm, 300 Å,
Agela Technologies) using a gradient of 5–80 % (v/v) acetonitrile in 0.1 % formic acid over 45 min at a flow rate of
300 nL/ min. Solvent A was 0.1 % formic acid in water. A
full mass spectrometry (MS) scan (350–2000 m/z) was
acquired in the positive ion mode at a resolution of 70,000
(at 200 m/z), an AGC target value of 3–6, a maximum ion
accumulation time of 50 ms, number of scan ranges of 1,
and dynamic exclusion of 15 s. Information on peptides and
peptide fragments m/z were obtained using the following
conditions: 20 fragment files were collected after every full
scan (MS2 scan), higher collision energy dissociation (HCD)
fragmentation, an isolation window of 2 m/z, full scan at a
resolution of 17,500 (at 200 m/z), micro-scans of 1, a maximum ion accumulation time of 100 ms, normalized collision energy of 28 eV, and an under-fill ratio of 1 %.
Data analysis
For protein identification, the MS raw files were processed
with Proteome Discoverer 1.3 (Thermo Fisher Scientific)
and searched with in-house MASCOT software 2.3.01
(Matrix Science, London, UK). The acquired MS/MS
spectra were automatically searched against a UniProtZeamays protein database (86,922 sequences in December
Page 12 of 14
2014). The search parameters were as follows: trypsin was
chosen as the enzyme with one missed cleavage allowed;
fixed modifications of carbamidomethylation of cysteine
residues; iTRAQ 8-plex modification of the N terminus, K
and Y, Gln → Pyro-Glu of the N terminus and oxidation
of methionine were set as variable modifications; peptide
tolerance was set at 15 ppm; and MS/MS tolerance was
set at 20 mmu. At least one unique peptide with a false
discovery rate (FDR) ≤1 % was required for protein identification and quantification data analysis.
Two criteria were used for the quantitation of the identified proteins: 1) the median protein ratio was chosen; 2)
the minimum precursor charge was set to 2 and only
unique peptides were used for quantitation. The labeled
samples obtained at 3 DAP were used as a reference (REF)
based on the weighted average of the intensity of report
ions in each identified peptide. To indicate the abundance
of a protein at each stage, the relative protein ratios of
samples of each stage against 3 DAP were calculated as
the median of all peptides belonging to the assigned sample (3 d/REF, 5 d/REF, 10 d/REF, 15 d/REF, 20 d/REF, 30
d/REF, 40 d/REF, and 50 d/REF). For analysis of DEPs
during grain development, only proteins with quantitative
information from at least two biological replicates were
used. The average of three biological replicates was used
to indicate final protein abundance at each stage, and proteins showing average protein abundance that changed
significantly by more than 1.5-fold in different stages
(ANOVA test, p ≤ 0.05) were defined as DEPs. The Kmeans clustering analysis of the log-transformed foldchange expression values for the DEPs was conducted
with Cluster 3.0 software ( />software/cluster/software.htm) using similarity metric and
Euclidean distances. The number of clusters was set as 5
and the result was visualized using the associated Java
TreeView 1.1.1 software.
Additional files
Additional file 1: Total proteins identified in maize grains (XLSX 745 kb)
Additional file 2: Expression profile data for quantified proteins
(XLSX 1136 kb)
Additional file 3: The homologs of uncharacterized proteins in maize
grains (XLSX 48 kb)
Additional file 4: The DEPs were allocated to functional categories and
cluster membership (XLSX 166 kb)
Acknowledgements
This work was supported by the grants from the National Natural Science
Foundation of China (31371576), the National Key Research and Development
Program of China (2016YFD0300106; 2016YFD0300205), the National Key
Technology Support Program of China (2013BAD07B06–2), the China National
Public Welfare Industry (Agriculture) Plan (201203100; 201203096), the Shandong
Modern Agricultural Technology & Industry System (SDAIT-02-08), the Agriculture
Technology Innovation Project of Shandong Province and Shandong Provincial Key
Laboratory of Corn Breeding and Cultivation Technology, and the Project of
Shandong Province Higher Educational Science and Technology Program (J14LF10).
Yu et al. BMC Plant Biology (2016) 16:241
Funding
Not applicable.
Availability of data and materials
The datasets supporting the conclusions of this article are included within
the article and its additional files.
Authors’ contributions
YT and LG carried out all experiments and data analysis. ZJ and ZB performed
field experiments and sampling. DS and LP conceived the study, planned the
experiments, and helped draft the manuscript. All authors read and approved
the final manuscript.
Authors’ information
Not applicable.
Competing interests
The authors declare that they have no competing interests.
Consent for publication
Not applicable.
Ethics approval and consent to participate
Not applicable.
Received: 23 April 2016 Accepted: 18 August 2016
References
1. Prioul JL, Méchin V, Lessard P, Thévenot C, Grimmer M, Chateau-Joubert S, et
al. A joint transcriptomic, proteomic and metabolic analysis of maize
endosperm development and starch filling. Plant Biotechnol J. 2008;6:855–69.
2. Olsen OA. Endosperm development. cellularization and cell fate
specification. Annu Rev Plant Biol. 2001;52:233–67.
3. Sabelli PA, Larkins BA. The development of endosperm in grasses. Plant
Physiol. 2009;149:14–26.
4. Nelson O, Pan D. Starch synthesis in maize endosperms. Annu Rev Plant
Biol. 1995;46:475–96.
5. Jeon J, Ryoo N, Hahn T, Walia H, Nakamura Y. Starch biosynthesis in cereal
endosperm. Plant Physiol Biochem. 2010;48:383–92.
6. James MG, Denyer K, Myers AM. Starch synthesis in the cereal endosperm.
Curr Opin Plant Biol. 2003;6:215–22.
7. Jin X, Fu Z, Ding D, Li W, Liu Z, Tang J. Proteomic identification of genes
associated with maize grain-filling rate. PLoS One. 2013;8:e59353.
8. Méchin V, Thévenot C, Le Guilloux M, Prioul JL, Damerval C. Developmental
analysis of maize endosperm proteome suggests a pivotal role for pyruvate
orthophosphate dikinase. Plant Physiol. 2007;143:1203–19.
9. Li G, Wang D, Yang R, Logan K, Chen H, Zhang S, et al. Temporal patterns
of gene expression in developing maize endosperm identified through
transcriptome sequencing. Proc Natl Acad Sci U S A. 2014;111:7582–7.
10. Chen J, Zeng B, Zhang M, Xie S, Wang G, Hauck A, et al. Dynamic
transcriptome landscape of maize embryo and endosperm development.
Plant Physiol. 2014;166:252–64.
11. Verza NC, e Silva TR, Neto GC, Nogueira FT, Fisch PH, de Rosa Jr VE, et al.
Endosperm-preferred expression of maize genes as revealed by
transcriptome-wide analysis of expressed sequence tags. Plant Mol Biol.
2005;59:363–74.
12. Sekhon RS, Lin H, Childs KL, Hansey CN, Buell CR, de Leon N, et al. Genomewide atlas of transcription during maize development. Plant J. 2011;66:553–63.
13. Teoh KT, Requesens DV, Devaiah SP, Johnson D, Huang X, Howard JA, et al.
Transcriptome analysis of embryo maturation in maize. BMC Plant Biol.
2013;13:19.
14. Walley JW, Shen Z, Sartor R, Wu KJ, Osborn J, Smith LG, et al. Reconstruction
of protein networks from an atlas of maize seed proteotypes. Proc Natl
Acad Sci U S A. 2013;110:E4808–17.
15. Xu SB, Li T, Deng ZY, Chong K, Xue Y, Wang T. Dynamic proteomic analysis
reveals a switch between central carbon metabolism and alcoholic
fermentation in rice filling grains. Plant Physiol. 2008;148:908–25.
16. Hu G, Koh J, Yoo MJ, Grupp K, Chen S, Wendel JF. Proteomic profiling of
developing cotton fibers from wild and domesticated Gossypium
barbadense. New Phytol. 2013;200:570–82.
Page 13 of 14
17. Hajduch M, Hearne LB, Miernyk JA, Casteel JE, Joshi T, Agrawal GK, et al.
Systems analysis of seed filling in Arabidopsis: using general linear
modeling to assess concordance of transcript and protein expression. Plant
Physiol. 2010;152:2078–87.
18. Tasleem-Tahir A, Nadaud I, Girousse C, Martre P, Marion D, Branlard G.
Proteomic analysis of peripheral layers during wheat (Triticum aestivum L.)
grain development. Proteomics. 2011;11:371–9.
19. Xu H, Zhang W, Gao Y, Zhao Y, Guo L, Wang J. Proteomic analysis of
embryo development in rice (Oryza sativa). Planta. 2012;235:687–701.
20. Dupont FM. Metabolic pathways of the wheat (Triticum aestivum)
endosperm amyloplast revealed by proteomics. BMC Plant Biol. 2008;8:39.
21. Finnie C, Melchior S, Roepstorff P, Svensson B. Proteome analysis of grain
filling and seed maturation in barley. Plant Physiol. 2002;129:1308–19.
22. Houston NL, Hajduch M, Thelen JJ. Quantitative proteomics of seed filling in
castor: comparison with soybean and rapeseed reveals differences between
photosynthetic and nonphotosynthetic seed metabolism. Plant Physiol.
2009;151:857–68.
23. Gallardo K, Le Signor C, Vandekerckhove J, Thompson RD, Burstin J.
Proteomics of Medicago truncatula seed development establishes the time
frame of diverse metabolic processes related to reserve accumulation. Plant
Physiol. 2003;133:664–82.
24. Hajduch M, Ganapathy A, Stein JW, Thelen JJ. A systematic proteomic study
of seed filling in soybean. Establishment of high-resolution two-dimensional
reference maps, expression profiles, and an interactive proteome database.
Plant Physiol. 2005;137:1397–419.
25. Agrawal GK, Hajduch M, Graham K, Thelen JJ. In-depth investigation of the
soybean seed-filling proteome and comparison with a parallel study of
rapeseed. Plant Physiol. 2008;148:504–18.
26. Lilley KS, Razzaq A, Dupree P. Two-dimensional gel electrophoresis: recent
advances in sample preparation, detection and quantitation. Curr Opin
Chem Biol. 2002;6:46–50.
27. Wu WW, Wang G, Baek SJ, Shen RF. Comparative study of three proteomic
quantitative methods, DIGE, cICAT, and iTRAQ, using 2D gel-or LC-MALDI
TOF/TOF. J Proteome Res. 2006;5:651–8.
28. Karp NA, Huber W, Sadowski PG, Charles PD, Hseter SV, Lilley KS. Addressing
accuracy and precision issues in iTRAQ quantitation. Mol Cell Proteomics.
2010;9:1885–97.
29. Schulze WX, Usadel B. Quantitation in mass-spectrometry-based proteomics.
Annu Rev Plant Biol. 2010;61:491–516.
30. Zi J, Zhang J, Wang Q, Zhou B, Zhong J, Zhang C, et al. Stress
responsive proteins are actively regulated during rice (Oryza sativa)
embryogenesis as indicated by quantitative proteomics analysis. PLoS
One. 2013;8:e74229.
31. Ma C, Zhou J, Chen G, Bian Y, Lv D, Li X, et al. iTRAQ-based quantitative
proteome and phosphoprotein characterization reveals the central
metabolism changes involved in wheat grain development. BMC
Genomics. 2014;15:1029.
32. Méchin V, Balliau T, Chateau-Joubert S, Davanture M, Langella O, Negroni L,
et al. A two dimensional proteome map of maize endosperm.
Phytochemistry. 2004;65:1609–18.
33. Xin X, Lin XH, Zhou YC, Chen XL, Liu X, Lu XX. Proteome analysis of maize
seeds: the effect of artificial ageing. Physiol Plant. 2011;143:126–38.
34. Huang H, Møller IM, Song SQ. Proteomics of desiccation tolerance
during development and germination of maize embryos. J Proteomics.
2012;75:1247–62.
35. Wu X, Liu H, Wang W, Chen S, Hu X, Li C. Proteomic analysis of seed
viability in maize. Acta Physiol Plant. 2011;33:181–91.
36. Mayer U, Jurgens G. Microtubule cytoskeleton a track record. Curr Opin
Plant Biol. 2002;5:494–501.
37. Herrera I, De La Paz Sánchez M, Molina J, Plasencia J, Vázquez-Ramos JM.
Proliferating cell nuclear antigen expression in maize grain development
and germination: regulation by phytohormones and its association with
putative cell cycle proteins. Physiol Plant. 2000;110:127–34.
38. Guillaumie S, San-Clemente H, Deswarte C, Martinez Y, Lapierre C,
Murigneux A, et al. MAIZEWALL. Database and developmental gene
expression profiling of cell wall biosynthesis and assembly in maize. Plant
Physiol. 2007;143:339–63.
39. Martin SW, Glover BJ, Davies JM. Lipid microdomains-plant membranes get
organized. Trends Plant Sci. 2005;10:263–5.
40. Bruhn H. A short guided tour through functional and structural features of
saposin-like proteins. Biochem J. 2005;389:249–57.
Yu et al. BMC Plant Biology (2016) 16:241
41. Cochrane CG, Revak SD. Pulmonary surfactant protein B (SP-B): structurefunction relationships. Science. 1991;254:566–8.
42. Moon J, Parry G, Estelle M. The ubiquitin-proteasome pathway and plant
development. Plant Cell. 2004;16:3181–95.
43. Vierstra RD. The ubiquitin-26S proteasome system at the nexus of plant
biology. Nat Rev Mol Cell Biol. 2009;10:385–97.
44. Kruger NJ, von Schaewen A. The oxidative pentose phosphate pathway:
structure and organisation. Curr Opin Plant Biol. 2003;6:236–46.
45. Horecker BL. The pentose phosphate pathway. J Biol Chem. 2002;277:47965–71.
46. Wang F, Sanz A, Brenner ML, Smith A. Sucrose synthase, starch
accumulation, and tomato fruit sink strength. Plant Physiol. 1993;101:321–7.
47. Shannon JC, Pien FM, Cao H, Liu KC. Brittle-1, an adenylate translocator,
facilitates transfer of extraplastidial synthesized ADP-glucose into
amyloplasts of maize endosperms. Plant Physiol. 1998;117:1235–52.
48. Bowsher CG, Scrase-Field EF, Esposito S, Emes MJ, Tetlow IJ. Characterization
of ADP-glucose transport across the cereal endosperm amyloplast
envelope. J Exp Bot. 2007;58:1321–32.
49. Shure M, Wessler S, Fedoroff N. Molecular identification and isolation of the
waxy locus in maize. Cell. 1983;35:225–33.
50. Cao H, Imparl-Radosevich J, Guan H, Keeling PL, James MG, Myers AM.
Identification of the soluble starch synthase activities of maize endosperm.
Plant Physiol. 1999;120:205–16.
51. Yao Y, Thompson DB, Guiltinan MJ. Maize starch-branching enzyme
isoforms and amylopectin structure. In the absence of starch-branching
enzyme IIb, the further absence of starch-branching enzyme Ia leads to
increased branching. Plant Physiol. 2004;136:3515–23.
52. Kawagoe Y, Kubo A, Satoh H, Takaiwa F, Nakamura Y. Roles of isoamylase
and ADP-glucose pyrophosphorylase in starch granule synthesis in rice
endosperm. Plant J. 2005;42:164–74.
53. Kubo A, Colleoni C, Dinges JR, Lin QH, Lappe RR, Rivenbark JG, et al. Functions
of heteromeric and homomeric isoamylase-type starch-debranching enzymes
in developing maize endosperm. Plant Physiol. 2010;153:956–69.
54. Satoh H, Shibahara K, Tokunaga T, Nishi A, Tasaki M, Hwang SK, et al.
Mutation of the plastidial α-glucan phosphorylase gene in rice affects
the synthesis and structure of starch in the endosperm. Plant Cell.
2008;20:1833–49.
55. Hwang SK, Nishi A, Satoh H, Okita TW. Rice endosperm-specific plastidial
α-glucan phosphorylase is important for synthesis of short-chain maltooligosaccharides. Arch Biochem Biophys. 2010;495:82–92.
56. Tzen JT, Huang AH. Surface structure and properties of plant seed oil
bodies. J Cell Biol. 1992;117:327–35.
57. Siloto RM, Findlay K, Lopez-Villalobos A, Yeung EC, Nykiforuk CL, Moloney
MM. The accumulation of oleosins determines the size of seed oilbodies in
Arabidopsis. Plant Cell. 2006;18:1961–74.
58. Amara I, Odena A, Oliveira E, Moreno A, Masmoudi K, Pagès M, et al.
Insights into maize LEA proteins: from proteomics to functional approaches.
Plant Cell Physiol. 2012;53:312–29.
59. Battaglia M, Olvera-Carrillo Y, Garciarrubio A, Campos F, Covarrubias AA. The
enigmatic LEA proteins and other hydrophilins. Plant Physiol. 2008;148:6–24.
60. Rolletschek H, Koch K, Wobus U, Borisjuk L. Positional cues for the starch/
lipid balance in maize kernels and resource partitioning to the embryo.
Plant J. 2005;42:69–83.
61. Mittler R, Vanderauwera S, Gollery M, Van Breusegem F. Reactive oxygen
gene network of plants. Trends Plant Sci. 2004;9:490–8.
62. Foyer CH, Noctor G. Redox homeostasis and antioxidant signaling: a
metabolic interface between stress perception and physiological responses.
Plant Cell. 2005;17:1866–75.
63. Stacy RA, Nordeng TW, Culianez-Marcia FA, Aalen RB. The dormancy-related
peroxiredoxin antioxidant, PER1, is localized to the nucleus of barley
embryo and aleurone cells. Plant J. 1999;19:1–8.
64. Lee KO, Jang HH, Jung BG, Chi YH, Lee JY, Choi YO, et al. Rice 1Cysperoxiredoxin over-expressed in transgenic tobacco does not maintain
dormancy but enhances antioxidant activity. FEBS Lett. 2000;486:103–6.
65. Haslekås C, Viken MK, Grini PE, Nygaard V, Nordgard SH, Meza TJ, et al. Seed 1cysteine peroxiredoxin antioxidants are not involved in dormancy, but contribute
to inhibition of germination during stress. Plant Physiol. 2003;133:1148–57.
66. Kim SY, Paeng SK, Nawkar GM, Maibam P, Lee ES, Kim KS, et al. The 1-Cys
peroxiredoxin, a regulator of seed dormancy, functions as a molecular
chaperone under oxidative stress conditions. Plant Sci. 2011;181:119–24.
67. Klaassen CD, Liu J, Choudhuri S. Metallothionein: an intracellular protein to
protect against cadmium toxicity. Annu Rev Pharmacol. 1999;39:267–94.
Page 14 of 14
68. Guo WJ, Bundithya W, Goldsbrough PB. Characterization of the Arabidopsis
metallothionein gene family: tissue-specific expression and induction during
senescence and in response to copper. New Phytol. 2003;159:369–81.
69. Kawashima I, Kennedy TD, Chino M, Lane BG. Wheat Ec metallothionein
genes: like mammalian Zn2+ metallothionein genes are conspicuously
expressed during embryogenesis. Eur J Biochem. 1992;209:971–6.
70. Sheen J. Molecular mechanisms underlying the differential expression of
maize pyruvate, orthophosphate dikinase genes. Plant Cell. 1991;3:225–45.
71. Chastain CJ, Heck JW, Colquhoum TA, Voge DG, Gu XY. Post-translational
regulation of pyruvate orthophosphate dikinase in developing rice (Oryza
sativa) seeds. Planta. 2006;224:924–34.
72. Kang HG, Park S, Matsuoka M, An G. White-core endosperm floury
endosperm-4 in rice is generated by knockout mutations in the C-type
pyruvate orthophosphate dikinase gene (OsPPDKB). Plant J. 2005;42:901–11.
73. Xu SB, Yu HT, Yan LF, Wang T. Integrated proteomic and cytological study
of rice endosperms at the storage phase. J Proteome Res. 2010;9:4906–18.
74. Geigenberger P. Response of plant metabolism to too little oxygen. Curr
Opin Plant Biol. 2003;6:247–56.
75. Moons A, Valcke R, Van M. Low-oxygen stress and water deficit induce
cytosolic pyruvate orthophosphate dikinase (PPDK) expression in roots of
rice, a C3 plant. Plant J. 1998;15:89–98.
76. Chevalier D, Morris ER, Walker JC. 14-3-3 and FHA domains mediate
phosphoprotein interactions. Annu Rev Plant Biol. 2009;60:67–91.
77. Oecking C, Jaspert N. Plant 14-3-3 proteins catch up with their mammalian
orthologs. Curr Opin Plant Biol. 2009;12:760–5.
78. Alexander RD, Morris PC. A proteomic analysis of 14-3-3 binding proteins
from developing barley grains. Proteomics. 2006;6:1886–96.
79. Dou Y, Liu X, Yin Y, Han S, Lu Y, Liu Y, et al. Affinity chromatography
revealed insights into unique functionality of two 14-3-3 protein species in
developing maize kernels. J Proteomics. 2015;114:274–86.
80. Sehnke PC, Chung HJ, Wu K, Ferl RJ. Regulation of starch accumulation
by granule-associated plant 14-3-3 proteins. Proc Natl Acad Sci U S A.
2001;98:765–70.
81. Diaz C, Kusano M, Sulpice R, Araki M, Redestig H, Saito K, et al. Determining
novel functions of Arabidopsis 14-3-3 proteins in central metabolic processes.
BMC Syst Biol. 2011;5:192.
82. Zhang Z, Zhao H, Tang J, Li Z, Li Z, Chen D, et al. A proteomic study on
molecular mechanism of poor grain-filling of rice (Oryza sativa L.) inferior
spikelets. PloS One. 2014;9:e89140.
83. Liu YE, Liu P, Dong ST, Zhang JW. Hormonal changes caused by the xenia
effect during grain filling of normal corn and high-oil corn crosses. Crop Sci.
2010;50:215–21.
Submit your next manuscript to BioMed Central
and we will help you at every step:
• We accept pre-submission inquiries
• Our selector tool helps you to find the most relevant journal
• We provide round the clock customer support
• Convenient online submission
• Thorough peer review
• Inclusion in PubMed and all major indexing services
• Maximum visibility for your research
Submit your manuscript at
www.biomedcentral.com/submit