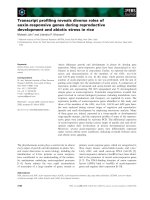
Cell wall dynamics during apple development and storage involves hemicellulose modifications and related expressed genes
Bạn đang xem bản rút gọn của tài liệu. Xem và tải ngay bản đầy đủ của tài liệu tại đây (1.03 MB, 20 trang )
Dheilly et al. BMC Plant Biology (2016) 16:201
DOI 10.1186/s12870-016-0887-0
RESEARCH ARTICLE
Open Access
Cell wall dynamics during apple
development and storage involves
hemicellulose modifications and related
expressed genes
Emmanuelle Dheilly1,2, Sophie Le Gall1, Marie-Charlotte Guillou2, Jean-Pierre Renou2, Estelle Bonnin1,
Mathilde Orsel2* and Marc Lahaye1*
Abstract
Background: Fruit quality depends on a series of biochemical events that modify appearance, flavour and texture
throughout fruit development and ripening. Cell wall polysaccharide remodelling largely contributes to the
elaboration of fleshy fruit texture. Although several genes and enzymes involved in cell wall polysaccharide
biosynthesis and modifications are known, their coordinated activity in these processes is yet to be discovered.
Results: Combined transcriptomic and biochemical analyses allowed the identification of putative enzymes and
related annotated members of gene families involved in cell wall polysaccharide composition and structural
changes during apple fruit growth and ripening. The early development genes were mainly related to cell wall
biosynthesis and degradation with a particular target on hemicelluloses. Fine structural evolutions of
galactoglucomannan were strongly correlated with mannan synthase, glucanase (GH9) and β-galactosidase gene
expression. In contrast, fewer genes related to pectin metabolism and cell expansion (expansin genes) were
observed in ripening fruit combined with expected changes in cell wall polysaccharide composition.
Conclusions: Hemicelluloses undergo major structural changes particularly during early fruit development. The
high number of early expressed β-galactosidase genes questions their function on galactosylated structures during
fruit development and storage. Their activity and cell wall substrate remains to be identified. Moreover, new
insights into the potential role of peroxidases and transporters, along with cell wall metabolism open the way to
further studies on concomitant mechanisms involved in cell wall assembly/disassembly during fruit development
and storage.
Keywords: Apple, Fruit development, Cell wall polysaccharides, Hemicelluloses, Transcriptomic analysis, Integrative
analysis
* Correspondence: ; marc.lahaye@
nantes.inra.fr
2
IRHS, INRA, AGROCAMPUS-Ouest, Université d’Angers, SFR 4207 QUASAV, 42
rue Georges Morel, 49071 Beaucouzé cedex, France
1
INRA UR 1268 Biopolymères, Interactions, Assemblages, F-44316 Nantes,
France
© 2016 The Author(s). Open Access This article is distributed under the terms of the Creative Commons Attribution 4.0
International License ( which permits unrestricted use, distribution, and
reproduction in any medium, provided you give appropriate credit to the original author(s) and the source, provide a link to
the Creative Commons license, and indicate if changes were made. The Creative Commons Public Domain Dedication waiver
( applies to the data made available in this article, unless otherwise stated.
Dheilly et al. BMC Plant Biology (2016) 16:201
Background
Apple (Malus domestica) fruit development involves a
series of biochemical events determinant for qualitative traits, such as appearance, flavour and texture
[1]. Fruit growth involves cell divisions and cell expansion resulting from a dynamic interplay between
cell turgor pressure, cell wall biosynthesis and remodelling [2]. Apple ripening involves starch conversion
to simple sugars, skin colour changes, ethylene production, a respiration burst and flesh softening [3].
Reduction in tissue firmness combines a decrease in
cell turgor pressure as well as cell wall polysaccharide
remodelling and metabolism [4–6].
Cell walls largely contribute to fruit textural characteristics. In apple, like other fleshy fruit, they are
made of pectin, hemicellulose and cellulose, together
with some structural proteins [6]. Apple cell wall
polysaccharide composition and structure varies with
genetics, developmental stages and growth conditions
[7, 8]. The relative content of the major cell wall
sugars represented by galacturonic acid attributed to
pectin, and glucose from cellulose and hemicelluloses
increase during apple ripening [9, 10]. Galactose and
arabinose content decreases during fruit expansion
and further declines during ripening [10–13]. This is due
in part to β-galactosidases and α-arabinofuranosidases
degradation of the galactan and arabinan side chains of
the pectic rhamnogalacturonan I (RGI) [6, 14, 15]. Methyl
ester substitutions of the homogalacturonan structural domain of pectins (HG) are partly removed by the action of
pectin methylesterases (PME) during apple development
[16, 17].
This metabolism of pectin increases cell wall porosity, decreases cell adhesion and affects fruit texture
[6, 18]. The loss of RGI galactan and arabinan side
chains was associated with softening [12], whereas
high content of galactan side chains was associated
with firmness [19]. A high arabinofuranosidase activity related to MdAF3 gene expression was reported in
mealy apples [15]. Pectin HG structure and its methyl
esterification are also important for apple texture.
Down regulation of the MdPG1 gene coding a polygalacturonase maintains fruit firmness during ripening
[20]. In contrast local action of PME (MdPME2) was
associated with mealiness development [21].
Unlike pectin, the overall apple hemicellulose composition and molecular weight are not significantly affected during fruit development and ripening [22].
However, their structure and interactions with cellulose are likely remodelled, as observed in the changes
of activities and gene expression levels of endo-1,4-βD-glucanase, xyloglucan endotransglycosylase/hydrolase (XTH) and expansin which are involved in cutting, cutting and pasting and breaking hydrogen
Page 2 of 20
bonds between xyloglucan and cellulose [14, 17,
23–27].
In addition to cell wall chemistry and macromolecular interactions, apple texture elaboration involves
other complex mechanisms related to tissue
organization [28–31] and cellular water partition
[8, 20, 29, 32].
As the whole fruit development is involved in texture elaboration [30], we investigated the parallel evolutions of cell wall chemical composition and
structure with that of cell wall related gene expression during fruit development and cold storage. The
transcriptomic analysis focused on genes annotated
for cell wall polysaccharide biosynthesis, remodelling
and degrading proteins as well as for structural proteins. Because turgor pressure is involved in fruit
development and texture, genes annotated for transporters were also analysed. Gene expression results
and correlation analyses between biochemical and
transcriptomic profiles highlighted new candidate
genes and provided new insights into possible coordinated activities involved in cell wall biosynthesis and
metabolism during apple development and storage.
Results
Cell wall characterization
The global sugar composition of cell wall prepared as
an alcohol insoluble material (AIM) was analysed at
each developmental and storage stage (Table 1). As
expected, apple fruits accumulated starch during the
developmental phases reaching 47.1 % of the AIM dry
weight at 110DAF. Starch content decreased at harvest and during the cold storage period. The cell wall
polysaccharides after deduction of starch glucose content in AIM sugars (non-starch polysaccharides, NSP)
were mainly glucose, uronic acids (UA), arabinose and
galactose in decreasing order of proportion. The total
amount of these 4 main sugars reached 85 to 88 % of
NSP depending on developmental and storage stages.
Galactose content decreased constantly from 18.7 to
7.2 % of NSP while uronic acids content increased
slightly from 22.4 to 29 % of NSP when fruits
reached late development stages. Smaller amounts of
xylose, mannose, and traces of rhamnose and fucose
were also detected. Xylose and fucose contents increased slightly at ripening stages while mannose contents decreased. Acetyl ester content also decreased
during the ripening stages from 1.5 % at 60DAF to
1.2 % of NSP at 2 M. In contrast, methyl ester content did not show any significant change.
Determination of hemicellulose fine structure
A structural profiling approach by enzymatic digestion
coupled with MALDI-TOF MS analysis of the
Dheilly et al. BMC Plant Biology (2016) 16:201
Table 1 Chemical composition of fruit cell wall
Sample
Starch
NSP
Sugar
Acetyl ester
Rha
*
Fuc
*
Ara
*
Xyl
Man
Gal
*
*
*
Glc
Methyl ester
DM
UA
*
*
60DAF
18.0
±2.7
69.2
±4.0
1.3
±0.1
0.8
±0.1
16.7
±1.6
4.8
±0.4
4.4
±0.4
18.7
±1.6
31.0
±5.4
22.4
±1.3
1.5
±0.1
2.8
±0.3
69.2
±17.5
110DAF
47.1
±2.2
51.5
±2.4
1.3
±0.1
0.8
±0.1
13.6
±1.3
5.2
±0.4
3.8
±0.3
17.2
±1.7
34.1
±5.6
23.9
±1.7
1.8
±0.3
3.1
±0.2
70.7
±10.4
H
13.4
±2.4
82.3
±3.3
1.4
±0.1
1.2
±0.1
14.6
±0.9
6.9
±0.4
3.3
±0.2
11.3
±0.8
35.3
±3.9
26.1
±1.7
1.4
±0.1
2.8
±0.4
59.4
±16.6
1M
3.8
±0.9
87.4
±1.9
1.3
±0.0
1.2
±0.0
14.7
±0.3
7.2
±0.2
3.3
±0.1
8.8
±0.7
35.7
±1.1
27.8
±0.7
1.3
±0.1
3.4
±0.1
67.0
±4.8
2M
1.3
±0.8
90.2
±1.8
1.2
±0.0
1.2
±0.0
14.9
±0.2
7.6
±0.2
3.1
±0.1
7.2
±0.4
35.8
±0.7
29.0
±0.7
1.2
±0.0
2.7
±0.2
52.2
±8.2
Analyses were carried out at 5 time points (60 and 110DAF, H: harvest, 1 M and 2 M: i.e.,1 and 2 months of cold storage). Starch and non-starch polysaccharides (NSP) are expressed as a percentage of AIM dry weight
(alcohol insoluble material). Sugars, acetyl and methyl ester contents are expressed as a percentage of NSP. DM: degree of methyesterification. *: significant differences between 60 DAF and 2 M with p < 0.0001
Page 3 of 20
Dheilly et al. BMC Plant Biology (2016) 16:201
Page 4 of 20
degradation products was used to follow modifications of hemicellulose fine structure. As apple
hemicelluloses include xyloglucan (XyG), galactoclucomannan (GgM) and glucuronoarabinoxylan (GAX)
[33–35], mannanase, xylanase and glucanase degradations were done sequentially. The order of the
enzymatic treatments was chosen to maximise oligosaccharides release.
To facilitate enzymatic treatments, AIM was first
washed with water (water soluble fraction, WS,
Table 2) and then partially depectinated by pectin
lyase and rhamnogalacturonase (pectinase-soluble
fraction, PS). Uronic acids (UA) and neutral sugars
(NS) contents were analysed after each treatment. In
the WS fraction, UA content increased continuously
from 0.5 % at 60DAF to 1.3 % of NSP at 2 M
(Table 2). In contrast, NS content decreased from
1.3 % at 60DAF to 0.9 % of NSP after 2 months of
cold storage (2 M). This decrease affected the mannose, galactose and glucose content, but not that of
arabinose, which was the major sugar of this fraction
(Table 3A). As expected, the subsequent pectinase
treatment (PS) had a drastic effect and removed 15.2
to 25.3 % of NSP depending on the fruit stages
(Table 2). The amount of NS content decreased from
20.4 to 10.9 % of NSP from 60DAF to 2 M (Table 2),
including the majority of the released rhamnose, arabinose, mannose and galactose (Table 3B). The
difference between 60DAF and 2 M was mainly due
to the decrease in galactose content in the PS fraction
(Table 3A). No significant change was observed in
UA content between 60DAF and 2 M (Table 2) but
the majority of UA was released with this treatment
(Table 3B).
Structure of mannose-containing polysaccharides
Endo-β-mannanase treatment on the remaining extracts allowed access to mannan-rich hemicelluloses.
The treatment released 2.8 to 3.3 % of NSP at 60DAF
and 110DAF and significantly less from harvest to
2 M with only 1.3%NSP (Table 2). No UA was detectable at early stages of development and only traces
afterwards (Table 2). At 60DAF, hydrolysis products
were mainly composed of glucose, arabinose, mannose
and galactose, each representing 0.3 to 0.4 % of NSP
(Table 3A) and respectively only 1.2, 1.8, 6.2 and
1.3 % of their respective initial content in NSP, as
most of them was already removed in the PS fraction
(Table 3B). The lower NS content of the mannanase
fraction at 2 M was mainly due to the decline of galactose and glucose content with only 0.1 % NSP
remaining for each.
Galactoglucomannan fine structures recovered in
the mannanase hydrolysates were assessed qualitatively by MALDI-TOF MS spectra analysis (Fig. 1a).
As expected, MS spectra showed a series of more or
Table 2 Soluble acidic and neutral sugars content released by sequential treatment of AIM
Treatment
WS
PS
Mannanase
Xylanase
Glucanase
60DAF
110DAF
H
1M
2M
Stat
NSP
1.8
±0.1
2.7
±0.2
2.2
±0.1
1.8
±0.2
2.2
±0.2
c
UA
0.5
±0.1
1.2
±0.1
0.9
±0.2
0.9
±0.1
1.3
±0.1
abc
NS
1.3
±0.2
1.4
±0.2
1.3
±0.2
0.9
±0.1
0.9
±0.2
bc
NSP
25.3
±0.6
27.3
±2.7
19.3
±1.2
16.4
±1.3
15.2
±0.9
abc
UA
5.0
±0.6
5.3
±1.1
4.9
±0.5
4.7
±0.5
4.3
±0.2
NS
20.4
±1.8
22.0
±6.2
14.4
±0.9
11.7
±1.3
10.9
±0.9
abc
NSP
2.8
±0.4
3.3
±0.4
1.6
±0.3
1.3
±0.1
1.3
±0.1
ac
UA
0.0
0.1
±0.1
0.1
±0.0
0.2
±0.0
ac
0.0
NS
2.8
±0.4
3.3
±0.4
1.5
±0.4
1.2
±0.1
1.1
±0.1
ac
NSP
1.0
±0.2
1.2
±0.4
0.9
±0.2
0.7
±0.1
0.5
±0.1
bc
UA
0.0
NS
1.0
±0.2
1.2
±0.4
0.9
±0.2
0.7
±0.1
0.5
±0.1
bc
NSP
13.9
±2.2
15.6
±4.2
15.9
±1.4
14.4
±1.9
13.9
±1.8
UA
0.0
0.2
±0.1
0.2
±0.1
0.2
±0.1
NS
13.9
15.7
±2.6
14.2
±2.3
13.7
±2.0
0.0
0.0
0.0
±2.2
15.6
±4.2
0.0
0.0
ac
Analyses were carried out by colorimetric analyses at 5 time points (60 and 110DAF, H: harvest, 1 M and 2 M: i.e.,1 and 2 months of cold storage) on samples
released after sequential treatments with water (water-soluble, WS), pectinases (pectinase-soluble, PS), mannanases, xylanase and finally glucanase. Non-starch
polysaccharides content (NSP) are expressed as a percentage of AIM dry weight, uronic acids (UA) and neutral sugars (NS) contents are expressed as a percentage
of initial NSP dry weight. a, b, c: significant differences between 60 DAF and H, H and 2 M, 60 DAF and 2 M with p < 0.0001
Dheilly et al. BMC Plant Biology (2016) 16:201
Page 5 of 20
Table 3 Neutral sugar composition of the fractions released by sequential treatment of AIM
Treatment
A
% NSP
B
NS
60DAF
2M
% initial sugar content in NSP
NS
Rha
Fuc
Ara
Xyl
Man
Gal
Glc
UA
Rha
Fuc
Ara
Xyl
Man
Gal
Glc
UA
WS
0.0
0.0
0.2
0.0
0.1
0.2
0.2
0.5
1.3
0.8
1.1
0.4
1.9
1.1
0.7
2.2
PS
0.2
0.0
1.9
0.1
1.0
2.1
1.1
5.0
15.2
2.1
11.2
1.1
22.7
11.2
3.7
22.3
Mannanase
0.0
0.0
0.3
0.0
0.3
0.3
0.4
0.0
2.6
0.0
1.8
0.9
6.2
1.3
1.2
0.0
Xylanase
0.0
0.0
0.2
0.0
0.0
0.1
0.1
0.0
1.3
0.0
1.0
0.9
0.1
0.6
0.3
0.0
Glucanase
0.1
0.2
0.4
0.6
0.3
0.3
5.1
0.0
5.7
18.4
2.1
13.1
7.5
1.8
16.4
0.0
WS
0.0
0.0
0.2
0.0
0.0
0.1
0.1
1.3
1.9
0.0
1.6
0.4
1.4
2.0
0.2
4.5
PS
0.3
0.0
2.3
0.1
0.9
0.6
0.2
4.3
21.1
1.5
15.3
1.4
27.8
8.8
0.5
14.8
Mannanase
0.0
0.0
0.2
0.1
0.2
0.1
0.1
0.2
2.0
1.4
1.1
0.8
5.4
1.2
0.3
0.7
Xylanase
0.1
0.0
0.9
0.5
0.0
0.3
0.2
0.0
5.4
0.0
6.2
6.0
0.0
3.6
0.6
0.0
Glucanase
0.1
0.2
0.4
1.0
0.3
0.5
5.7
0.2
9.1
19.8
2.7
12.9
8.2
6.6
15.8
0.7
Analyses were carried out at 2 time points (60DAF and 2 M: i.e., 2 months of cold storage) on samples released after sequential treatments with water (water-soluble,
WS), pectinases (pectinase-soluble, PS), mannanases, xylanase and finally glucanase. The neutral sugars (NS) were measured by GC and the uronic acids (UA) by
colorimetry. The results are expressed A) as percentage of initial NSP in the AIM dry weight (% NSP) and B) as a percentage of the initial amount of each sugar in the
NSP fraction of AIM. Numbers in bold are the maximum of released sugars among all treatments
Rha, rhamnose, Fuc, fucose, Ara, arabinose, Xyl, xylose, Man, mannose, Gal, galactose, Glc, glucose, UA, uronic acids
less acetyl-esterified hexo-oligosaccharides with degrees of polymerization from 4 to 8 attributed to
mannans/glucomannans/galactoglucomannans fragments.
Major fragments in the mean spectrum were attributed to Hex4a1 (4 hexose residues substituted by 1
acetyl group, see legend of Fig. 1 for nomenclature,
m/z 731), Hex4a2 (m/z 773), Hex5a1 (m/z 893)
Hex5a2 (m/z 935), and Hex6a1 (m/z 1055) oligomers.
An ion with mass corresponding to hexose and pentose containing structures, Hex3a1 and Pen4, respectively, was observed at mz 569 (Pen4: 4 pentose
residues). Minor structures identified were Hex4 (m/z
689), Hex5 (m/z 851), Hex5a2 (m/z 935), Hex7a1 (m/
z 1217), Hex7a2 (m/z 1259), Hex8a1 (m/z 1379) and
Hex8a2 (m/z 1421). The spectra also revealed the
presence of minor pento-oligosaccharides: Pen3U1 (3
pentose residues substituted by 1 uronic acid, m/z
613), Pen3U1a1 (m/z 655), Pen4a1 (m/z 611), Pen4a2
(m/z 653), Pen4U1m1 (m/z 759), Pen4U1m1a1 (m/z
801) and Pen5a1 (m/z 743) arising from the minor
contamination of the commercial mannanase by xylanase. Principal components analysis (PCA) of annotated oligosaccharides ion intensity was done to
provide a synthetic view of sample variations as well
as of the variables contributing to these variations.
This analysis revealed a clear change in fine structure
of mannose-containing hemicelluloses during fruit development particularly during the early phases (Fig. 1b, c).
PCA of MS spectra showed that the acetylated oligomers Hex7a1 and Hex8a1 differentiated the fruits at
60DAF.
Structure of xylose-containing polysaccharides
Treatment of the endo-β-mannanase residues by endo-βxylanase was performed to analyse xylose-containing hemicelluloses. This treatment released a small amount of neutral
sugars, only 1 % of NSP at 60DAF, which decreased during
cold storage to 0.5 % of NSP at 2 M (Table 2). No acidic
sugar was detected in this fraction (Table 2). Arabinose, galactose and glucose were the main neutral sugars detected at
60DAF with 0.1 to 0.2 % of the initial NSP (Table 3A).
After 2 months cold storage, more arabinose (0.9%NSP),
galactose (0.3%NSP) and glucose (0.2%NSP) were detected
(Table 3A). They represented 6.2, 3.6 and 0.6 % of their respective initial content in NSP (Table 3B). Rhamnose and
xylose contents increased in 2 M samples with respectively 0.1 and 0.5 % of the initial NSP, representing 5.4 and
6.0 % of their initial content in NSP. In contradiction with
the global NS measurements by colorimetry (Table 2), the
GC method showed an increase in neutral sugars released
by the treatment after 2 M when compared to 60DAF
(Table 3A). Due to the overall low amounts of the xylosecontaining oligosaccharides in the hydrolysis products
(Table 3B), xylanase hydrolysates were not further analysed.
Structure of glucose-containing polysaccharides
Endo-β-glucanase was applied on xylanase residues as
the last enzymatic treatment to access xyloglucan structures. The treatment solubilized from 13.9 %NSP at
60DAF to a maximum of 15.7 %NSP at harvest stage
and decreased to 13.9 % NSP at 2 M (Table 2). Only a
very small amount of UA (0.2 % NSP) was released from
the harvest stage and thereafter. As expected, the main
Dheilly et al. BMC Plant Biology (2016) 16:201
Page 6 of 20
Mannanase
Mean MS spectrum
a
Individual map
b
PCA
Variable map
c
Dim 1 (52.2%)
Glucanase
d
e
f
Dim 1 (64.3%)
Fig. 1 Mean MALDI-TOF MS spectra (a, d) and principal component analysis (b, c, e, f) of MS ions of annotated oligomers in the mannanase (a,
b, c) and glucanase (d, e, f) digests. 60 DAF: 60 days after flowering, 110 DAF: 110 days after flowering, H: harvest, 1 M: 1 month of cold storage,
2 M: 2 months of cold storage. Nomenclature of xyloglucan oligosaccharides followed that of [131, 133] extended to account for acetyl groups
noted a. In brief, it uses uppercase letters representing an individual 1 → 4 linked β -D-glucose residue and its pendant side chains. Accordingly,
bare glucose residue is designated by the letter G while when branched by α -D-xylosyl residue on O-6, it is refers to X. With further extension of
the branch by one β-D-galactosyl linked on xylose O-2, the trisaccharide structure formed is referred to L and when the latter is further extended
by one α-L-fucose residue linked at O-2 of galactose, the structure is then referred to F. Hexose containing oligosaccharides attributed to
galactoglucomannans were noted Hex. Pentose based oligosaccharides were noted Pen. These codes are extended by U, m and a when the
residues are substituted by an uronic acid, a methyl and and acetyl group, respectively. The number following the structure codes denoted the
number of building structures and substituent groups in the oligosaccharides (i.e., Hex3a2 corresponds to 3 hexoses and 2 acetyl groups;
Pen5U1m1a1 corresponds to 5 pentose, 1 uronic acid, 1 methyl and 1 acetyl groups)
soluble sugar was glucose with respectively 5.1 and 5.7 %
NSP at 60DAF and 2 M (Table 3A) and representing
16.4 % at 60 DAF and 15.8 % at 2 M of the initial content in NSP. With no remarkable differences between
60DAF and 2 M stages, smaller amounts of the other
sugars were also solubilized. Most of the released fucose,
glucose and xylose were found in the glucanase hydrolysis products (Table 3B).
In consistence with the high content of glucose in the
hydrolysates (Table 3), xyloglucan oligosaccharides
(XyGOs) were identified by MALDI-TOF MS analysis
(Fig. 1b). The mean spectrum revealed the presence of
major acetyl-esterified XyGOs: XXFGa1 (m/z 1435) and
XLFGa1 (m/z 1597) together with other structures attributed according to their respective mass to XXG (m/z 791),
XLG (m/z 953), GFG (m/z 967), XFG (m/z 1099), XLXG
(m/z 1247), XLXGa1 (m/z 1289), XXFG (m/z 1393),
XLGa1 (m/z 1451), XXFGa2 (m/z 1477) and XLFGa2 (m/
z 1639). Minor fragments were also detected as hexo or
pento-oligosaccharides and attributed to Hex4 (m/z 689),
Hex4a1 (m/z 731), Hex4a2 (m/z 773), Hex5 (m/z 851),
Hex5a1 (m/z 893), Hex5a2 (m/z 935), Hex6a1 (m/z 1055),
Hex7a1 (m/z 1217) and Hex8a1 (m/z 1379), Pen3U1 (m/z
613), Pen3U1a1 (m/z 655), Pen4a1 (m/z 611), Pen4U1m1
(m/z 759), Pen4U1m1a1 (m/z 801), Pen5a1 (m/z 743) and
Pen5U1m1a1 (m/z 933). These fragments reflected the
Dheilly et al. BMC Plant Biology (2016) 16:201
Page 7 of 20
activity of the commercial glucananase on glucomannan
as well as the presence of minor contaminating xylanolytic
activities. If no significant change in global NS composition was observed, a clear change of the oligosaccharide
fine structures occurred during fruit development, particularly between the early developmental phases (60DAF
and 110DAF) and the matures stages (H, 1 M and 2 M).
While most of the XyGOs oligomers, and particularly
XXG, GFG, XLXG, XXFGa2, XLFGa2, were representative of mature stages, the hexo and pento-polysaccharides
distinguished the spectra of fruits in early development.
Particularly, Hex6a1, Hex5a1, Hex7a1, Hex4a1, Hex4a2,
Hex5a2, Pen5U1m1a1, Hex8a1, Hex4, Pen4U1m1a1,
Hex5, Pen4U1m1 and Pen3U1a1 were representative of
the early stages (Fig. 1b).
Transcriptome profiling
In order to identify genes potentially involved in the structural modifications of cell wall polysaccharides, transcriptome analyses were performed on the same samples used
for cell wall biochemical analyses. Transcriptomic profiling
performed with the AryANE_v1 microarray revealed that
42 % of the tested transcripts were expressed at one or
more developmental stages for at least one of the 8 genotypes analysed. Differentially expressed transcripts between
subsequent developmental stages were identified with significant P-values for t-tests (P-value <0.01; Fig. 2). The
highest numbers of differentially expressed transcripts were
observed between 110DAF and harvest, and harvest and
1 M storage. To study the changes between apple development and fruit ripening, the transcriptome at 60DAF was
compared with the transcriptome at 2 M. A total of 23,001
differentially expressed transcripts were identified. Subsequent hierarchical clustering analysis on expression profiles
led to the selection of 5150 transcripts displaying similar
expression profiles for the 8 genotypes grown in both orchards when considering the 16 time series (Additional file
1). Microarray data were validated by RT-qPCR experiments on a subset of differentially expressed genes, using
cDNA from 60DAF and 2 M apple fruits. A similar difference between gene expression levels was observed with
both techniques (Pearson correlation = 0.82, P-value < 0.01)
(Additional file 2).
In AryANE_v1 microarray, sense (S) and antisense (AS)
probes were designed for each annotated apple coding
DNA sequence (CDS), and 26 % of the differentially
expressed probes corresponded to AS transcripts. Celton
et al. [36] demonstrated that these AS transcripts were
likely to be involved in small interfering RNA (siRNA)
dependent negative regulation of the coding mRNAs. This
study only considered genes with differentially expressed
sense transcripts.
Sense transcripts with higher expression during early
fruit development (60DAF and 110DAF: cluster A) or during fruit ripening and cold storage (harvest, 1 M, 2 M: cluster B) were selected for further analyses, and represented
Number of differentially expressed transcripts
30000
20000
10000
0
110 DAF/
60 DAF
H/
110DAF
1M/
H
2M/
1M
Fig. 2 Differentially expressed transcripts during kinetic of apple development and ripening. Graph represents the number of significant
differentially expressed transcripts between 2 time points. Transcripts are down-regulated or up-regulated, respectively in dark and in light grey,
in comparison with the earlier stage of development. 60 DAF: 60 days after flowering, 110 DAF: 110 days after flowering, H: harvest, 1 M: 1 month
of cold storage, 2 M: 2 months of cold storage
Dheilly et al. BMC Plant Biology (2016) 16:201
respectively 6.2 and 10.5 % of the selected differentially
expressed transcripts. Based on genes annotations, they
were classified into functional categories. 0.5 % had annotations related to cell wall biosynthesis and/or remodelling,
or solutes flux changes (Additional file 3). In order to refine
the selection, deduced protein sequence from these genes
were analysed for subcellular targeting and protein domain
annotation. The potential cellular locations of 96.5 % of the
proteins corresponding to these genes were analysed with
the ProtAnnDB tool [37] (Additional file 3). In concordance with a function on cell wall modifications, 66 proteins
with a signal peptide for endoplasmic reticulum (ER) targeting were potential candidates to be exported to the apoplast. For 21 predicted transporters, 2 had surprisingly no
predicted transmembrane domain. 5 of the 6 peroxidases
had a predicted signal peptide for ER targeting and 4 were
predicted to belong to Class III peroxidase superfamily
when analysed through the PeroxiBase tool. Among the
enzymes and proteins related to cell wall modification,
15 % could not be allocated to a coherent subcellular compartment. This was probably due to the prediction models
used and/or to potentially truncated protein sequences
which were deduced from the apple genome sequence and
annotation [38]. In addition, some annotations were different between ProtAnnDB and CAZy databases. For
example, several proteins were identified as pectin lyaselike with ProtAnnDB, but were grouped as glycoside hydrolases 28 (GH28) (MDP0000147794; MDP0000175027;
MDP0000251956; MDP0000270685; MDP0000665344;
MDP0000818931 and MDP0000249285) or carbohydrate
esterases 8 (CE8) (MDP0000177299; MDP0000212502;
MDP0000251256; MDP0000252508; MDP0000287234) in
CAZy database. Such discordances probably resulted from
the markedly different methods and criteria used for protein annotation.
A total of 114 cell wall related genes were selected,
82 % were expressed during the early developmental
phases and the remaining 18 % were expressed during
later developmental stages and storage. According to
their expression pattern, early expressed genes were
grouped in cluster A while the later expressed genes
were in cluster B (Table 4; Additional file 3). Cell wall
genes from cluster A included mainly genes potentially
involved in pectin and cellulose/hemicellulose metabolism, respectively 20 and 26 genes. Several genes potentially coding expansins, galactosyltransferases,
glycoproteins and many β-galactosidases were also
identified in this cluster, as well as peroxidases and
transporters. In contrast, few cell wall related genes
were identified in cluster B. Those identified were
mainly involved in pectin degradation, and very few
genes were involved in cellulose/hemicelluloses metabolism including genes coding expansins (Table 4;
Additional file 3).
Page 8 of 20
Integrative analysis
Gene expression networks were realized within each
cluster (Additional file 4). Gene correlation in cluster A
yielded one large network composed of 70 genes (r >
0.7). A subset of genes in the network showed strong
correlations (P < 0.05, r > 0.9) and was centred on a gene
annotated for a glycoside hydrolase belonging to family
9 (GH9) grouping mainly glucanases (MDP0000131397).
This subset was composed of GH9, β-glucosidase
(MDP0000140817), β-galactosidase (MDP0000899966),
XTH (MDP0000378203), FLA (MDP0000525641), AGP
(MDP0000893240), peroxidase (MDP0000221335) and
sugar transporter (MDP0000318992). Another subset containing CSLA (MDP0000717000), FLA (MDP0000658332)
and β-galactosidase (MDP0000310582) also significantly
correlated (P < 0.05, r > 0.9). Two small correlation networks were drawn for genes in cluster B (Additional
file 4). Two gene networks showed significant correlations (P < 0.05, r > 0.7). One showed correlations
between genes encoding pectin-degrading enzymes
such as PG and pectin esterases (MDP0000249285;
MDP0000251256; MDP0000252508; MDP0000287234)
and genes encoding transporters (MDP0000216376;
MDP000219430; MDP0000266249; MDP0000403872).
The other network showed strong correlations (P <
0.05, r > 0.8) between genes encoding expansin like A
(MDP0000906812), expansin like B (MDP0000214811;
MDP0000292477), β-galactosidase (MDP0000416548)
and peroxidase (MDP0000142485).
Transcriptomic profiles were tentatively correlated with
the cell wall monosaccharides contents and the oligosaccharides enzymatically released from hemicelluloses in
order to reveal concomitant events (Additional file 5).
Total monosaccharide contents in AIM (as %NSP) were
considered, except for arabinose and rhamnose whose
content did not change (Table 1). Oligosaccharides relative
contents in glucanase digests were also considered as
markers of hemicellulose structural changes (Fig. 1b).
Glucose and uronic acids contents were the least correlated with the selected gene expression levels. Expression
profiles of cluster A genes expressed during early developmental stages were positively correlated with galactose
and mannose contents, as well as oligosaccharides content
attributed to mannans (Hex4a1, Hex4a2, Hex5a1, Hex5a2,
Hex6a1, Hex7a1 and Hex8a1) and xylans (Pen5U1m1a1,
Pen4U1m1 and Pen4U1m1a1). They were also negatively
correlated with fucose and xylose content as well as with
oligosaccharides attributed to xyloglucans (XXG, XLG,
GFG, XFG, XLXG, XXFG, XXFGa2, XLFGa2). The opposite correlations were observed with expression profiles
from genes belonging to cluster B, showing higher expression at mature stages.
Strong correlations were observed between expression
profiles of β-galactosidases and galactose content (Fig. 3a),
Dheilly et al. BMC Plant Biology (2016) 16:201
Page 9 of 20
Table 4 Molecular and biochemical function of selected genes potentially involved in cell wall dynamic
Molecular function
Pectin biosynthesis
Pectin degradation
Cellulose/
Hemicelluloses
biosynthesis
Biochemical annotation
Gene_id
Cluster A
Cluster B
Galacturonosyltransferase (GAUT)
MDP0000179747
MDP0000609623
Galacturonosyltransferase-like
(GATL)
MDP0000124674, MDP0000518347, MDP0000678218,
MDP0000794936, MDP0000856834, MDP0000370712
Glycoside hydrolase family 79
(GH79)
MDP0000199066
Pectate lyase
MDP0000266603, MDP0000277149, MDP0000319156,
MDP0000631698, MDP0000232225, MDP0000394944,
MDP0000693765, MDP0000818931
Pectin acetylesterase
MDP0000193151, MDP0000834641
Pectin esterase
MDP0000177299, MDP0000212502
MDP0000251256,
MDP0000252508,
MDP0000287234
Pectin methylesterase inhibitor
MDP0000250584
MDP0000836165
Polygalacturonase (PG)
MDP0000147794, MDP0000175027, MDP0000251956, MDP0000249285
MDP0000665344, MDP0000270685
UDP-xylosyltransferase
MDP0000197595
Cellulose synthase
MDP0000185368, MDP0000322053
Cellulose synthase-like A (CSLA)
MDP0000263736, MDP0000133719, MDP0000717000,
MDP0000131947, MDP0000659120, MDP0000673496
Cellulose synthase-like E (CSLE)
Cellulose/
Hemicelluloses
degradation
MDP0000196876
α-arabinofuranosidase/α-xylosidase MDP0000208161
α-L-fucosidase
MDP0000166406
β -glucosidase
MDP0000140817
MDP0000543167
Glycoside hydrolase family 1 (GH1) MDP0000217844, MDP0000147765
Glycoproteins
Glycosyl hydrolase family 9 (GH9)
MDP0000147635, MDP0000131397, MDP0000561662
Xyloglucan endotransglycosylase/
hydrolase (XTH)
MDP0000180043, MDP0000132431, MDP0000378203
Arabinogalactan protein (AGP)
MDP0000221961, MDP0000893240
Fasciclin-like arabinogalactanprotein (FLA)
MDP0000525641, MDP0000658332
Hydroxyproline-rich glycoprotein
family protein (HRGP)
MDP0000144792, MDP0000697140, MDP0000849284
Wall associated kinase (WAK)
MDP0000630155
Wall associated kinase-like (WAKL)
Expansins
MDP0000278145,
MDP0000426154
Expansin A (EXPA)
MDP0000259640, MDP0000785413, MDP0000257797
Expansin-like A (EXLA)
MDP0000568045
Expansin-like B (EXLB)
MDP0000906812
MDP0000214811,
MDP0000292477
Galactosyltransferases
Galactosyltransferase
MDP0000198402, MDP0000237443
β-galactosidases
β-galactosidases
MDP0000030527, MDP0000195063, MDP0000201058, MDP0000127542,
MDP0000227393, MDP0000310582, MDP0000899966, MDP0000416548,
MDP0000151981, MDP0000265046, MDP0000271897, MDP0000944874
MDP0000895533, MDP0000682327
Peroxidases
Peroxidase
MDP0000272643, MDP0000678562, MDP0000488361, MDP0000142485
MDP0000221335, MDP0000122663
Transport
H(+)-ATPase
MDP0000810883
Anion transporter
MDP0000142911, MDP0000877937
K+ transporter
MDP0000414314, MDP0000800190, MDP0000889811, MDP0000403872
MDP0000170687, MDP0000853168, MDP0000778372
Dheilly et al. BMC Plant Biology (2016) 16:201
Page 10 of 20
Table 4 Molecular and biochemical function of selected genes potentially involved in cell wall dynamic (Continued)
Cation transporter
MDP0000470237
Zinc transporter
MDP0000320480
Monosaccharide transporter
MDP0000485591
Hexose transporter
MDP0000216376,
MDP0000219430
Polyol transporter
MDP0000239167, MDP0000251579, MDP0000841918
Sugar transporter
MDP0000219048, MDP0000318992
MDP0000266249
Genes were annotated according to their similarity with Arabidospis genes (TAIR) and Mapman classification. Their deduced protein sequences where also search
in ProtAnnDB, CAZy and Peroxibase databases
between expression profiles of expansins and the structure
XXG of xyloglucans (Fig. 3b), between expression profiles
of cellulose synthase like-A and glycoside hydrolase family
9 and the structure Hex6a1 of mannans during apple development and ripening (Fig. 3c and d, respectively).
Discussion
Modifications in the chemical composition of apple cell
wall polysaccharides during fruit development and ripening have already been described [6, 9, 10, 22, 30] as
well as enzymes and genes expression involved in ripening [14, 16, 17, 23, 26, 27, 39, 40]. However a more detailed view of genes potentially involved in cell wall
polysaccharide chemical composition, structure, water
flux during apple development and storage provides insights into the mechanisms affecting texture characteristics and highlights novel candidate genes involved in
these processes.
A dual approach to characterize apple cell wall dynamic
Biochemical cell wall analyses were done to assess the
changes in polysaccharide composition and particularly
that of hemicelluloses fine structure during apple fruit
development. For the latter analyses, pectin was partially
removed by water washes and pectinolytic enzymes as it
was reported to mask hemicelluloses [41]. Our results
showed that compared with previous studies of XGos
profiles (Fig. 1), pectin in apple parenchyma cell wall did
not have a major impact on hemicellulose accessibility
to enzymes [7, 33, 42]. Furthermore, the changes observed by MALDI-TOF MS in the relative proportion of
GgM oligomers in the glucanase hydrolysate, followed
the decrease in mannose content in the cell wall of the
fruit in development. Although these observations
pointed to some degree of representativeness of the cell
wall hemicelluloses enzymatic profiling, the hydrolyzates
composition likely reflected readily accessible structures
and not those in strong interaction. Additionally, the endogenous modifications of polysaccharides structure and
access during fruit development possibly affected the enzymatic hydrolyzates composition.
Transcriptomic analysis provided access to genes encoding specific proteins and enzymes related to cell wall
construction and remodelling during apple development,
ripening and cold storage. Genes were selected according to their annotations from different databases but
their respective biochemical activities remain to be characterized. Genome-wide expression analysis of apple
fruit development has already revealed the coordination
between gene expressions with specific fruit developmental stages from floral bud to ripe fruit [1, 43, 44].
Genes expressed during early fruit development are
mainly involved in cell proliferation and expansion [43,
44]. Recently, this approach revealed that the down
regulation of MdPME2, an early-expressed pectin
methylesterase-coding gene during fruit development
was linked to the apparition of mealiness, during fruit
cold storage [21]. Several other functional categories
have also been reported, such as solute transport and
cell wall metabolism [45].
The present analysis confirmed that the number of transcripts detected was similar from early apple development
to harvest stage and that it was not affected up to
2 months after cold storage [36]. However, remarkably
more cell wall-related genes were specific to early developmental stages than to ripening and storage phases. This
could be explained by the fact that analyses were carried
out on distinct genotypes with different fruit texture evolution after harvest (Additional file 6). This difference in
gene expression profiles highlights the plasticity of the
genome with different expression time-frames and/or
other genetic/environmental factors affecting markedly
metabolic pathways during the ripening process. Indeed,
variations in transcript profiles already observed between
different apple genotypes support a genetic dependent
regulation of fruit growth and ripening [43, 46].
Pectin modification during fruit development and cold
storage
During early apple development, genes involved in pectin
metabolism were co-expressed with genes involved in
hemicellulose metabolism and their remodelling by XTH
(Table 4, Additional files 3 and 4). Concomitant expression
Dheilly et al. BMC Plant Biology (2016) 16:201
Page 11 of 20
8
2
6
1
4
0
1M
10
5
4
8
3
6
2
4
1
2
0
0
-1
1M
4
6
3
5
4
2
3
1
2
0
1
MDP0000257797_r
MDP0000259640_r
MDP0000568045_r
MDP0000785413_r
MDP0000214811_r
MDP0000292477_r
MDP0000906812_r
-1
0
60 DAF 110 DAF
H
1M
2M
d
6
H
MDP0000127542_r
2M
12
60 DAF 110 DAF
MDP0000416548_r
7
XXG
Hex6a1
MDP0000133719_r
MDP0000263736_r
MDP0000659120_r
MDP0000673496_r
MDP0000717000_r
2M
12
6
10
5
4
8
3
6
2
4
1
2
0
0
Hex6a1
MDP0000131397_r
MDP0000147635_r
MDP0000561662_r
Cluster A
Relative content of oligoasaccharides
c
H
MDP0000899966_r
Cluster A
60 DAF 110 DAF
MDP0000895533_r
MDP0000944874_r
-1
0
MDP0000682327_r
5
8
Expression value – log2
2
MDP0000310582_r
9
Cluster A
3
10
Expression value – log2
% PSN
12
MDP0000195063_r
6
10
Cluster B
4
14
MDP0000030527_r
Cluster A
16
Cluster B
5
Expression value - log2
Galactose
18
Expression value – log2
6
Relative content of oligosaccharides
20
Relative content of oligosaccharides
b
a
-1
60 DAF110 DAF H
1M
2M
Fig. 3 Expression level of genes correlated with monosaccharide content or oligosaccharides relative content MS from glucanase digest during
apple development and ripening: a β-galactosidases and galactose content, b expansins and XXG, c cellulose synthases like A and Hex6a1, d
glycoside hydrolases family 9 (glucanase) and Hex6a1. Green bold lines correspond to genes expressed during early apple development and red
bold lines correspond to genes expressed during apple ripening. 60 DAF: 60 days after flowering, 110 DAF: 110 days after flowering, H: harvest,
1 M: 1 month of cold storage, 2 M: 2 months of cold storage
of genes involved in biosynthetic and degradation functions
is in line with observations that hydrolytic mechanisms are
required to achieve a proper cell wall polysaccharide synthesis and organ development [47–49].
Changes in cell wall composition were observed as expected during fruit development and ripening, such as a
decrease in galactose content [10, 11, 30, 50]. The increase in xylose, fucose and uronic acids likely resulted
from both the cell wall enrichment in XyG and pectin
depletion in neutral side-chains. The presence of uronic
acids in the water washes of apple AIM at the ripening
stage supports the hypothesis that HG depolymerization
by PG contributes to the decrease of fruit firmness [14,
20, 51]. The removal of methyl esters facilitates PG action [3, 52] but also favours cell adhesion and the rigidity
of pectin network [53]. In peach and tomato, pectin
methyl-esterification decreased during development and
ripening concomitantly with the increased activity of
PME [52, 54, 55]. In apple, PME activity was reported to
decrease during ripening [14, 17]. In this study, 2 pectin
esterases coding gene (MDP0000177299, MDP0000
212502) showed a decreased expression during apple development and ripening. However, as previously reported [10, 19, 21], no global significant variation was
observed in methyl ester content of pectin during apple
ripening. It was suggested that these enzymes could have
a very local activity, at tricellular junctions, whose effect
could not be evaluated at the whole fruit level [21].
Acetyl-esterification is also a common feature of apple
pectin [56] and may be the target for the ill-defined
function of these esterases. The latter may contribute to
the significant decrease in the global cell wall acetyl esterification observed between 110 DAF and 2 M.
The specific expression of a GAUT coding gene
(MDP0000609623) was also noticed during the ripening
phases, as well as a significant increase of UA content.
This suggests that new pectin could be incorporated into
cell wall even after the developmental stages. This is in
accordance with the observation that early ripening tomato has still cell wall synthetic capacities while being
disassembled [57, 58].
Hemicellulose changes during fruit development and cold
storage ripening
The semi-quantitative variations of hemicellulose structural domains observed during fruit development (Fig. 1)
were in accordance with observations made on other
plant organs or fruits [59, 60]. This variation suggests
different roles for different XyG fine structures in relation
with cell wall expansion and extensibility mechanical
Dheilly et al. BMC Plant Biology (2016) 16:201
properties by yet unclear mechanisms [61]. In several fruits,
including apple, distinct xyloglucan transglycosylase/hydrolases (XTH)-coding genes are expressed in young and
mature fruits and are likely to contribute to XyG structure
[23, 62, 63]. Particularly found expressed in the early development phases in this study, XTH gene expression was
highly and positively correlated (P-value < 0.01) with the
expression of glycoside hydrolase GH9 (MDP0000131397),
β-glucosidase (MDP0000140817), β-galactosidase (MDP0
000899966), glycoproteins (FLA: MDP0000525641, AGP:
MDP0000893240), peroxidase (MDP0000221335) and
sugar transporter (MDP0000318992) (Additional file 4). It
points out the key role of XyG in the cell wall dynamic together with other cell wall events including remodelling of
cell wall polysaccharides by hydrolases, oxidative reactions
and likely cell turgor regulation. Indeed, xyloglucans have
been shown to be involved in cell wall mechanics, acting
on the stability of microtubule cytoskeleton and the
cellulose microfibrils biosynthesis and organization
[64]. The concomitant expression of FLA genes
(MDP0000525641, MDP0000658332) with XyG remodelling suggests that the proposed cell adhesion
and plant mechanical implications of FLA proteins
[65, 66] associate specific xyloglucan structures. Genes
potentially coding a dual α-L-arabinofuranosidase/α
-xylosidase (MDP0000208161) and α-L-fucosidase
(MDP0000166406) were also highly expressed during
early apple development. These genes should be further characterized as they may be involved in developmental regulation of XyG structure [67]. In addition,
the xylosidase/arabinofuranosidase may also be implied in the remodelling of arabinan side chains of
pectin, glucuronoarabinoxylan and/or AGP structures.
The present study revealed that galactoglucomannan
(GgM), a minor component of apple hemicellulose,
undergoes fine structural changes during early fruit development. It co-occurred with the high expression of
one CSLA gene (MDP0000673496) (Additional file 5),
whose Arabidopsis homolog was shown to encode mannan synthase [68] and has a potential key role on cell expansion [69]. In particular, this CSLA gene expression
was positively correlated with the detection of the
Hex6a1 structure in glucanase digest (Fig. 3c) and with
the expression of the glycoside hydrolase GH9 gene
(MDP0000131397) (Fig. 3d). The strong correlation of
one CSLA (MDP0000717000) gene expression with the
β-galactosidase expression profile (MDP0000310582) (Pvalue < 0.01) (Additional file 4) suggests that βgalactosidases may also be involved in the control of
GgM synthesis and deposition in the wall. The function
of GgM in primary walls remains unclear. Their potential interactions with cellulose [70] make them a candidate to control microfibrils aggregation and thus cell
wall expansion [61]. This is consistent with the
Page 12 of 20
existence, at least in tomato, of mannan-degrading enzymes with transglycosylase activity (MTH) similar to
XTH activity [71].
The large amount of mannose and glucose released by
the combined action of pectin lyase and rhamnogalacturonase (PS; Table 3B) suggests that GgM could be associated with pectin. Such an association would also be
affected by ripening as the amount of glucose decreased
in 2 M samples when compared with 60DAF. The specific timing of GgM biosynthesis in early fruit development and metabolism as fruit enlarges points to a
specific role most likely during and/or just after cell division with an implication in cell-cell adhesion as in tomato [72] and/or in the first rapid firmness decline
observed during early fruit development [73].
Xylanase profiling did not show fine structural modifications of the minor glucuronoarabinoxylan (GAX) content
in apple. This was likely due to the partial hydrolysis of the
GAX by the xylanase contaminating the mannanase used
in the previous hydrolysis step but also probably due to hindrance of the binding/active sites by xylan substitutions. Indeed, the xylanase activity contained in the following
glucanase was able to release some more xylan oligomers.
Overall, the mannanase- and glucanase-released xylooligomers revealed that GAX was particularly present at
60DAF and 110DAF, with different fine structures. There is
no information on fine structure modifications of xylanbased polysaccharides in other fruits. As for GgM, the function of GAX in apple remains to be established. In Arabidopsis, xylan can be linked to pectin through AGP [74] and
in tomato glucuronoxylan (GUX) are partly linked to GgM
[75]. The identification of arabinose, galactose and rhamnose in the products of mannanase and xylanase hydrolysis
supports the proposed connections between GAX and the
AGP/pectin RGI complex. As with XTH and MTH, xylanase with hydrolase but also transglycosylase activity exists
in fruit [76], opening the way for xylan remodelling mechanisms. Since tomato GUX were located in cell wall lining
the intercellular spaces [72], it would be of interest to
search for apple GAX in a similar location and test their involvement in the formation of large intercellular spaces in
fruit flesh during cell expansion.
Expansins are also important proteins for loosening
XyG-cellulose interactions during cell expansion [77, 78].
They have been found in developing fruit, such as tomato
[79], pear [80], strawberry [81] and apple [82]. Our results
showed that 4 expansin (EXPA) or expansin-like (EXLA)
genes (MDP0000257797, MDP0000259640, MDP0000
785413, and MDP0000568045) were specifically more
expressed during early fruit development (Table 4;
Additional file 3). Their deduced protein sequence had
various level of similarity with expansin domains from
others fleshy fruit [79–81, 83] (Additional file 7). In contrast, the protein sequence from the 3 expansin-like genes
Dheilly et al. BMC Plant Biology (2016) 16:201
Page 13 of 20
(EXL) (MDP0000214811, MDP0000292477, MDP0000
906812) identified during fruit ripening was very different,
suggesting different biochemical characteristics and biological functions (Additional file 7). Their gene expression
profiles were correlated with oligosaccharides XXG relative content (Fig. 3b; Additional file 5), suggesting a target
preference for this fine structure, or their involvement in
cell wall integration of new XXG structures. Expansin
genes (MDP0000214811; MDP0000292477; MDP000
0906812) expression was also correlated with that of one
β-galactosidase (MDP0000416548). This observation suggests that galactosylation of XyG structure may be involved in the recognition of XyG/cellulose complex by
expansin.
similar to the ripening specific pear proteins PpGAL4
and PpGAL1, respectively (Additional file 7), which suggests that they may play similar roles in apple and pear
ripening [40, 94, 95] in pruning of RGI galactan side
chains [12, 96]. Ripening-specific β-galactosidase gene
expression has also been reported in tomato [97] and
down-regulation of one of them, TBG4, resulted in reduced fruit softening [98].
These results emphasize the complexity of the βgalactosidase family which merits further studies to assess if it could be split into two groups, one principally
acting on the regulation of cell wall polysaccharides and
glycoproteins galactosylation, and another one mainly
pruning pectin RGI side chains.
Two groups of β-galactosidases
Potential others actors in cell wall dynamics
β-galactosidases are common highly active enzymes during apple development and particularly during the ripening stage [6, 19, 25, 39, 40]. In the present study, 11
genes coding β-galactosidases were expressed during
early apple development and had glycoside hydrolase 35
domain (GH35). They are similar to those identified in
tomato and Japanese pear, but different from the Arabidopsis AtBGAL10 acting on xyloglucans [84] (Additional
file 7). In particular, 7 of these apple β-galactosidases
were very similar to PpGAL5, PpGAL6, and PpGAL7
whose expression was at their highest in expanding fruit
but decreased drastically upon the onset of ripening
[85]. These enzymes can potentially target several cell
wall structures, such as AGP, pectic RGI galactan sidechains, xyloglucan or galactoglucomannans. The positive
correlation of the 11 apple β-galactosidases expression
pattern with galactose content (Fig. 3a, Additional file 5)
suggests that RGI galactan side chains hydrolysis might
not be their target unless these enzymes act also as
transglycosylases as suggested by Franková and Fry [86].
In such a case, these enzymes would have more complex
functions in the remodelling of cell wall polysaccharides.
They might control pectin and hemicellulose polysaccharides interactions with cellulose through the modulation of their side chains structure [87–89], or regulate
remodelling enzymes such as XTH/XET by modifying
XyG galactosylation [90–92]. In any case, these glycosidases appear central in the remodelling of cell wall along
with cell expansion.
Three other β-galactosidase genes were observed preferentially expressed during apple ripening (Fig. 3a).
These β-galactosidases gene expression profiles were
weakly and negatively correlated with galactose content
(Additional file 5). Two of them (MD0000416548 and
MD0000127542) corresponded to the up regulated βgalactosidase genes (Mdβ-GAL1 and Mdβ-GAL2) during
apple storage in controlled or regular atmosphere at
1 °C [93]. Protein analysis showed that they were highly
Peroxidases participate in a range of physiological processes [99], such as cell wall degradation by cleaving
polysaccharides bonds through the generation of reactive
oxygen species (ROS) [100–104]. Genes encoding peroxidases were found mostly expressed during early apple
development. Some of them had expression profiles correlated with those from proteins and enzymes involved
in biosynthesis, remodelling and degradation of cell wall
polysaccharides. These results support a role for these
enzymes in cell development as reported for Arabidospis
cell root elongation [105] but their mechanism of action
remains unclear. Indeed, beside polysaccharide degradation, certain ROS can inversely contribute to cell wall
cross-linking and therefore limiting cell expansion [106].
Results from this study suggest that the regulation of
apoplastic ROS production is important for cell wall biosynthesis and modifications during apple development.
During fruit growth and ripening, changes of internal turgor pressure lead to modifications of tissue mechanical
properties [4, 8, 107]. Transporters have a major role in the
regulation of turgor pressure by acting on apoplastic/cell
solutes concentration and pH that affect osmotic pressure
[2, 108, 109]. As previously reported [43, 44], genes encoding ions and sugar transporters were found highly
expressed during early developmental phases (Table 4;
Additional file 3). Their expression was highly correlated
with genes involved in polysaccharides biosynthesis and
degradation. Four genes encoding ion and sugar channels/
transporters were preferentially expressed during apple ripening (Table 4; Additional file 3) and correlated with genes
related to pectin degradation (Additional file 4). These early
and late expressed transporter genes require further studies
with regard to their implication in the regulation of turgor
pressure during fruit expansion and ripening. During ripening, apple softening is known to involve a decrease in cell
turgor pressure [8]. It would be of interest to assess the role
of the hexose/sugar transporter genes expressed during late
phases on the fate of the phloem downloaded sugars in the
Dheilly et al. BMC Plant Biology (2016) 16:201
apoplast [110] with regard to the change in water
compartmentalization observed in ripening apples [29].
Regulation of osmolytes concentration in ripening apples
may contribute to changes in cell turgor pressure and loss
of fruit firmness as proposed for grape berries [111]. This
mechanism concomitant with cell wall polysaccharide remodelling and degradation may also participate in the elaboration of different apple textures, such as those perceived
as mealiness and meltiness.
Conclusion
In addition to known cell wall pectin changes during
apple fruit development and cold storage, this study revealed changes in hemicellulose fine structure particularly during early fruit development. The associated
characterization of the transcriptome highlighted genes
potentially involved in hemicellulose metabolism and the
changes observed. At the ripening stage, the low number
of genes identified was more specific of pectin metabolism. This study also pointed to β-galactosidases whose
roles during fruit growth and ripening remain to be
characterized in regard to the targeted substrates and
molecular function. Correlations observed between expression profiles from ion and sugar transporters, peroxidases and cell wall-related genes open the way to
further studies on the interplay between cell wall assembly/disassembly mechanisms and cell turgor regulation
during fruit development.
Materials and methods
Plant material
Eight hybrids (H074, H097, I016, I062, I095, V034, V083
and W029) from the ‘HIVW’ segregate population resulting from the cross between X3259 and X3263 done in our
laboratory at INRA Angers [112, 113] were grown on 2
experimental plots (PH and P12) connected to the INRA
laboratory at Bois l’Abbé domain (INRA, Angers). Fruits
were collected from the middle and outside parts of the
tree canopy at 60 and 110 days after flowering (DAF), and
optimum maturity (Harvest, H). Skin colour and starch
index (7–8) were used to evaluate fruit maturity at harvest
[114]. Fruit collected at optimum maturity were also
stored in a cold room at 1 °C for 1 month (1 M) and
2 months (2 M) before sampling. For RNA extraction,
outer cortex from 5 fruits was sampled and frozen in liquid nitrogen immediately after collection or after 24 h at
room temperature for 1 M and 2 M samples. For biochemical analyses, the cortex tissue of one fruit from each
genotype and each plot was sampled and frozen in liquid
nitrogen immediately after collection or after 24 h at room
temperature for 1 M and 2 M samples (three to five fruits
frozen per genotype and per plot). Fruits were sampled in
2012 except 60 DAF and 110 DAF fruits from PH plot
harvested in 2013. Fruit softening from harvest to 2 M
Page 14 of 20
was checked using an automated penetrometer (TA.XT.PLUS, Stable Micro system) equipped with a 4 mm diameter convex probes as described by Galvez-Lopez et al. [7]
(Additional file 6).
Gene expression analyses
RNA extraction, amplification and microarray hybridization
Total RNAs were extracted using a CTAB extraction
buffer from 3 g of frozen fruit flesh tissue ground in liquid nitrogen, as described in Nobile et al., [15] and
Rienth et al., [115]. mRNAs were amplified, labelled and
co-hybridized according to Celton et al., [36] as following: aRNAs were produced with Message AmpII aRNA
amplification kit (Ambion) from 200 ng of total RNA.
Then, 5 μg of each aRNAs were retrotranscribed and labelled with either Cyanine-3 or Cyanine-5 fluorescent
dye (Interchim, Montluçon, France). Labelled samples
were combined as 30 pmol for each dye and cohybridized to the Nimblegen microarray AryANE v1.0
containing 135,000 60-mers oligonucleotide probes as
described in Celton et al., [36]. Deva software (Nimblegen) was used to extract pair-data files from the scanned
images, obtained using the MS200 microarray scanner
(Roche Nimblegen).
Genotypes were associated in 4 pairs (I062/V083,
V034/W029, H097/I095, I016/H074) for competitive hybridizations at each time point (60 DAF, 110 DAF, H,
1 M and 2 M). Two independent biological repeats were
performed with fruits from PH or P12 plots and technical replicates with dye swap were included for a total
of 38 arrays.
Statistical analysis of microarray data
All statistical analyses were performed as described in
Celton et al., [116] using R software [117]. Briefly, for
each intensity comparison data were normalized with
the Lowess method between microarrays. Normalized
intensity values were then subtracted from the background to provide an estimation of the transcript expression levels. A second normalization by the quantiles
method was then performed on expression values from
all comparisons using the normalize.quantiles function
from the R package preprocessCore [118] (Bioconductor
project). Differential expression analyses between the
different time points were carried out using the lmFit
function and the Bayes moderated t test using the R
package LIMMA [119] from the Bioconductor project.
Genes were considered differentially expressed if the ttest P-values of the samples were below 1 % between 60
DAF and 2 M. To determine number probes expressed,
only signals from the most specific probes belonging to
classes 1–3 were considered for subsequent analysis
(96,120 probes) [36].
Dheilly et al. BMC Plant Biology (2016) 16:201
The microarray data have been submitted to the Gene
Expression Omnibus database ( under the accession number GSE64079.
RT-qPCR analyses
cDNA synthesis and qPCR were performed on totalRNA samples used for the microarray experiment as described in Segonne-Mikol et al., [21]. Primers were designed for short and specific amplification of the
microarray probe region from the selected sequences
with Primer 3 plus software ( (Additional
file 2). Amplicons were sequenced once for each genotype to verify primer specificity. For each run, single
product amplification was confirmed by melting curve
analysis. The amplification efficiency was tested for each
primer pairs using a dilution curve method over a 6
points dilution series (from 1.10−1 to 1.10−6) on a pool
of cDNAs containing all genotypes and developmental
stages included in the study. Primers pairs selected for
further analysis have efficiency above 90 %. RT-qPCR
was carried out for 7 genes at 2 different time points.
Based on the microarray results, three reference genes
with similar expression level in all samples were selected
to calculate a normalization factor: MDP0000645828
(GAPDH), MDP0000146514 and MDP0000207727 (respectively annotated as Protein prenylyltransferase superfamily protein and DC1 domain-containing protein).
Relative expression level was calculated using the formula
ΔCt = (Cttag-Ctref ) derived from the 2−ΔΔC
method, where
T
Ct is the threshold cycle, tag is the target gene, and ref is
the reference gene [120] (Additional file 3).
Sequences analyses
Apple genes annotation based on sequence similarity with
Arabidopsis thaliana were retrieve from the Genome
Database for Rosaceae (GDR, />Mapman gene ontology was used for functional classification and enrichment Wilcoxon test (P-value < 0.05) [121].
Hierarchical clustering of differentially expressed genes
was performed with Genesis software (s.
riken.jp/labs/cbrt/) [122] using the average linkage hierarchical clustering method as agglomeration rule, and
the distance was the similarity between gene expression.
Correlation between expression profiles from selected
genes were carried out using the cor.test function and
the Pearson’s test using the R Stats package [117]. The
expression correlation between two genes was selected if
r >0.7 and P-value <0.01. The gene networks were generated using Cytoscape software [123].
Proteins annotations and predictions for sub-cellular
localization were retrieve from the ProtAnnDB database
( [124].
Potential peroxidases sequences were also analyzed
Page 15 of 20
through PeroxiBase database ( [125]. Proteins sequences multiple
alignment were performed using Kalign tool (http://
msa.sbc.su.se/cgi-bin/msa.cgi) with default parameters
[126]. All protein sequences were retrieve from GenBank
( />Cell wall analyses
Enzymes
Pectin lyase (PL) [EC 4.2.2.10] was purified from
Peclyve (Lyven, France) [127]. Rhamnogalacturonase
(RG) [EC 3.2.1.171] was from Aspergillus aculeatus
(Novozyme, Denmark). Endo-1,4-β-mannanase [EC
3.2.1.78] was from Aspergillus niger (E-BMANN Megazyme, Ireland). Endo-1,4-β-xylanase [EC 3.2.1.8] was
from Trichoderma viride (E-XYTR1 Megazyme) and
endo-β-glucanase [EC 3.2.1.6] was from Trichoderma
sp. (E-CELTR Megazyme) and contained low activity
towards xylan and glucomannan.
Preparation of cell wall material
A pool of the 8 genotypes at each date was realized by
picking randomly one fruit per genotype, per date for
each orchard. Each sample was cut and lyophilized.
Each dried sample was reduced to a fine powder with
a mortar and a pestle. Cell walls were prepared as alcohol insoluble material (AIM) using an automated
solvent extractor (ASE™ 350, Thermo Scientific™ Dionex™) using 80 % ethanol at 100 °C during 15 min
until the ethanol extract was free of soluble sugars.
The AIM was dried at 40 °C under vacuum over P2O5.
The AIM obtained was reduced in powder using a
benchtop homogenizer (FastPrep, MP Biomedicals,
USA) at a speed of 6.5 m.s−1 for 20 s.
AIM sugar composition
Cell wall neutral sugars content were identified and quantified from 5 mg AIM by sulfuric acid hydrolysis according
to Hoebler et al., [128]. AIM was dispersed in 13 M sulfuric acid during 30 min at 30 °C under agitation and then
hydrolyzed in 1 M sulfuric acid (2 h at 100 °C). Sugars
were reduced to alditols with NaBH4 (100 mg mL−1, NH3
3.7 N) during 1 h at 40 °C under agitation. Then alditols
were acetylated using acetic anhydride and imidazole during 20 min at room temperature [129]. Alditol acetates recovered in dichloromethane were analysed by GC
(TRACE GC ULTRA, Thermo Scientific, USA) using TG225MS column (Thermo Scientific, USA). Standard solution of sugars and inositol as an internal standard was
used for calibration. Uronic acids content was quantified
using the metahydroxydiphenyl colorimetric method [94,
97] with galacturonic acid as a standard.
Dheilly et al. BMC Plant Biology (2016) 16:201
AIM starch content
To quantify starch content in cell wall material, AIM
(10 mg) was incubated overnight at room temperature in
200 μL of MOPS (50 mM, pH7) followed by 5 min at
120 °C. Commercial thermostable α-amylase from Bacillus licheniformis (Megazyme, 3000 U mL−1) was added
and the sample was incubated further for 6 min at 100 °C.
After cooling, the sample was adjusted to pH 4.5 by
addition of 400 μL of acetate buffer (200 mM, pH 4.5). It
was further incubated for 30 min at 50 °C with commercial amyloglucosidase from Aspergillus niger (Megazyme,
3300 U mL−1). Glucose released was quantified in
HPAEC-PAD using a CarboPac® PA1 column (4 mm ×
250 mm, Thermo Scientific, USA), thermostated at 25 °C.
An isocratic elution of 500 mM of NaOH was used at a
flow rate 1 mL min−1. Rhamnose was used as an internal
standard for calibration.
Methyl and acetyl esters quantification in AIM
Methyl and acetyl esters was quantified from 5 mg AIM
as described in Levigne et al., [95]. Briefly, samples were
saponified for 1 h at 4 °C in NaOH 1 N and CuSO4
1 mg mL−1. After centrifugation (7400 g, 4 °C for
10 min), the supernatant was filtered (Alltech MaxiClean IC-H, Grace, USA) and analysed by HPLC with a
C18 column (4 mm × 250 mm, 5 μm, Interchim,
France), thermostated at 15 °C. An isocratic elution with
4 mM H2SO4 was used at a flow rate 1.0 mL min−1. Elution was monitored by differential refractometer (2414
refractive index detector, Waters, USA). Standard solution containing methanol, acetic acid and isopropanol as
an internal standard was used for calibration. The degree
of methylesterification (DM) of pectin was calculated as
the number of moles of methanol per 100 moles of
galacturonic acid (GalA).
AIM polysaccharide structure profiling by enzymatic
degradations
Enzymatic degradations
Pectin was partially removed from 5 mg AIM by deionized water (1 mL) at 40 °C under gentle agitation for
15 min followed by boiling for 10 min and centrifugation
(15,300 g, 20 °C for 10 min). The supernatant was removed and the AIM pellet was suspended in deionized
water (1 mL) and digested by a combination of pectin
lyase and rhamnogalacturonase (0.12 U each) at 40 °C
under gentle agitation for 3 h. After centrifugation (as
above), the pellet was washed 3 times with 1 mL deionized water under agitation. Then sequential enzymatic
digestion was applied on the pellet with endo-1,4-βmannanase (10 U), endo-1,4-β-xylanase (25 U) and
endo-β-glucanase (10 U) at 40 °C under gentle agitation
for 17 h [7] (Additional file 8). The three water washes
between enzymatic degradations were discarded. All
Page 16 of 20
supernatants were boiled 10 min prior to filtration
(0.45 μm filter; Millex-Hv, PVDF, Millipore, France) and
analysis by MALDI-TOF MS. Three replicates were realized for biological sample.
Analysis of enzymatic degradation products
The degradation products were analysed by mass spectrometry MALDI. Each supernatant was combined with
the ionic liquid matrix N,N-dimethylaniline/2,5-dihydroxybenzoic (DMA/DHB) [130] and dried on the
MALDI polished steel plate. Three replicates were spotted per enzyme hydrolysate. MALDI-TOF MS analysis
was performed in the positive mode on an Autoflex III
(Bruker Daltonics, Germany) combined with a Smartbeam laser (355 nm, 1000 Hz). The instrument was externally calibrated using galactomannan oligomers (DP
3-9) of known mass. Spectra were recorded in the mass
range m/z 500-3000. Ion masses and intensities were
normalized on m/z 1085 (XXXG oligosaccharide), 731
(Hex4a1 oligosaccharide) and 655 (Pen3U1a1 oligosaccharide) for glucanase, mannanase and xylanase hydrolyzates, respectively. The nomenclature of xyloglucan was
from Fry et al., [131] extended to acetyl esters groups
noted as a, followed by the number of ester groups in
the oligosaccharide. In the oligosaccharides, Hex refers
to hexose, Pen refers to pentose, U refers to uronic acid
(UA), and m to methyl esters. For each letter, the following figure corresponds to the number of residues or substituents in the oligosaccharide.
Statistical analysis
Principal component analyses were performed using the
PCA function using the R Factominer package [132].
Analysis of variances of chemical data was performed
using the anova function on R Stats package [117] and
data were considered significantly different if p < 0.0001.
The correlation analysis between biochemical and
transcriptomic data sets was performed using cor function and the Pearson’s test (P-value <0.01) from the R
Stats package [117]. Expression data were grouped in
three random pools and averaged (Pool1: V034, I062
and V083, Pool2: W029, I095 and H097, Pool3: H074
and I016), to match the three replicates available for biochemical data (Additional file 5).
Availability of supporting data
The datasets supporting the conclusions of this article
are included within the article and its additional files.
The microarray dataset supporting the conclusions of
this article is available in the Gene Expression Omnibus
repository, under the accession number GSE64079
( />
Dheilly et al. BMC Plant Biology (2016) 16:201
Additional files
Additional file 1: Differentially expressed genes during apple
development and ripening. Expression data for differentially expressed
genes between 60DAF and 2 M, displaying similar expression patterns for
the eight genotypes (H074, H097, I016, I062, I095, V034, V083, W029) in
both plots (PH and P12). Genes relatively more expressed during early
fruit development (60 and 110 DAF) or during fruit maturation and cold
storage (H, 1 M and 2 M) were respectively grouped in cluster A and B.
Five time points are 60 days after flowering (60 DAF), 110 days after
flowering (110 DAF), harvest (H), 1 month and 2 months of cold storage
(1 M and 2 M). (XLSX 4945 kb)
Additional file 2: Validation of microarrays results by RT-qPCR. S2-A) List
of primers used for RT-qPCR. S2-B) Validation of microarrays results by
quantitative real-time PCR (qRT-PCR) between 60 days after flowering (60
DAF) and 2 months of cold storage (2 M) for 4 genotypes grown on plot
PH or P12. The three last genes are the reference genes used to calculate
a normalization factor. Ratios were calculated on the normalized data
from microarray analysis (log2 ratio) and as normalized expression for
qRT-PCR (Ct ratio). Correlations between qRT-PCR Ct ratios and microarray
log2 ratios are shown, along with Pearson correlation coefficient. (XLSX
18 kb)
Additional file 3: Cell wall related selected genes and proteins
annotation. Selection of 115 genes potentially involved in the cell wall
dynamic during apple development, maturation and cold storage. Gene
annotation was deduced from sequence similarity with Arabidopsis
genes (TAIR, MapMan). Protein annotation was search in ProtannDB,
CAZy and Peroxibase data bases. CAZy annotations: glycosyl transferases
(GT), glycosyl hydrolase (GH), polysaccharide lyase (PL), carbohydrate
esterase (CE), auxiliary activity (AA). The sub-cellular localization of the deduced proteins was predicted using ProtAnnDB and Peroxibase databases. Number of protein transmembrane domains was search using
tmhmm. (XLSX 154 kb)
Additional file 4: Co-expression networks of clusters A and B. The
distance between 2 genes corresponds to level of correlation, the more
the genes expression profiles are correlated, the shorter is the distance.
The colour code indicates the gene functional category according to the
curated annotation (Additional file 3). (PPTX 731 kb)
Additional file 5: Heatmap of data sets correlation. Heatmap of
correlation between selected genes expression profiles and
monosaccharide content of cell wall (%NSP) or oligosaccharides relative
content in glucanase digest during apple development and ripening.
Positive and negative correlations are respectively shown in red and blue
colours. (XLSX 28 kb)
Additional file 6: Fruit firmness evolution during cold storage. Fruit
firmness was evaluated by penetrometry from harvest (H) to 2 months of
cold storage (2 M). Assessment of firmness was performed on the
opposite sides of each fruit in the blush and shaded regions. Force in
Newtons (N) was measured at 7 mm of displacement. The bold and dash
lines are respectively associated with plot PH and P12. (PPTX 81 kb)
Additional file 7: Matrix of identity for β-galactosidase glycosyl hydrolase 35 domain and expansin DPBB and Pollen allergen domains. S7-A:
matrix of identity for β-galactosidase glycosyl hydrolase 35 domains. S7-B:
matrix of identity for expansin DPBB (double-psi beta-barrel) and Pollen
allergen domains. (XLSX 26 kb)
Additional file 8: Schema of treatments was applied on AIM. (PPTX
63 kb)
Abbreviations
1 M: One month of cold storage; 2 M: Two months of cold storage;
AGP: Arabinogalactan protein; AIM: Alcohol insoluble material;
Ara: Arabinose; Fuc: Fucose; AS: Antisense; CSLA: Cellulose synthase-like A;
DAF: Days after flowering; DM: Degree of methylesterification;
EXLA: Expansin-like A; EXLB: Expansin-like B; EXPA: α-expansin; EXPB: βexpansin; FLA: Fasciclin like arabinogalactan protein; Gal: Galactose;
GalA: Acid galacturonic; GATL: Galacturonosyltransferase-like;
GAUT: Galacturonosyltransferase; GAX: Glucuronoarabinoxylan;
GgM: Galactoglucomannan; GH: Glycoside hydrolase; Glc: Glucose;
Page 17 of 20
GT: Glycosyltransferase; GUX: Glucuronoxylan; H: Harvest;
HG: Homogalacturonan; HRGP: Hydroxyproline-rich glycoproteins;
Man: Mannose; MTH: Mannan endotransglucosylase/hydrolase; NS: Neutral
sugars; NSP: Non-starch polysaccharides; PG: Polygalacturonase; PME: Pectin
methylesterase; PS: Pectin soluble; RGI: Rhamnogalacturonan I;
RGII: Rhamnogalacturonan II; Rha: Rhamnose; ROS: Reactive oxygen species;
UA: Uronic acids; WS: Water soluble; XTH: Xyloglucan endotransglucosylase/
hydrolase; XyG: Xyloglucan; XyGos: Xyloglucan oligosaccharides; Xyl: Xylose
Acknowledgements
The authors would like to thank Sylvain Hanteville, Maryline Bruneau and
Jacqueline Vigouroux for their help in orchard and lab analyses, Jean-Marc
Celton for his help in transcriptomic analyses, the INRA-Horticultural experimental unit (UEH0449) for the apple trees maintenance, the ANAN platform of the
SFR QuaSaV for microarray facilities access, the BIBS (INRA Nantes) platform for
biochemical and MS analyses and Thomas Baldwin for English proofreading.
Funding
This work was supported by the Institut National de la Recherche
Agronomique and by the Region Pays de la Loire (program AI FRUIT).
Availability of data and materials
The data sets supporting the results of this article are included within the
article and its additional files. The microarray data have been submitted to
the Gene Expression Omnibus database ( />under the accession number GSE64079. The fruit material is available from
INRA-IRHS Angers.
Authors’ contributions
ED, SLG, JPR, MO, EB and ML conceived and designed the research. ED
carried out all experiments with assistance of MCG for transcriptomic
experiment and SLG for biochemical analyses. ED, SLG, MO, JPR, EB and ML
wrote the paper. All authors read and approved the final manuscript.
Competing interests
The authors declare that they have no competing interests.
Consent for publication
Not applicable.
Ethics approval and consent to participate
Not applicable.
Received: 3 March 2016 Accepted: 1 September 2016
References
1. Janssen BJ, Thodey K, Schaffer RJ, Alba R, Balakrishnan L, Bishop R, Bowen
JH, Crowhurst RN, Gleave AP, Ledger S, McArtney S, Pichler FB, Snowden
KC, Ward S. Global gene expression analysis of apple fruit development
from the floral bud to ripe fruit. BMC Plant Biol. 2008;8:16.
2. Almeida DPF, Huber DJ. Apoplastic pH and inorganic ion levels in tomato
fruit: a potential means for regulation of cell wall metabolism during
ripening. Physiol Plant. 1999;105:506–12.
3. Toivonen PMA, Brummell DA. Biochemical bases of appearance and texture
changes in fresh-cut fruit and vegetables. Postharvest Biol Technol. 2008;48:1–14.
4. Shackel KA, Greve C, Labavitch JM, Ahmadi H. Cell turgor changes associated
with ripening in tomato pericarp tissue. Plant Physiol. 1991;97:814–6.
5. Saladié M, Matas AJ, Isaacson T, Jenks MA, Goodwin SM, Niklas KJ, Xiaolin R,
Labavitch JM, Shackel KA, Fernie AR, Lytovchenko A, O’Neill MA, Watkins CB,
Rose JKC. A reevaluation of the key factors that influence tomato fruit
softening and integrity. Plant Physiol. 2007;144:1012–28.
6. Brummell DA. Cell wall disassembly in ripening fruit. Funct Plant Biol.
2006;33:103–19.
7. Galvez-Lopez D, Laurens F, Quéméner B, Lahaye M. Variability of cell wall
polysaccharides composition and hemicellulose enzymatic profile in an
apple progeny. Int J Biol Macromol. 2011;49:1104–9.
8. Tong C, Krueger D, Vickers Z, Bedford D, Luby J, El-Shiekh A, Shackel KA,
Ahmadi H. Comparison of softening-related changes during storage of
‘Honeycrisp’ apple, its parents, and ‘Delicious’. J Amer Soc Hort Sci.
1999;124:407–15.
Dheilly et al. BMC Plant Biology (2016) 16:201
9.
10.
11.
12.
13.
14.
15.
16.
17.
18.
19.
20.
21.
22.
23.
24.
25.
26.
27.
28.
29.
30.
31.
Nelmes BJ, Preston RD. Wall development in apple fruits: a study of the life
history of a parenchyma cell. J Exp Bot. 1968;19:496–518.
Fischer M, Amado R. Changes in the pectic substances of apples during
development and postharvest ripening. Part 1: analysis of the alcoholinsoluble residue. Carbohydr Polym. 1994;25:161–6.
Gross KC, Sams CE. Changes in cell wall neutral sugar composition during
fruit ripening: a species survey. Phytochemistry. 1984;23:2457–61.
Peña MJ, Carpita NC. Loss of highly branched arabinans and debranching of
rhamnogalacturonan I accompany loss of firm texture and cell separation
during prolonged storage of apple. Plant Physiol. 2004;135:1305–13.
Redgwell RJ, Fischer M, Kendal E, MacRae EA. Galactose loss and fruit
ripening: high-molecular-weight arabinogalactans in the pectic
polysaccharides of fruit cell walls. Planta. 1997;203:174–81.
Goulao LF, Oliveira CM. Cell wall modifications during fruit ripening: when a
fruit is not the fruit. Trends Food Sci Technol. 2008;19:4–25.
Nobile PM, Wattebled F, Quecini V, Girardi CL, Lormeau M, Laurens F.
Identification of a novel α-L-arabinofuranosidase gene associated with
mealiness in apple. J Exp Bot. 2011;62:4309–21.
Wei J, Ma F, Shi S, Qi X, Zhu X, Yuan J. Changes and postharvest regulation
of activity and gene expression of enzymes related to cell wall degradation
in ripening apple fruit. Postharvest Biol Technol. 2010;56:147–54.
Goulao LF, Santos J, de Sousa I, Oliveira CM. Patterns of enzymatic activity
of cell wall-modifying enzymes during growth and ripening of apples.
Postharvest Biol Technol. 2007;43:307–18.
Jarvis MC, Briggs SPH, Knox JP. Intercellular adhesion and cell separation in
plants. Plant Cell Environ. 2003;26:977–89.
Ng JKT, Schröder R, Brummell DA, Sutherland PW, Hallett IC, Smith BG,
Melton LD, Johnston JW. Lower cell wall pectin solubilisation and galactose
loss during early fruit development in apple (Malus x domestica) cultivar
“Scifresh” are associated with slower softening rate. J Plant Physiol.
2015;176C:129–37.
Atkinson RG, Sutherland PW, Johnston SL, Gunaseelan K, Hallett IC, Mitra D,
Brummell DA, Schröder R, Johnston JW, Schaffer RJ. Down-regulation of
POLYGALACTURONASE1 alters firmness, tensile strength and water loss in
apple (Malus x domestica) fruit. BMC Plant Biol. 2012;12:129.
Segonne-Mikol S, Bruneau M, Celton J-M, Le Gall S, Francin-Allami M,
Juchaux M, Laurens F, Orsel M, Renou J-P. Multiscale investigation of
mealiness in apple: an atypical role for a pectin methylesterase during fruit
maturation. BMC Plant Biol. 2014;14:375.
Percy AE, Melton LD, Jameson PE. Xyloglucan and hemicelluloses in the cell
wall during apple fruit development and ripening. Plant Sci. 1997;125:31–9.
Atkinson RG, Johnston SL, Yauk Y-K, Sharma NN, Schröder R. Analysis of
xyloglucan endotransglucosylase/hydrolase (XTH) gene families in kiwifruit
and apple. Postharvest Biol Technol. 2009;51:149–57.
Costa F, Van de Weg WE, Stella S, Dondini L, Pratesi D, Musacchi S, Sansavini S.
Map position and functional allelic diversity of Md-Exp7, a new putative
expansin gene associated with fruit softening in apple (malus × domestica
borkh.) and pear (pyrus communis). Tree Genet Genomes. 2008;4:575–86.
Ireland HS, Gunaseelan K, Muddumage R, Tacken EJ, Putterill J, Johnston JW,
Schaffer RJ. Ethylene regulates apple (malus x domestica) fruit softening
through a dose x time-dependent mechanism and through differential
sensitivities and dependencies of cell wall-modifying genes. Plant Cell
Physiol. 2014;55:1005–16.
Trujillo DI, Mann HS, Tong CBS. Examination of expansin genes as related to
apple fruit crispness. Tree Genet Genomes. 2011;8:27–38.
Wakasa Y, Hatsuyama Y, Takahashi A, Sato T, Niizeki M, Harada T. Divergent
expression of six expansin genes during apple fruit ontogeny. Eur J Hortic
Sci. 2003;68:253–9.
Ting VJL, Silcock P, Bremer PJ, Biasioli F. X-ray micro-computer tomographic
method to visualize the microstructure of different apple cultivars. J Food
Sci. 2013;78:E1735–42.
Winisdorffer G, Musse M, Quellec S, Barbacci A, Le GS, Mariette F, Lahaye M.
Analysis of the dynamic mechanical properties of apple tissue and
relationships with the intracellular water status, gas distribution, histological
properties and chemical composition. Postharvest Biol Technol. 2015;104:1–16.
Ng JKT, Schröder R, Sutherland PW, Hallett IC, Hall MI, Prakash R, Smith BG,
Melton LD, Johnston JW. Cell wall structures leading to cultivar differences
in softening rates develop early during apple (malus × domestica) fruit
growth. BMC Plant Biol. 2013;13:183.
Khan AA, Vincent JFV. Compressive stiffness and fracture properties of apple
and potato parenchyma. J Texture Stud. 1993;24:423–35.
Page 18 of 20
32. Barreiro P, Moya A, Correa E, Ruiz-Altisent M, Fernández-Valle M, Peirs A,
Wright KM, Hills BP. Prospects for the rapid detection of mealiness in apples
by nondestructive NMR relaxometry. Appl Magn Reson. 2002;22:387–400.
33. Ray S, Vigouroux J, Quémener B, Bonnin E, Lahaye M. Novel and diverse fine
structures in LiCl-DMSO extracted apple hemicelluloses. Carbohydr Polym.
2014;108:46–57.
34. Nara K, Ito S, Kato K, Kato Y. Isolation of galactoglucomannan from apple
hemicellulosic polysaccharides with binding capacity to cellulose. J Appl
Glycosci. 2004;51:321–5.
35. Voragen FGJ, Schols HA, Pilnik W. Structural features of the hemicellulose
polymers of apples. Z Lebensm Unters Forsch. 1986;183:105–10.
36. Celton J-M, Gaillard S, Bruneau M, Pelletier S, Aubourg S, Martin-Magniette M-L,
Navarro L, Laurens F, Renou J-P. Widespread anti-sense transcription in apple is
correlated with siRNA production and indicates a large potential for
transcriptional and/or post-transcriptional control. New Phytol. 2014;203:287–99.
37. San Clemente H, Jamet E. WallProtDB, a database resource for plant cell
wall proteomics. Plant Methods. 2015;11:2.
38. Velasco R, Zharkikh A, Affourtit J, Dhingra A, Cestaro A, Kalyanaraman A,
Fontana P, Bhatnagar SK, Troggio M, Pruss D, Salvi S, Pindo M, Baldi P,
Castelletti S, Cavaiuolo M, Coppola G, Costa F, Cova V, Dal Ri A, Goremykin
V, Komjanc M, Longhi S, Magnago P, Malacarne G, Malnoy M, Micheletti D,
Moretto M, Perazzolli M, Si-Ammour A, Vezzulli S, et al. The genome of the
domesticated apple (malus × domestica borkh.). Nat Genet. 2010;42:833–9.
39. Gwanpua SG, Mellidou I, Boeckx J, Kyomugasho C, Bessemans N, Verlinden BE,
Hertog MLATM, Hendrickx M, Nicolai B, Geeraerd AH. Expression analysis of
candidate cell wall-related genes associated with changes in pectin biochemistry
during postharvest apple softening. Postharvest Biol Technol. 2016.
40. Harb J, Gapper NE, Giovannoni JJ, Watkins CB. Molecular analysis of
softening and ethylene synthesis and signaling pathways in a non-softening
apple cultivar, “Honeycrisp” and a rapidly softening cultivar, “McIntosh.”.
Postharvest Biol Technol. 2012;64:94–103.
41. Marcus SE, Verhertbruggen Y, Hervé C, Ordaz-Ortiz JJ, Farkas V, Pedersen HL,
Willats WGT, Knox JP. Pectic homogalacturonan masks abundant sets of
xyloglucan epitopes in plant cell walls. BMC Plant Biol. 2008;8:60.
42. Renard CMGC, Lomax JA, Boon JJ. Apple-fruit xyloglucans: a comparative
study of enzyme digests of whole cell walls and of alkali-extracted
xyloglucans. Carbohydr Res. 1992;232:303–20.
43. Soria-Guerra RE, Rosales-Mendoza S, Gasic K, Wisniewski ME, Band M,
Korban SS. Gene expression is highly regulated in early developing fruit of
apple. Plant Mol Biol Report. 2011;29:885–97.
44. Lee Y-P, Yu G-H, Seo YS, Han SE, Choi Y-O, Kim D, Mok I-G, Kim WT, Sung SK. Microarray analysis of apple gene expression engaged in early fruit
development. Plant Cell Rep. 2007;26:917–26.
45. Soglio V, Costa F, Molthoff JW, Weemen-Hendriks WMJ, Schouten HJ,
Gianfranceschi L. Transcription analysis of apple fruit development using
cDNA microarrays. Tree Genet Genomes. 2009;5:685–98.
46. Zhu Y, Zheng P, Varanasi V, Shin S, Main D, Curry E, Mattheis JP. Multiple
plant hormones and cell wall metabolism regulate apple fruit maturation
patterns and texture attributes. Tree Genet Genomes. 2012;8:1389–406.
47. Nicol F, His I, Jauneau A, Vernhettes S, Canut H, Höfte H. A plasma membranebound putative endo-1,4-beta-D-glucanase is required for normal wall assembly
and cell elongation in Arabidopsis. EMBO J. 1998;17:5563–76.
48. Wilson MH, Holman TJ, Sørensen I, Cancho-Sanchez E, Wells DM, Swarup R,
Knox JP, Willats WGT, Ubeda-Tomás S, Holdsworth M, Bennett MJ,
Vissenberg K, Hodgman TC. Multi-omics analysis identifies genes mediating
the extension of cell walls in the Arabidopsis thaliana root elongation zone.
Front cell Dev Biol. 2015;3:10.
49. Xiao C, Somerville C, Anderson CT. POLYGALACTURONASE INVOLVED IN
EXPANSION1 functions in cell elongation and flower development in
Arabidopsis. Plant Cell. 2014;26:1018–35.
50. Massiot P, Baron A, Drilleau JF. Effect of storage of apple on the enzymatic
hydrolysis of cell wall polysaccharides. Carbohydr Polym. 1996;29:301–7.
51. Costa F, Peace CP, Stella S, Serra S, Musacchi S, Bazzani M, Sansavini S, Van
de Weg WE. QTL dynamics for fruit firmness and softening around an
ethylene-dependent polygalacturonase gene in apple (malus × domestica
borkh.). J Exp Bot. 2010;61:3029–39.
52. Brummell DA, Dal Cin V, Crisosto CH, Labavitch JM. Cell wall metabolism during
maturation, ripening and senescence of peach fruit. J Exp Bot. 2004;55:2029–39.
53. Levesque-Tremblay G, Pelloux J, Braybrook SA, Müller K. Tuning of pectin
methylesterification: consequences for cell wall biomechanics and
development. Planta. 2015.
Dheilly et al. BMC Plant Biology (2016) 16:201
54. Harriman RW, Tieman DM, Handa AK. Molecular cloning of tomato pectin
methylesterase gene and its expression in Rutgers, ripening inhibitor,
nonripening, and never ripe tomato fruits. PLANT Physiol. 1991;97:80–7.
55. Hyodo H, Terao A, Furukawa J, Sakamoto N, Yurimoto H, Satoh S, Iwai H.
Tissue specific localization of pectin-Ca2+ cross-linkages and pectin methylesterification during fruit ripening in tomato (Solanum lycopersicum). PLoS
One. 2013;8:e78949.
56. Schols HA, Voragen AGJ. Complex pectins: Structure elicudation using
enzymes In: Visser J, Voragen AGJ, editors. Pectins and Pectinases. vol. 14.
Amsterdam: Elsevier; 1996. p. 3–19.
57. Greve LC, Labavitch JM. Cell wall metabolism in ripening fruit : V. Analysis of cell
wall synthesis in ripening tomato pericarp tissue using a D-[U-13C] glucose tracer
and gas chromatography–mass spectrometry. Plant Physiol. 1991;97:1456–61.
58. Huysamer M, Greve LC, Labavitch JM. Cell wall metabolism in ripening fruit.
VIII. Cell wall composition and synthetic capacity of two regions of the
outer pericarp of mature green and red ripe cv. Jackpot tomatoes. Physiol
Plant. 1997;101:314–22.
59. Pauly M, Qin Q, Greene H, Albersheim P, Darvill A, York WS. Changes in the
structure of xyloglucan during cell elongation. Planta. 2001;212:842–50.
60. Lahaye M, Quemener B, Causse M, Seymour GB. Hemicellulose fine structure
is affected differently during ripening of tomato lines with contrasted
texture. Int J Biol Macromol. 2012;51:462–70.
61. Park YB, Cosgrove DJ. Xyloglucan and its interactions with other
components of the growing cell wall. Plant Cell Physiol. 2015;56:180–94.
62. Han Y, Zhu Q, Zhang Z, Meng K, Hou Y, Ban Q, Suo J, Rao J. Analysis of
xyloglucan endotransglycosylase/hydrolase (XTH) genes and diverse roles of
isoenzymes during persimmon fruit development and postharvest
softening. PLoS One. 2015;10:e0123668.
63. Miedes E, Lorences EP. Xyloglucan endotransglucosylase/hydrolases (XTHs)
during tomato fruit growth and ripening. J Plant Physiol. 2009;166:489–98.
64. Xiao C, Zhang T, Zheng Y, Cosgrove DJ, Anderson CT. Xyloglucan deficiency
disrupts microtubule stability and cellulose biosynthesis in Arabidopsis,
altering cell growth and morphogenesis. Plant Physiol. 2016;170:234–49.
65. Johnson KL, Jones BJ, Bacic A, Schultz CJ. The fasciclin-like arabinogalactan
proteins of Arabidopsis. A multigene family of putative cell adhesion
molecules. Plant Physiol. 2003;133:1911–25.
66. MacMillan CP, Mansfield SD, Stachurski ZH, Evans R, Southerton SG. Fasciclinlike arabinogalactan proteins: specialization for stem biomechanics and cell
wall architecture in Arabidopsis and Eucalyptus. Plant J. 2010;62:689–703.
67. Günl M, Pauly M. AXY3 encodes a α-xylosidase that impacts the structure
and accessibility of the hemicellulose xyloglucan in Arabidopsis plant cell
walls. Planta. 2011;233:707–19.
68. Liepman AH, Wilkerson CG, Keegstra K. Expression of cellulose synthase-like
(Csl) genes in insect cells reveals that CslA family members encode mannan
synthases. Proc Natl Acad Sci U S A. 2005;102:2221–6.
69. Goubet F, Misrahi A, Park SK, Zhang Z, Twell D, Dupree P. AtCSLA7, a cellulose
synthase-like putative glycosyltransferase, is important for pollen tube growth
and embryogenesis in Arabidopsis. Plant Physiol. 2003;131:547–57.
70. Melton LD, Smith BG, Ibrahim R, Schröder R. Mannans in primary and
secondary plant cell walls. New Zeal J For Sci. 2009;39:153–60.
71. Schröder R, Atkinson RG, Redgwell RJ. Re-interpreting the role of endo-betamannanases as mannan endotransglycosylase/hydrolases in the plant cell
wall. Ann Bot. 2009;104:197–204.
72. Ordaz-Ortiz JJ, Marcus SE, Paul Knox J. Cell wall microstructure analysis
implicates hemicellulose polysaccharides in cell adhesion in tomato fruit
pericarp parenchyma. Mol Plant. 2009;2:910–21.
73. Volz RK, Harker FR, Lang S. Firmness decline in ‘Gala’ apple during fruit
development. J Amer Soc Hort Sci. 2003;128:797–802.
74. Tan L, Eberhard S, Pattathil S, Warder C, Glushka J, Yuan C, Hao Z, Zhu X,
Avci U, Miller JS, Baldwin D, Pham C, Orlando R, Darvill A, Hahn MG,
Kieliszewski MJ, Mohnen D. An Arabidopsis cell wall proteoglycan consists
of pectin and arabinoxylan covalently linked to an arabinogalactan protein.
Plant Cell. 2013;25:270–87.
75. Prakash R, Johnston SL, Boldingh HL, Redgwell RJ, Atkinson RG, Melton LD,
Brummell DA, Schröder R. Mannans in tomato fruit are not depolymerized
during ripening despite the presence of endo-β-mannanase. J Plant Physiol.
2012;169:1125–33.
76. Johnston SL, Prakash R, Chen NJ, Kumagai MH, Turano HM, Cooney JM,
Atkinson RG, Paull RE, Cheetamun R, Bacic A, Brummell DA, Schröder R. An
enzyme activity capable of endotransglycosylation of heteroxylan
polysaccharides is present in plant primary cell walls. Planta. 2013;237:173–87.
Page 19 of 20
77. McQueen-Mason S. Two endogenous proteins that induce cell wall
extension in plants. Plant Cell. 1992;4:1425–33.
78. Cosgrove DJ. Plant expansins: diversity and interactions with plant cell walls.
Curr Opin Plant Biol. 2015;25:162–72.
79. Brummell DA, Harpster MH, Dunsmuir P. Differential expression of expansin
gene family members during growth and ripening of tomato fruit. Plant
Mol Biol. 1999;39:161–9.
80. Hiwasa K, Rose JKC, Nakano R, Inaba A, Kubo Y. Differential expression of
seven alpha-expansin genes during growth and ripening of pear fruit.
Physiol Plant. 2003;117:564–72.
81. Harrison EP, McQueen-Mason SJ, Manning K. Expression of six expansin
genes in relation to extension activity in developing strawberry fruit. J Exp
Bot. 2001;52:1437–46.
82. Zhang S, Xu R, Gao Z, Chen C, Jiang Z, Shu H. A genome-wide analysis
of the expansin genes in malus × domestica. Mol Genet Genomics.
2014;289:225–36.
83. Hayama H, Ito A, Moriguchi T, Kashimura Y. Identification of a new expansin
gene closely associated with peach fruit softening. Postharvest Biol Technol.
2003;29:1–10.
84. Sampedro J, Cosgrove DJ. The expansin superfamily. Genome Biol. 2005;6:242.
85. Tateishi A, Nagashima K, Mathooko FM, Mwaniki MW, Kubo Y, Inaba A,
Yamaki S, Inoue H. Differential expression of members of the βgalactosidase gene family during Japanese pear (Pyrus pyrifolia L.) fruit
growth and on-tree ripening. J Am Soc Hortic Sci. 2005;130:819–29.
86. Franková L, Fry SC. Biochemistry and physiological roles of enzymes that
“cut and paste” plant cell-wall polysaccharides. J Exp Bot.
2013;64:3519–50.
87. de Lima D, Buckeridge M. Interaction between cellulose and storage
xyloglucans: the influence of the degree of galactosylation. Carbohydr
Polym. 2001;46:157–63.
88. Zykwinska A, Thibault J-F, Ralet M-C. Organization of pectic arabinan and
galactan side chains in association with cellulose microfibrils in primary cell
walls and related models envisaged. J Exp Bot. 2007;58:1795–802.
89. Lin D, Lopez-Sanchez P, Gidley MJ. Binding of arabinan or galactan during
cellulose synthesis is extensive and reversible. Carbohydr Polym. 2015;126:108–21.
90. Maris A, Suslov D, Fry SC, Verbelen J-P, Vissenberg K. Enzymic
characterization of two recombinant xyloglucan endotransglucosylase/
hydrolase (XTH) proteins of Arabidopsis and their effect on root growth and
cell wall extension. J Exp Bot. 2009;60:3959–72.
91. Maris A, Kaewthai N, Eklöf JM, Miller JG, Brumer H, Fry SC, Verbelen J-P,
Vissenberg K. Differences in enzymic properties of five recombinant
xyloglucan endotransglucosylase/hydrolase (XTH) proteins of Arabidopsis
thaliana. J Exp Bot. 2011;62:261–71.
92. Shi H, Kim Y, Guo Y, Stevenson B, Zhu J-K. The Arabidopsis SOS5 locus
encodes a putative cell surface adhesion protein and is required for normal
cell expansion. Plant Cell. 2003;15:19–32.
93. Gwanpua SG, Mellidou I, Boeckx J, Kyomugasho C, Bessemans N, Verlinden
BE, Hertog MLATM, Hendrickx M, Nicolai BM, Geeraerd AH. Expression
analysis of candidate cell wall-related genes associated with changes in
pectin biochemistry during postharvest apple softening. Postharvest Biol
Technol. 2016;112:176–85.
94. Thibault J-F. Automatisation du dosage des substances pectiques par la
méthode au meta-hydroxydiphenyl. Leb Technol. 1979;12:247–51.
95. Levigne S, Thomas M, Ralet M-C, Quemener B, Thibault J-F. Determination
of the degrees of methylation and acetylation of pectins using a C18
column and internal standards. Food Hydrocoll. 2002;16:547–50.
96. Fischer M, Arrigoni E, Amado R. Changes in the pectic substances of apples
during development and postharvest ripening. Part 2: analysis of the pectic
fractions. Carbohydr Polym. 1994;25:167–75.
97. Blumenkrantz N, Asboe-Hansen G. New method for quantitative
determination of uronic acids. Anal Biochem. 1973;54:484–9.
98. Smith DL, Abbott JA, Gross KC. Down-regulation of tomato beta-galactosidase
4 results in decreased fruit softening. Plant Physiol. 2002;129:1755–62.
99. Cosio C, Dunand C. Specific functions of individual class III peroxidase
genes. J Exp Bot. 2009;60:391–408.
100. Brownleader MD, Ahmed N, Trevan M, Chaplin MF, Dey PM. Purification and
partial characterization of tomato extensin peroxidase. Plant Physiol. 1995;
109:1115–23.
101. Liszkay A, Kenk B, Schopfer P. Evidence for the involvement of cell wall
peroxidase in the generation of hydroxyl radicals mediating extension
growth. Planta. 2003;217:658–67.
Dheilly et al. BMC Plant Biology (2016) 16:201
102. Dunand C, Tognolli M, Overney S, von Tobel L, de Meyer M, Simon P, Penel
C. Identification and characterisation of Ca2 + −pectate binding peroxidases
in Arabidopsis thaliana. J Plant Physiol. 2002;159:1165–71.
103. Fry SC. Oxidative scission of plant cell wall polysaccharides by ascorbateinduced hydroxyl radicals. Biochem J. 1998;332((Pt 2):507–15.
104. Schopfer P. Hydroxyl radical-induced cell-wall loosening in vitro and in vivo:
implications for the control of elongation growth. Plant J. 2001;28:679–88.
105. Passardi F, Tognolli M, De Meyer M, Penel C, Dunand C. Two cell wall
associated peroxidases from Arabidopsis influence root elongation. Planta.
2006;223:965–74.
106. Passardi F, Penel C, Dunand C. Performing the paradoxical: how plant
peroxidases modify the cell wall. Trends Plant Sci. 2004;9:534–40.
107. Castellarin SD, Gambetta GA, Wada H, Krasnow MN, Cramer GR, Peterlunger
E, Shackel KA, Matthews MA. Characterization of major ripening events
during softening in grape: turgor, sugar accumulation, abscisic acid
metabolism, colour development, and their relationship with growth. J Exp
Bot. 2015;67:709–22.
108. Grignon C, Sentenac H. pH and ionic conditions in the apoplast. Annu Rev
Plant Physiol Plant Mol Biol. 1991;42:103–28.
109. Shiratake K, Martinoia E. Transporters in fruit vacuoles. Plant Biotechnol.
2007;24:127–33.
110. Zhang L-Y, Peng Y-B, Pelleschi-Travier S, Fan Y, Lu Y-F, Lu Y-M, Gao X-P,
Shen Y-Y, Delrot S, Zhang D-P. Evidence for apoplasmic phloem unloading
in developing apple fruit. Plant Physiol. 2004;135:574–86.
111. Wada H, Matthews MA, Shackel KA. Seasonal pattern of apoplastic solute
accumulation and loss of cell turgor during ripening of Vitis vinifera fruit
under field conditions. J Exp Bot. 2009;60:1773–81.
112. Kouassi AB, Durel C-E, Costa F, Tartarini S, van de Weg E, Evans K, FernandezFernandez F, Govan C, Boudichevskaja A, Dunemann F, Antofie A, Lateur M,
Stankiewicz-Kosyl M, Soska A, Tomala K, Lewandowski M, Rutkovski K, Zurawicz
E, Guerra W, Laurens F. Estimation of genetic parameters and prediction of
breeding values for apple fruit-quality traits using pedigreed plant material in
Europe. Tree Genet Genomes. 2009;5:659–72.
113. Ben Sadok I, Tiecher A, Galvez-Lopez D, Lahaye M, Lasserre-Zuber P,
Bruneau M, Hanteville S, Robic R, Cournol R, Laurens F. Apple fruit texture
QTLs: year and cold storage effects on sensory and instrumental traits. Tree
Genet Genomes. 2015;11:119.
114. Pitts MJ, Cavalieri RP. Objective assessment of apple maturity based on
starch location. Trans ASAE. 1988;31.
115. Rienth M, Torregrosa L, Ardisson M, De Marchi R, Romieu C. Versatile and
efficient RNA extraction protocol for grapevine berry tissue, suited for next
generation RNA sequencing. Aust J Grape Wine Res. 2014;20:247–54.
116. Celton J-M, Dheilly E, Guillou M-C, Simonneau F, Juchaux M, Costes E,
Laurens F, Renou J-P. Additional amphivasal bundles in pedicel pith
exacerbate central fruit dominance and induce self-thinning of lateral
fruitlets in apple. Plant Physiol. 2014;164:1930–51.
117. R Development Core Team: R: A language and environment for statistical
computing. 2013. />118. Bolstad BM. Probe level quantile normalization of high density
oligonucleotide array data. 2001.
119. Smyth GK. Limma: linear models for microarray data. In: Gentleman R, Carey V,
Dudoit S, Irizarry R, Hubert W, editors. Bioinformatics and computational biology
solutions using R and bioconductor. New York: Springer; 2005. p. 397–420.
120. Livak KJ, Schmittgen TD. Analysis of relative gene expression data using
real-time quantitative PCR and the 2(−delta delta C(T)) method. Methods.
2001;25:402–8.
121. Usadel B, Nagel A, Thimm O, Redestig H, Blaesing OE, Palacios-Rojas N, Selbig
J, Hannemann J, Piques MC, Steinhauser D, Scheible W-R, Gibon Y, Morcuende
R, Weicht D, Meyer S, Stitt M. Extension of the visualization tool MapMan to
allow statistical analysis of arrays, display of corresponding genes, and
comparison with known responses. Plant Physiol. 2005;138:1195–204.
122. Sturn A, Quackenbush J, Trajanoski Z. Genesis. Bioinformatics. 2002;18:207–8.
123. Shannon P, Markiel A, Ozier O, Baliga NS, Wang JT, Ramage D, Amin N,
Schwikowski B, Ideker T. Cytoscape: a software environment for integrated
models of biomolecular interaction networks. Genome Res. 2003;13:2498–504.
124. Clemente HS, Pont-Lezica R, Jamet E. Bioinformatics as a tool for assessing the
quality of sub-cellular proteomic strategies and inferring functions of proteins:
plant cell wall proteomics as a test case. Bioinform Biol Insights. 2009;3:15–28.
125. Fawal N, Li Q, Savelli B, Brette M, Passaia G, Fabre M, Mathé C, Dunand C.
PeroxiBase: a database for large-scale evolutionary analysis of peroxidases.
Nucleic Acids Res. 2013;41:D441–4.
Page 20 of 20
126. Lassmann T, Sonnhammer ELL. Kalign–an accurate and fast multiple
sequence alignment algorithm. BMC Bioinformatics. 2005;6:298.
127. Ralet M-C, Williams MAK, Tanhatan-Nasseri A, Ropartz D, Quemener B,
Bonnin E. Innovative enzymatic approach to resolve homogalacturonans
based on their methylesterification pattern. Biomacromolecules.
2012;13:1615–24.
128. Hoebler C, Barry JL, David A, Delort-Laval J. Rapid acid hydrolysis of plant
cell wall polysaccharides and simplified quantitative determination of their
neutral monosaccharides by gas–liquid chromatography. J Agric Food
Chem. 1989;37:360–7.
129. Englyst HN, Cummings JH. Improved method for measurement of dietary
fiber as non-starch polysaccharides in plant food. J Assoc Off Anal Chem.
1988;71:808–14.
130. Ropartz D, Bodet P-E, Przybylski C, Gonnet F, Daniel R, Fer M, Helbert W,
Bertrand D, Rogniaux H. Performance evaluation on a wide set of matrixassisted laser desorption ionization matrices for the detection of
oligosaccharides in a high-throughput mass spectrometric screening of
carbohydrate depolymerizing enzymes. Rapid Commun Mass Spectrom.
2011;25:2059–70.
131. Fry SC, York WS, Albersheim P, Darvill A, Hayashi T, Joseleau J-P, Kato Y,
Lorences EP, Maclachlan GA, McNeil M, Mort AJ, Grant Reid JS, Seitz HU,
Selvendran RR, Voragen AGJ, White AR. An unambiguous nomenclature for
xyloglucan-derived oligosaccharides. Physiol Plant. 1993;89:1–3.
132. Lê S, Josse J, Husson F. FactoMineR: an R package for multivariate analysis.
J Stat Softw. 2008;25:1–18.
133. Tuomivaara ST, Yaoi K, O'Neill MA, York WS. Generation and structural
validation of a library of diverse xyloglucan-derived oligosaccharides, including
an update on xyloglucan nomenclature. Carbohydr Res. 2015;402:56–66.
Submit your next manuscript to BioMed Central
and we will help you at every step:
• We accept pre-submission inquiries
• Our selector tool helps you to find the most relevant journal
• We provide round the clock customer support
• Convenient online submission
• Thorough peer review
• Inclusion in PubMed and all major indexing services
• Maximum visibility for your research
Submit your manuscript at
www.biomedcentral.com/submit
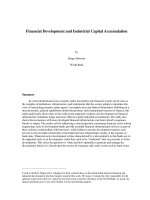

![Tài liệu Local Democracy, Economic Development and Construction Bill [HL] docx](https://media.store123doc.com/images/document/14/br/jt/medium_hdP4QOGe00.jpg)