Combined transcriptome and metabolome analyses to understand the dynamic responses of rice plants to attack by the rice stem borer Chilo suppressalis (Lepidoptera: Crambidae)
Bạn đang xem bản rút gọn của tài liệu. Xem và tải ngay bản đầy đủ của tài liệu tại đây (2.81 MB, 17 trang )
Liu et al. BMC Plant Biology (2016) 16:259
DOI 10.1186/s12870-016-0946-6
RESEARCH ARTICLE
Open Access
Combined transcriptome and metabolome
analyses to understand the dynamic
responses of rice plants to attack by the
rice stem borer Chilo suppressalis
(Lepidoptera: Crambidae)
Qingsong Liu1†, Xingyun Wang1†, Vered Tzin2, Jörg Romeis1,3, Yufa Peng1 and Yunhe Li1*
Abstract
Background: Rice (Oryza sativa L.), which is a staple food for more than half of the world’s population, is frequently
attacked by herbivorous insects, including the rice stem borer, Chilo suppressalis. C. suppressalis substantially reduces
rice yields in temperate regions of Asia, but little is known about how rice plants defend themselves against this
herbivore at molecular and biochemical level.
Results: In the current study, we combined next-generation RNA sequencing and metabolomics techniques to
investigate the changes in gene expression and in metabolic processes in rice plants that had been continuously
fed by C. suppressalis larvae for different durations (0, 24, 48, 72, and 96 h). Furthermore, the data were validated
using quantitative real-time PCR. There were 4,729 genes and 151 metabolites differently regulated when rice
plants were damaged by C. suppressalis larvae. Further analyses showed that defense-related phytohormones,
transcript factors, shikimate-mediated and terpenoid-related secondary metabolism were activated, whereas the
growth-related counterparts were suppressed by C. suppressalis feeding. The activated defense was fueled by
catabolism of energy storage compounds such as monosaccharides, which meanwhile resulted in the increased
levels of metabolites that were involved in rice plant defense response. Comparable analyses showed a
correspondence between transcript patterns and metabolite profiles.
Conclusion: The current findings greatly enhance our understanding of the mechanisms of induced defense
response in rice plants against C. suppressalis infestation at molecular and biochemical levels, and will provide clues
for development of insect-resistant rice varieties.
Keywords: Oryza sativa, Induced response, Next generation sequencing, Plant-insect interactions, Phytohormones,
Phenylpropanoids, Carbohydrates, Amino acids, Terpenoids
Background
To protect against attack by herbivorous insects, plants
have evolved both constitutive and induced defense
mechanisms [1]. Induced defenses include both direct
and indirect responses, which are activated by herbivore
* Correspondence:
†
Equal contributors
1
State Key Laboratory for Biology of Plant Diseases and Insect Pests, Institute
of Plant Protection, Chinese Academy of Agricultural Sciences, Beijing, China
Full list of author information is available at the end of the article
feeding, crawling, frass, or oviposition [2]. Induced direct
responses involve the production of secondary metabolites and insecticidal proteins, which can reduce herbivore
development and survival [1, 3]. While induced indirect
responses mainly involve the release of volatile chemicals
that can attract natural enemies of herbivores [1, 3, 4].
Plant response against herbivory are associated with
large-scale changes in gene expression and metabolism
[5–9]. The integration of modern omics technologies
such as transcriptomics, proteomics, and metabolics
© The Author(s). 2016 Open Access This article is distributed under the terms of the Creative Commons Attribution 4.0
International License ( which permits unrestricted use, distribution, and
reproduction in any medium, provided you give appropriate credit to the original author(s) and the source, provide a link to
the Creative Commons license, and indicate if changes were made. The Creative Commons Public Domain Dedication waiver
( applies to the data made available in this article, unless otherwise stated.
Liu et al. BMC Plant Biology (2016) 16:259
provides a great opportunity for a deeper understanding
of the mechanisms of plant defence responses to herbivore feeding at molecular and cellular levels [7, 9–11].
Previous results have suggested that plant response to
herbivore feeding is a dynamic process, and that the
transcript patterns, protein and metabolite profiles are
temporally and spatially regulated [1, 10, 12]. This suggests that it is essential to investigate the dynamic at transcriptional, proteomic and metabolic changes associated
to insect feeding [6, 7, 9, 11]. Transcriptomic and proteomic studies are only able to predict changes in gene
expression and the protein level, while metabolomic
studies investigate the changed functions exerted by
these genes or proteins. Therefore, the integration of
transcriptomic, proteomic, and metabolic approaches
can gain a better understanding of plant responses to
herbivore feeding [10].
Rice (Oryza sativa L.) is the staple food for more than
half of the world’s population [13], but rice yield is
frequently reduced by herbivorous insects [14]. Lepidopteran stem borers are chronic pests in all rice
ecosystems, and the rice stem borer Chilo suppressalis
is among the most serious rice pest in temperate
regions of Asia [15]. C. suppressalis is particularly
damaging in China because of the wide adoption of
hybrid varieties. A better understanding of the genetic
and molecular mechanisms underlying rice plant defense
against insect pests is important for developing resistant
rice varieties and other strategies for controlling pests
[14]. The genetic basis of rice defense against piercingsucking planthoppers has been well elucidated, and several
gene functions have been identified [16–19]. For example,
Liu et al. [16] identified several lectin receptor kinase
genes that confer durable resistance to the brown
planthopper Nilaparvata lugens and the white back
planthopper Sogatella furcifera. However, the defense
response of rice plants to chewing insects, such as
lepidopteran larvae, has rarely been studied, although
a few studies have been conducted using microarray
technology, in which a relatively small number of differentially expressed genes were identified [8, 20, 21].
In addition, the previous experiments were conducted
with rice samples collected at only one time point
after C. suppressalis infestation, and the data did not
therefore reveal the dynamic response of rice plants
to C. suppressalis feeding at transcriptional and metabolic levels.
In the current study, we combined transcriptome
and metabolome analyses to investigate the dynamic
responses of rice plants to attack by C. suppressalis,
with the expectation to provide a better understanding of rice defense mechanisms to C. suppressalis
infestation and clues for the development of rice pest
control strategies.
Page 2 of 17
Methods
Plants and growing conditions
The rice cultivar Minghui 63, an elite indica restorer line
for cytoplasmic male sterility in China, was used in this
study. Seeds were incubated in water for 2 day and sown
in a seedling bed in a greenhouse (27 ± 3 °C, 65 ± 10% RH,
16 L: 8 D). Fifteen-day-old seedlings were individually
transplanted into plastic pots (630 cm3) containing a mixture of peat and vermiculite (3:1). Plants were watered daily
and supplied with 10 ml of nitrogenous fertilizer every
week. Plants were used for the experiments four weeks
after transplanting.
Insect colony
Specimens of C. suppressalis were retrieved from a
laboratory colony that had been maintained on an
artificial diet for over 60 generations with annual introductions of field-collected individuals. The colony was
maintained at 27 ± 1 °C with 75 ± 5% RH and a 16 L : 8 D
photoperiod [22].
Insect bioassay
Potted rice plants were transferred to a climate control
chamber (27 ± 1 °C, 75 ± 5% RH, 16 L : 8 D photoperiod)
for 24 h and were then infested with three 3rd-instar C.
suppressalis per plant. The larvae had been starved for 2 h
before they were caged with the rice plants. The main rice
stems, 4 cm above the area damaged by the larvae, were
harvested after they had been exposed to C. suppressalis
feeding for 0 (healthy, control rice plants), 24, 48, 72, and
96 h. Plant samples were immediately frozen in liquid
nitrogen and stored at −80 °C for later analyses. Four
samples (replicates) were collected at each of the following
time points and were used for transcriptome analysis: 0,
24, 48, and 72 h. Ten samples were collected at each of
the following time points and were used for metabolome
analyses: 0, 48, 72, and 96 h. The sampling time points
differed for the transcriptome and metabolome analyses
because the rice plants were expected to respond faster to
insect feeding on the transcriptomic level than on the
metabolomic level [1, 10].
Transcriptome analysis
RNA extraction
The total RNA from the rice stem samples was
isolated using TRIzol reagent (Invitrogen, Carlsbad,
CA, USA) according to the manufacturer’s instructions. RNA quality was checked with a 2200 Bioanalyzer
(Agilent Technologies, Inc., Santa Clara, CA, USA). The
assessment showed that the RNA integrity number (RIN)
of all samples was > 9.7.
Liu et al. BMC Plant Biology (2016) 16:259
Library preparation and RNA-sequencing
The sequencing library of each RNA sample was prepared
using Ion Total RNA-sequencing (RNA-Seq) Kit v2 (Life
Technologies, Carlsbad, CA, USA) according to the
manufacturer’s protocols. In brief, mRNA was purified
from 5 μg of total RNA from each sample with oligo
(dT) magnetic beads and was fragmented using RNase
III (Invitrogen, Carlsbad, CA, USA). The fragmented
mRNA was hybridized and ligated with Ion adaptor.
The first-strand cDNA strand was synthesized using
reverse transcription of random primers, which was
followed by second-strand cDNA synthesis using DNA
polymerase I and RNase H (Invitrogen, Carlsbad, CA,
USA). The resulting cDNA fragments underwent an
end repair process followed by phosphorylation and
then ligation of adapters. These products were subsequently purified and amplified by PCR to create cDNA
libraries. The cDNA libraries were processed and
enriched on a OneTouch 2 instrument using Ion PI™
Template OT2 200 Kit (Life Technologies, Carlsbad,
CA, USA) to prepare the Template-Positive Ion PI™ Ion
Sphere™ Particles. After enrichment, the mixed Template-Positive Ion PI™ Ion Sphere™ Particles were finally loaded on the Ion PI™ Chip and sequenced
using the Ion PI™ Sequencing 200 Kit (Life Technologies, Carlsbad, CA, USA). Bioinformatics data analyses
of the RNA-seq libraries were performed by Shanghai
Novelbio Ltd. as previously described [23].
Quantitative real-time PCR
The plant tissue samples for quantitative real-time PCR
(qPCR) were collected from different plants of the same
batch of rice plants that were sampled for RNA-seq
experiments. In brief, 500 ng of total RNA was reverse
transcribed using a first-strand cDNA synthesis kit
(Promega, Madison, WI, USA), digested with DNase I
(Thermo Fisher Scientific, Waltham, MA, USA), and
then diluted 50X. The qPCR reaction was performed
using SYBR Premix Ex Taq Ready Mix with POX reference dye (Takara Biotech, Kyoto, Japan) and an ABI 7500
Real-time PCR Detection System instrument (Applied
Biosystems Foster City, CA, USA). The thermocycler setting was as follows: 30 s at 95 °C, followed by 40 cycles of
5 s at 95 °C and 34 s at 60 °C. To confirm the formation
of single peaks and to exclude the possibility of primerdimer and non-specific product formation, a melt curve
(15 s at 95 °C, 60 s at 60 °C, and 15 s at 95 °C) was generated by the end of each PCR reaction. Primer pairs were
designed using Beacon Designer software (Premier Biosoft,
version 7.0) and are listed in Additional file 1: Table S1.
The relative fold-changes of gene expression were calculated using the comparative 2−ΔΔCT method [24] and were
normalized to the housekeeping gene ubiquitin 5 [25]. All
Page 3 of 17
qPCR reactions were repeated in three biological and four
technical replications.
Analyses of differentially expressed genes (DEGs)
RNA-seq read quality values were checked using FASTQC ( />fastqc/). The reads were mapped to the reference rice
genome of the Michigan State University (MSU) Rice
Genome Annotation Project database (RGAP, V7.0)
( [26] using MapSplice
software [27]. The DEGSeq algorithm [28] was used to
filter DEGs. Reads per kilobase of exon model per million
mapped reads (RPKM) were used to explore the expression levels of the DEGs [29], and an upper quartile algorithm was applied for data correction. False discovery rate
(FDR) was used for the correction of data occur in
multiple significant tests [30]. Genes whose expression
differed by at least two-fold (log2(fold change) > 1 or < −1,
FDR < 0.05) were regarded as DEGs as determined with
the R statistical programming environment (). The DEGs in rice plants that had been fed by
caterpillars for 24, 48, or 72 h were, respectively, compared to those that had never been fed using MapMan
software to get an overview of the metabolism [31]. Venn
diagrams were generated using these DEGs to identify
common and unique genes affected by C. suppressalis
among different time points [32]. Time Series-Cluster
analysis, based on the Short Time-series Expression Miner
(STEM) method ( />[33], was used to identify the global trends and similar temporal model patterns of the expression of the total DEGs.
Phytohormone signature analyses
Hormonometer program analyses [34] (http://hormono
meter.weizmann.ac.il/) was used to assess the similarity
of the expression of rice genes induced by C. suppressalis
with indexed data sets of those elicited by exogenous
application of phytohormones to Arabidopsis as previously described [7]. The rice genes were blasted to the
Arabidopsis thaliana genome. The Arabidopsis gene
identifies (AGI) were converted to Arabidopsis probe set
identifies using the g:Convert Gene ID Converter tool [35]
( Only genes included in RNA-seq containing Arabidopsis probe set identifies were kept for analyses. In some cases, there were
two probe sets for one AGI, while in few cases there were
two AGIs for one probe set. This indicates that lines were
duplicated and sets were thus discarded.
Gene ontology (GO) and pathway enrichment analyses
DEGs belonging to different classes were retrieved for GO
and pathway analysis. GO analysis was conducted using
the GSEABase (gene set enrichment analysis base) package from BioConductor ( />
Liu et al. BMC Plant Biology (2016) 16:259
based on biological process categories (Fisher’s exact
test, FDR < 0.001). Pathway analyses were conducted to
elucidate significant pathways of DEGs according to the
Kyoto Encyclopedia of Gene and Genomes (KEGG)
( databases. Fisher’s exact
test followed by Benjamini-Hochberg multiple testing
correction was applied to identify significant pathways
(P < 0.05).
Metabolome analyses
Samples were prepared using the automated Microlab
STAR® system (Hamilton Company, Bonaduz, Switzerland)
and were analyzed using ultrahigh performance liquid
chromatography-tandem mass spectroscopy (UHPLC-MS)
and gas chromatography–mass spectrometry (GC-MS)
platforms by Metabolon Inc. (Durham, North Carolina,
USA). These platforms have been previously described [36,
37]. In brief, a recovery standard was added before the first
step in the extraction process for quality control purposes.
Protein fractions of the samples were removed by serial extractions with methanol. The samples were subsequently
concentrated on a Zymark TurboVap® system (KcKinley
Scientific, Sparta, NJ, USA) to remove the organic solvent
and then were vacuum dried. The resulting samples were
divided into five fractions, and they were used for analyis
by: i) UHPLC-MS with positive ion mode electrospray
ionization, ii) UHPLC-MS with negative ion mode electrospray ionization, iii) UHPLC-MS polar platform (negative
ionization), iv) GC-MS, and v) for being reserved for
backup, respectively. Before the UHPLC-MS analysis, the
subsamples were stored overnight under nitrogen. For GCMS analysis, each sample was dried under vacuum overnight. UHPLC-MS and GC-MS analyses of all samples
were carried out in collaboration with Metabolon Inc. as
previous described [36, 37].
For statistical analysis, missing values were assumed to
be below the limits of detection, and these values were
inputted with a minimum compound value [37]. The
relative abundances of each metabolite was log transformed before analysis to meet normality. Dunnett’s
test was used to compare the abundance of each
metabolite between different time points. Statistical
analyses were performed using the SPSS 22.0 software
package (IBM SPSS, Somers, NY, USA).
Results
Global transcriptome changes in rice plants during Chilo
suppressalis infestation
A total of 16 libraries (four biological replicates of four
sampling times) were conducted, resulting in approximately 29–41 million clean reads; GC content accounted
for 48–53% of these reads (Additional file 2: Table S2).
The average number of reads that mapped to the rice
reference genome was > 87%, and unique mapping rates
Page 4 of 17
ranged from 73 to 87% (Additional file 2: Table S2). The
unique matching reads were used for further analysis.
Gene structure analysis showed that most of the mapped
reads (61–73%) were distributed in exons (Additional file 3:
Table S3). RNA-seq data were normalized to RPKM values
to quantify transcript expression. In total, 42,100 genes
were detected in all samples (Additional file 4: Table S4).
Only significantly changed genes with P < 0.05 (FDR) and
fold-change > 2 or < 0.05 were considered to be differentially expressed genes (DEGs), resulting in a total of 4,729
DEGs at a minimum of two time points (Fig. 1, Additional
file 5: Table S5 and Additional file 6: Table S6). A comparison of DEGs at the different time points relative to the control (24 h vs. 0 h, 48 h vs. 0 h, and 72 h vs. 0 h) revealed
over one thousand genes with significantly altered
expression levels, with more genes being up-regulated
than down-regulated (Fig. 1a). MapMan analyses
showed that the up-regulated DEGs in rice plants
between different time-point (24, 48, or 72 h) and the
control (0 h) were mainly involved in cell wall, lipid
and secondary metabolism. While the down-regulated
DEGs mainly involved in light reactions (Additional
file 7: Figure S1). A Venn Diagram of this data set
indicated that 1,037 genes were differently expressed
at all 3 time points of 24, 48, and 72 h relative to 0 h
(Fig. 1b). However, much lower number of DEGs detected
between the time points of 24 h vs. 48 h, 24 h vs. 72 h, or
48 h vs. 72 h and there was no commonality of the DEGs
occurred between two of three time points (Fig. 1a, c).
The expression patterns of selected genes were
confirmed by qPCR using the rice stem samples from
the same batch of rice plants that were used for
RNA-seq. A total of 20 genes were selected related to
the signaling of phytohormones, primary metabolism,
and secondary metabolism. The expression profiles of
most genes tested by qPCR were consistent with
those analyzed by RNA-seq although only one housekeeping gene was used in qPCR analysis (Fig. 2),
which indicated the validation of the results from our
transcriptome experiment.
Series-cluster and enrichment analyses
To refine the sets of genes that were differently
expressed at a minimum of two time points, we used the
STEM method, which is commonly used for the cluster
of gene expression in transcriptomic studies [33]. The
4,729 DEGs were clustered into 26 possible model
profiles (Fig. 3; Additional file 6: Table S6). Based on
the expression dynamics of these DEGs, their expression
patterns were assigned to five classes (Additional file 6:
Table S6). Class I included 2,122 genes that showed a
trend of up-regulated expression during the 72-h of larval
feeding. Class II contained 1,318 genes showing a trend of
down-regulated expression. Class III contained 873 genes
Liu et al. BMC Plant Biology (2016) 16:259
Page 5 of 17
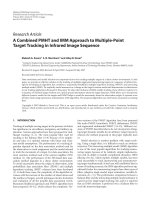
Fig. 1 Expression dynamics and comparative analyses of differentially expressed genes (DEGs) in rice plants damaged by Chilo suppressalis at different
time points. a Bar graph of up- and down-regulated genes from pairwise comparisons (fold-change > 2 or < 0.5, and FDR < 0.05). b, c Veen diagram
showing the common and uniquely regulated DEGs among different time points vs. control plants (0 h) (b) and among different time points (c)
that were up-regulated at early stage, but down-regulated
at later stage. Class IV included 222 genes that were
down-regulated at early stage but up-regulated at late
stage. Class V contained the remaining 194 genes with irregular expression profile. GO analyses indicated that the
number of significant GO terms with biological process
categories in the five classes were 85, 47, 48, 2, and 5, respectively (Additional file 8: Table S7). This indicates that
most DEGs involved in the response to C. suppressalis
damage contained in the first three classes. More details
of the GO analyses for these DEGs are provided in
Additional file 8: Table S7. Pathway enrichment analyses
showed that genes in class I are mainly related to pathways of biosynthesis of plant secondary metabolites, plant
hormone signal transduction, nitrogen metabolism, galactose, and terpenoid (Table 1). Genes in class II are mainly
involved in primary metabolism such as nucleotide metabolism and photosynthesis, which may indicate the repressed activity of photosynthesis and the increased
catabolism of nucleic acids. Genes in class III are mainly
involved in pathways of biosynthesis of secondary metabolites including glucosinolate and phenylpropanoids and
the metabolism of carbohydrates such as galactose, fructose, and mannose. The genes in class IV are mainly related to the metabolism of starch and sucrose, and to the
biosynthesis of photosynthesis-antenna proteins, flavone,
and flavonol. The genes in class V are mostly involved in
secondary metabolism.
Phytohormone-related DEGs
A total of 9,221 Arabidopsis orthologs of rice genes were
included in the Hormonometer analyses (Additional
file 9: Table S8). Changes in gene expression induced
by C. suppressalis in rice were positively correlated
with those induced by SA (salicylic acid), JA (jasmonic
acid), ABA (abscisic acid), and auxin treatments in
Arabidopsis (Fig. 4). The changes in gene expression
were negatively correlated with genes associated with
cytokinin (CTK) signatures. These patterns were generally supported by GO analyses of the five classes
(Additional file 8: Table S7).
Transcription factors (TFs)-related DEGs
Given the important regulatory function of TFs, we analyzed TFs-encoding genes by conducting a search of the
Plant Transcription Factor Database (PlnTFDB,V3.0)
( [38]. We identified 385 TFs distributed in 39 families among the 4,729
DEGs (Additional file 10: Table S9). These TFs mainly
include the following families: AP2-EREBP (apetala2ethylene-responsive element binding proteins) (50 genes),
WRKY (37 genes), bHLH (basic helix-loop-helix) (27
Liu et al. BMC Plant Biology (2016) 16:259
Page 6 of 17
Fig. 2 Comparison of mRNA expression levels detected by RNA-seq (solid triangles) and qPCR (solid squares) for 20 selected genes. All qPCR data were
normalized against the housekeeping gene ubiquitin 5. Values are means ± SE; n = 4 for RNA-seq and n = 3 for qRT-PCR. ZEP, zeaxanthin epoxidase;
ADT/PDT, arogenate/prephenate dehydratase; PAL, phenylalanine ammonia-lyase; 4CL, 4-coumarate-CoA ligase; GDH, glutamate dehydrogenase; FBA,
fructose-bisphosphate aldolase, class I; GAD, glutamate decarboxylase; PAO, polyamine oxidase; HMGR, hydroxymethylglutaryl-CoA reductase; DXR,
1-deoxy-D-xylulose 5-phosphate reductoisomerase; HDS, 4-hydroxy-3-methylbut-2-enyl diphosphate synthase; GST, glutathione S-transferase; PS,
phytoene synthase; PP, phosphatase; CAD, cinnamyl-alcohol dehydrogenase; AOC, allene oxide cyclase; JAZ, jasmonate ZIM domain-containing protein;
and TGA, TGACGTCA cis-element-binding protein
genes), MYB (myeloblastosis) (22 genes), NAC (NAM,
ATAF1-2, and CUC2) (20 genes), Orphans (17 genes), HB
(hunchback) (15 genes), MYB-related (13 genes), and
bZIP (basic region/leucine zipper motif) (13 genes). Most
of the genes belonging to AP2-EREBP, WRKY, MYB,
bHLH, MYB-related, and NAC families are in class I. Half
of the identified TFs from orphans and bZIP families are
in class II. More details of the expression profiles of the
identified TFs are provided in Additional file 10: Table S9.
Metabolome composition analyses
A total of 151 known metabolites were detected and
quantified in rice plants during the 96 h of larval feeding
(Additional file 11: Table S10). By mapping the general
biochemical pathways based on KEGG and plant metabolic network (PMN), we divided the metabolites into
seven classes, of which amino acids were the most prevalent (33% of the metabolites), followed by carbohydrates
(29%) (Additional file 12: Figure S2). The secondary metabolites accounted for 7% (Additional file 11: Table S10;
Additional file 12: Figure S2).
Integrated analyses of the transcriptomic and metabolic
data sets
Biosynthesis of aromatic amino acids, salicylic acid, and
phenylpropanoids
The shikimate pathway is a major pathway in plants and
is responsible for the biosynthesis of the aromatic amino
acids Phe, Tyr, and Trp, as well as of auxin, SA, lignin,
and phenylpropanoid [39]. Integration of the transcriptomic and metabolic data revealed that transcriptional
up-regulation of the genes was accompanied by the elevation of the main metabolites in the pathways (Fig. 5;
Additional file 13: Table S11). For example, all of the
genes encoding the crucial enzymes in the shikimate
pathway that accumulated throughout the 72 h of larval
feeding belong to class I containing up-regulated DEGs
(Fig. 5).
Chilo suppressalis-induced changes in carbohydrate
metabolism
As products of photosynthesis, carbohydrates are the main
source of stored energy in plants. Most DEGs involved in
Liu et al. BMC Plant Biology (2016) 16:259
Page 7 of 17
Fig. 3 Clustering and classification of 4,729 differentially expressed genes. The Roman numerals on the left indicate the class. The number in the
top left corner in each panel indicates the identification number (ID) of the 26 profiles that were identified, and the number in the bottom left corner of
each panel indicates the number of genes in the cluster
carbohydrate metabolism were up-regulated (Fig. 6b), with
an exception of the genes encoding trehalose 6-phosphate
synthase (TPS) and 4-alpha-glucanotransferase (AGLS).
Consistently, metabolic analysis showed that except for oligosaccharides and galactinol, all monosaccharides (orbitol,
galactitol, glucose, fructose, and xylose) increased over time
(Fig. 6c; Additional file 11: Table S10).
Effects of Chilo Suppressalis feeding on amino acids,
organic acids, and nitrogen metabolism
Our analyses showed that genes encoding enzymes such as
glutamate decarboxylase (GAD), N-carbamoylputrescine
amidase (CPA), ornithine decarboxylase (ODC), and Laspartate oxidase (LASPO) were up-regulated; while
those encoding adenylosuccinate lyase (ASL), and
delta-1-pyrroline-5-carboxylate synthetase (P5CS) were
down-regulated over time. As expected, the contents of
metabolites ornithine, gamma-aminobutyrate and putrescine increased, while the levels of aspartate and
spermidine decreased in rice plants during C. suppressalis feeding due to action of the enzymes mentioned
above (Fig. 7a, b). In addition, we also detected increased
levels of other amino acids such as Pro, Ala, and Asn
(Fig. 7c).
Chilo suppressalis-induced changes in terpenoid
metabolism
The analysis was focused on the genes that participate
in terpenoid metabolism (Fig. 8; Additional file 13:
Table S11). The four genes that encode the following
crucial enzymes in the methylerythritol phosphate
(MEP) pathway were up-regulated by C. suppressalis
feeding: 1-deoxy-D-xylulose 5-phosphate synthase
(DXS), 1-deoxy-D-xylulose 5-phosphate reductoisomerase (DXR), 4-diphosphocytidyl-2-C-methyl-D-erythritol kinase (MCT), and 4-hydroxy-3-methylbut-2-enyl
diphosphate synthase (HDS). In addition, the gene encoding hydroxymethylglutaryl-CoA reductase (HMGR) and
genes encoding geranyl diphosphate synthase (GPS),
farnesyl diphosphate synthase (FPS), and geranylgeranyl
diphosphate synthase (GGPS) were also up-regulated induced by C. suppressalis feeding. The expression of
several genes encoding enzymes in the diterpenoid biosynthesis and carotenoid biosynthesis pathways were
also altered by C. suppressalis feeding. Of these genes,
9-cis-epoxycarotenoid dioxygenase (NCED) were substantially up-regulated. In contrast, the genes encoding
GA 2-oxidase (GA2o) and zeaxanthin epoxidase (ZEP)
were down-regulated throughout the larval feeding
period.
Discussion
The current study describes the first effort to combine
transcriptomic and metabolic techniques for the comparative analyses of the genes and the metabolites involved in
rice plant responses to damage caused by C. suppressalis
larvae. The results increase our understanding of the
mechanisms underlying the dynamic responses of rice
plants to caterpillar feeding.
Gene expression analyses revealed that more DEGs
were up-regulated than down-regulated in response to
feeding by C. suppressalis larvae. This is consistent with
Liu et al. BMC Plant Biology (2016) 16:259
Page 8 of 17
Table 1 Summary of significantly enriched (P < 0.05) pathway terms associated with differentially expressed genes (DEGs)
Classa
Pathway ID
Pathway term
Number of DEGs
P value*
I
PATH:01110
Biosynthesis of secondary metabolites
136
2.03E-05
PATH:00940
Phenylpropanoid biosynthesis
37
4.43E-05
PATH:00910
Nitrogen metabolism
13
2.65E-04
PATH:00592
alpha-linolenic acid metabolism
13
3.56E-04
PATH:04075
Plant hormone signal transduction
33
3.64E-04
PATH:00062
Fatty acid elongation
11
1.09E-03
PATH:00945
Stilbenoid, diarylheptanoid, and gingerol biosynthesis
19
1.32E-03
PATH:00360
Phenylalanine metabolism
26
1.50E-03
PATH:01100
Metabolic pathways
180
1.98E-03
PATH:00941
Flavonoid biosynthesis
15
2.68E-03
PATH:04626
Plant-pathogen interaction
40
3.24E-03
PATH:00280
Valine, leucine and isoleucine degradation
10
3.70E-03
PATH:00052
Galactose metabolism
11
4.30E-03
PATH:00903
Limonene and pinene degradation
15
5.76E-03
PATH:00480
Glutathione metabolism
17
8.59E-03
PATH:00561
Glycerolipid metabolism
11
8.75E-03
PATH:00410
beta-alanine metabolism
7
2.00E-02
PATH:00900
Terpenoid backbone biosynthesis
9
2.43E-02
II
III
PATH:00760
Nicotinate and nicotinamide metabolism
4
4.37E-02
PATH:03008
Ribosome biogenesis in eukaryotes
31
2.77E-14
PATH:03010
Ribosome
41
1.40E-08
PATH:00196
Photosynthesis - antenna proteins
10
1.20E-07
PATH:00230
Purine metabolism
19
1.24E-03
PATH:00240
Pyrimidine metabolism
16
2.67E-03
PATH:03013
RNA transport
19
3.63E-03
PATH:03018
RNA degradation
13
8.68E-03
PATH:03410
Base excision repair
7
1.31E-02
PATH:03450
Non-homologous end-joining
3
1.74E-02
PATH:03440
Homologous recombination
7
3.87E-02
PATH:03020
RNA polymerase
6
4.08E-02
PATH:01110
Biosynthesis of secondary metabolites
89
2.05E-13
PATH:00940
Phenylpropanoid biosynthesis
26
2.69E-07
PATH:00010
Glycolysis/Gluconeogenesis
17
5.30E-06
PATH:00360
Phenylalanine metabolism
20
6.99E-06
PATH:00520
Amino sugar and nucleotide sugar metabolism
18
1.12E-05
PATH:00966
Glucosinolate biosynthesis
4
7.22E-04
PATH:00380
Tryptophan metabolism
7
1.19E-03
PATH:01100
Metabolic pathways
89
2.00E-03
PATH:00909
Sesquiterpenoid and triterpenoid biosynthesis
4
4.89E-03
PATH:00051
Fructose and mannose metabolism
7
8.44E-03
PATH:00904
Diterpenoid biosynthesis
5
8.62E-03
PATH:00052
Galactose metabolism
6
1.54E-02
PATH:00030
Pentose phosphate pathway
5
3.29E-02
PATH:00591
Linoleic acid metabolism
3
4.14E-02
Liu et al. BMC Plant Biology (2016) 16:259
Page 9 of 17
Table 1 Summary of significantly enriched (P < 0.05) pathway terms associated with differentially expressed genes (DEGs)
(Continued)
IV
V
PATH:00944
Flavone and flavonol biosynthesis
3
4.62E-02
PATH:00500
Starch and sucrose metabolism
6
2.24E-03
PATH:00196
Photosynthesis - antenna proteins
2
4.87E-03
PATH:00944
Flavone and flavonol biosynthesis
2
1.23E-02
PATH:01110
Biosynthesis of secondary metabolites
17
2.24E-03
PATH:01100
Metabolic pathways
22
4.03E-03
PATH:00940
Phenylpropanoid biosynthesis
6
6.04E-03
PATH:00500
Starch and sucrose metabolism
5
9.00E-03
PATH:00944
Flavone and flavonol biosynthesis
2
1.10E-02
PATH:00902
Monoterpenoid biosynthesis
1
2.00E-02
PATH:00941
Flavonoid biosynthesis
3
2.31E-02
PATH:00460
Cyanoamino acid metabolism
2
3.62E-02
PATH:01110
Biosynthesis of secondary metabolites
17
2.24E-03
a
Class numbers refer to Fig. 3
*P values for modified Fisher’s exact test
Fig. 4 Hormonometer analysis of differential gene expression in rice in response to Chilo suppressalis feeding. The response in gene expression in
rice to Chilo suppressalis feeding (for 0, 24, 48, or 72 h) treatments was compared with that of Arabidopsis at 30, 60, and 180 min, or 3, 6, and 9 h
after hormone application. Red shading indicates a positive correlation between the rice response to a C. suppressalis treatment and the Arabidopsis
response to a hormone treatment; blue shading indicates a negative correlation. MJ, methyl jasmonate; ACC, 1-aminocyclopropane-1-caroxylic acid
(a metabolic precursor of ethylene); ABA, abscisic acid; IAA, indole-3-acetic acid; GA3, gibberellic acid 3; BR, brassinosteroid; and SA, salicylic acid
Liu et al. BMC Plant Biology (2016) 16:259
Page 10 of 17
Fig. 5 Expression patterns of Chilo suppressalis-induced genes and metabolites involved in the biosynthesis of aromatic amino acids, salicylic acid,
and phenylpropanoid. a Pathway schematic. Uppercase letters indicate genes that encode enzymes. Metabolites shaded in green were measured.
Solid arrows represent established biosynthesis steps, while broken arrows indicate the involvement of multiple enzymatic reactions. SK, shikimate
kinase; CM, chorismate mutase; ADT, arogenate dehydratase; PDT, prephenate dehydratase; BGLU, beta-glucosidase; PRX, peroxidase; CCR,
cinnamoyl-CoA reductase; PAL, phenylalanine ammonia-lyase; C4H, cinnamic acid 4-hydroxylase; 4CL, 4-coumarate-CoA ligase; HST, shikimate Ohydroxycinnamoyltransferase. b Heatmap of relative expression levels of the genes involved in the schematic pathway. The heatmap was generated
from the RPKM data using MeV (V4.9.0). c Metabolite abundance after C. suppressalis infestation; values are means ± SE (n = 10). *, P < 0.05 by
Dunnett’s test relative to uninfested controls
previous findings concerning aphid-infested maize [7]
and maize that was mechanically wounded and then
treated with the oral secretions of Mythimna separata [9].
Similarly, more DEGs were up-regulated than downregulated when Arabidopsis plants were individually
infested with Myzus persicae, Brevicoryne brassicae, Spodoptera exigua, or Pieris rapae [40], or when cotton was
damaged by the chewing insects Helicoverpa armigera or
Anthonomus grandis [41]. However, there were also studies reporting that more DEGs were down-regulated than
up-regulated, or the numbers of up- and down-regulated
DEGs were equivalent when rice plants were damaged by
C. suppressalis [8] or the brown planthopper N. lugens
[42, 43], or when cotton plants were infested with the
whitefly Bemisia tabaci or the aphid Aphis gossypii [6, 44].
This variability might be explained by differences in herbivore species, plant species, plant tissues infested, the duration of infestation, and the techniques used for the
detection of gene expression [40].
As the key regulators of transcription, TFs are important in plant responses to herbivory [5, 8, 45–47]. In our
transcriptome analyses, we identified 385 TF genes that
responded to C. suppressalis feeding, suggesting that the
induced defense response is complex and involves a substantial change in rice metabolism. The TF families
whose expression was most altered by C. suppressalis
feeding were AP2-EREBP and WRKY. Evidence increasingly indicates that WRKYs play significant roles in plant
development and in responses to biotic and abiotic
stresses [5, 8, 45–47], and members of the AP2-EREBP
family mediate defense against biotic and/or abiotic
stress [45]. For example, it was recently found that
OsWRKY70 mediates the prioritization of defense over
growth by positively regulating cross-talk between JA
and SA when rice is attack by C. suppressalis [47], and
OsWRKY53 is a negative regulator of plant growth and
an early suppressor of induced defenses [46], both of
which belong to WRKY family. The function of TFs in
Liu et al. BMC Plant Biology (2016) 16:259
Page 11 of 17
Fig. 6 Expression patterns of Chilo suppressalis-induced genes and metabolites involved in typical carbohydrate metabolism. a Typical carbohydrate
metabolism pathway schematic. Uppercase letters are genes that encoded enzymes. Metabolites shaded in green were measured. Solid arrows
represent established biosynthesis steps, while broken arrows indicate the involvement of multiple enzymatic reactions. RFS, raffinose synthase; GAL,
alpha-galactosidase; BF, beta-fructofuranosidase; AGL, alpha-glucosidase; SUS, sucrose synthase; TREH, alpha, alpha-trehalase; PMI, mannose6-phosphate isomerase; TPS, trehalose 6-phosphate synthase; PFK, 6-phosphofructokinase 1; PFPA, pyrophosphate-fructose-6-phosphate
1-phosphotransferase; FBA, fructose-bisphosphate aldolase, class I; AGLS, 4-alpha-glucanotransferase. b Heatmap of relative expression
levels of the genes involved in the schematic pathway. The heatmap was generated from the RPKM data using MeV (V4.9.0). c Metabolite
abundance after C. suppressalis infestation; values are means ± SE (n = 10). *, P < 0.05 by Dunnett’s test relative to uninfested controls
the defense of rice against insects warrants further
research.
Phytohormones play important roles in a complex regulatory network that is essential for herbivore-induced response as previously reported [1, 4, 48] and as also
indicated by our Hormonometer analysis. Our results
showed that C. suppressalis elicited the expression of
genes associated with JA and SA, which is consistent with
a previous study [8]. In turn, exogenous application of
methyl JA or JA to rice plants reduced the performance of
two root herbivores, the cucumber beetle Diabrotica
balteata and the rice water weevil Lissorhoptrus oryzophilus [49], and induced the release of volatiles that attract
parasitoids [50]. SA, which is a central phytohormone in
the shikimate pathway, plays an importance role in the
defense against biotrophic pathogens and piercing/sucking
insects [1]. Our data showed that a number of rice SArelated genes were up-regulated by C. suppressalis larval
feeding (Fig. 5b). Although studies have reported that
crosstalk between JA and SA is negative in Arabidopsis
[51], and that JA-dependent defense may be hampered by
SA and vice versa [5, 19], our findings are consistent with
the evidence that SA and JA can have overlapping or even
synergistic effects in rice [8, 51].
We found that changes in gene expression induced by
C. suppressalis in rice were positively correlated with
changes induced by ABA treatment in Arabidopsis, which
agrees with previous results in several plant-insect systems
[5, 7, 9, 40, 44]. The role of ABA in regulating defense
against pathogens in rice has been well documented [51],
Liu et al. BMC Plant Biology (2016) 16:259
Page 12 of 17
Fig. 7 Expression patterns of Chilo suppressalis-induced genes and metabolites involved in the metabolism of amines and polyamines and amino
acids from the glutamate and aspartate family. a Pathway schematic of amino acid metabolism. Uppercase letters are genes that encoded
enzymes. Metabolites shaded in green were measured. Solid arrows represent established biosynthesis steps, while broken arrows indicate the
involvement of multiple enzymatic reactions. GDH, glutamate dehydrogenase; GAD, glutamate decarboxylase; GS, glutamate synthase; ODC,
ornithine decarboxylase; PAO, polyamine oxidase; CPA, N-carbamoylputrescine amidase; ASL, adenylosuccinate lyase; ADH, aldehyde dehydrogenase;
LASPO, L-aspartate oxidase; and P5CS, delta-1-pyrroline-5-carboxylate synthetase. GABA, gamma-Aminobutyric acid; GGS, L-glutamate gammasemialdehyde. b Heatmap of relative expression levels of the genes involved in the schematic pathway. The heatmap was generated from the RPKM
data using MeV (V4.9.0). c Metabolite abundance after C. suppressalis infestation; values are means ± SE (n = 10). *, P < 0.05 by Dunnett’s test relative to
uninfested controls
but its role in resistance to insects is much less understood. Our results suggest that ABA signature may also
play a vital role in rice defense against insect herbivores,
although researchers recently reported that applying ABA
to rice roots did not affect the performance of D. balteata
and L. oryzophilus [49]. We supposed that ABA may function in other ways in rice plant defense against herbivory,
but further studies are needed for clarifying this hypothesis. In contrast, we found a negative correlation between
CTK-induced and C. suppressalis-induced gene expression (Fig. 4). This negative correlation, which has been
also observed in other plant species [7, 34, 52], may reflect
the decrease in growth rate of rice plants caused by C.
suppressalis infestation.
Insect infestation causes many changes in both primary and secondary metabolism, and the reconfiguration of metabolism is a common defense strategy [11,
48, 53]. Our MapMan analyses and GO and pathway
enrichment analyses indicate that rice plants reprogram
both primary and secondary metabolism in response to
C. suppressalis feeding (Table 1; Additional file 7:
Figure S1 and Additional file 8: Table S7). Reductions
in photosynthesis, as indicated by down-regulation of
photosynthesis-related genes, is a common response to
Liu et al. BMC Plant Biology (2016) 16:259
Page 13 of 17
Fig. 8 Expression patterns of Chilo suppressalis-induced genes involved in terpenoid biosynthetic pathways. a Pathway schematic of terpenoid
metabolism. Uppercase letters are genes that encoded enzymes. Solid arrows represent established biosynthesis steps, while broken arrows
indicate the involvement of multiple enzymatic reactions. MVA, mevalonate; MEP, 2-C-methyl-D-erythritol 4-phosphate; HMG-CoA,
Hydroxymethylglutaryl-CoA; HMGR, HMG-CoA reductase; DMAPP, dimethylallyl pyrophosphate; IPP, isopentenyl pyrophosphate; IDI, IPP isomerase;
GAP, glyceraldehyde-3-phosphate; DXP, 1-deoxy-D-xylulose 5-phosphate; DXS, DXP synthase; DXR, 1-deoxy-D-xylulose 5-phosphate reductoisomerase; CDP-ME, 4-diphosphocytidyl-2-C-methyl-D-erythritol; MCT, 4-diphosphocytidyl-2-C-methyl-Derythritol synthase; CMK, 4-diphosphocytidyl-2-Cmethyl-D-erythritol kinase; CDP-ME-2P, 4-diphosphocytidyl-2-C-methyl-D-erythritol 2-phosphate; MEcPP, 2-C-methyl-D-erythritol 2,4-cyclodiphosphate; HDS, 4-hydroxy-3-methylbut-2-enyl diphosphate synthase; HMBPP, 4-hydroxy-3-methylbut-2-enyl diphosphate; GPP, geranyl diphosphate;
GPS, GPP synthase; FPP, farnesyl diphosphate; FPS, FPP synthase; GGPP, geranylgeranyl diphosphate; GGPS, GGPP synthase; CPP, copalyl diphosphate;
CPS, CPP synthase; KS, kaurene synthase; PMD, Pimara-8(14),15-diene; KH, Ent-isokaurene C2-hydroxylase; HDIK, ent-2-alpha-Hydroxyisokaurene; GA2o,
GA 2-oxidase; PSY, phytoene synthase; PS, phytoene synthase; ZEP, zeaxanthin epoxidase; VON, 9-cis-Violaxanthin; NON, 9′-cis-Neoxanthin; NCED,
9-cis-epoxycarotenoid dioxygenase; ABA, abscisic acid. b Heatmap of relative expression levels of the genes involved in the schematic
pathway. The heatmap was generated from the RPKM data using MeV (V4.9.0)
insect feeding [5, 8, 11, 40, 53] what was also confirmed in
the current study. The down-regulation of photosynthetic
genes accompanied by the up-regulation of defenserelated genes may allow rice plants to redirect resources
toward defense.
Photosynthesis is reduced in insect-attacked plants,
while plants require energy and carbon to produce
defense-related metabolites [11, 53]. Many plant species
respond to the damage by promoting the catabolism of
energy storage compounds, as can be reflected by the increased activity of invertase and the increased expression
of genes encoding enzymes that catalyze the degradation
of complex carbohydrates [11]; such changes were also evident in the current study. For example, we found that genes
encoding invertases such as alpha-glucosidase (AGL),
beta-fructofuranosidase (BF), and alpha-galactosidase
(GAL) were up-regulated in response to C. suppressalis
feeding. As a result, the contents of oligosaccharides,
raffinose, and galattinol declined while those of monosaccharides increased (Fig. 6c). As the major form of
nitrogen in plants, amino acids are the major growthlimiting nutrients for herbivores and are also precursors
for the production of defense-related metabolites. Amino
acids are therefore important in the interactions between plants and herbivores [11]. Our metabolic analyses showed that the contents of most amino acids
were increased by C. suppressalis feeding (Figs. 5 and 7
and Additional file 11: Table S10). Among these amino
acids, Tryptophan (Trp), for instance, was significantly
increased by C. suppressalis feeding (Fig. 5c). Trp can
Liu et al. BMC Plant Biology (2016) 16:259
serve as a precursor for defensive metabolites. Similar results were also reported by previous studies [40, 49]. Phe
is a precursor for shikimate-mediated biosynthesis of
phenylpropanoids [39]. Our results showed the increased phenylalanine ammonia-lyase (PAL) gene expression was accompanied by the elevated levels of Phe
over time. This was in consent with the previous study
by Liu et al. [54], in which both activated PAL gene expression and increased Phe levels were detected in rice
plants that had damaged by N. lugens. Another important
amino acid, gamma-aminobutyric acid (GABA) also increased in content at later stage when rice plants were fed
by C. suppressalis larvae. Similar results were found when
rice plants were fed by N. lugens [54]. Consistent results
were reported that feeding by S. littoralis larvae causes the
accumulation of GABA in leaves of Arabidopsis, and this
accumulation reduces insect feeding [55]. The role of
GABA in rice defense against herbivores requires further
investigation. Although herbivore-induced accumulation of amino acids can support the production of defensive metabolites, the accumulation of amino acids
might also benefit the herbivore [1, 7]. In support of
the latter inference, we observed that the rice brown
planthopper N. lugens was more attracted to rice plants
infested with C. suppressalis than to uninfested plants
(Wang et al., unpublished data).
In plants, secondary metabolites play an important role
in the defense response to insect feeding. Phenylpropanoids which are mainly biosynthesised through the shikimate pathway, have been widely reported to be induced
by insect feeding serving as direct resistance to herbivory
[5, 12]. In the current study, we found that genes involved
in the shikimate pathway such as shikimate kinase (SK),
chorismate mutase (CM), arogenate dehydratase (ADT),
prephenate dehydratase (PDT), phenylalanine ammonialyase (PAL), and cinnamic acid 4-hydroxylase (C4H) were
induced
and
phenylpropanoids
such
as
4hydroxycinnamate and ferulate were accumulated as a response to attack by C. suppressalis. These results suggest
that the shikimate-mediated secondary metabolism was
vitally important for rice defense against C. suppressalis
larval feeding. Terpenoids, which are the most common
group of secondary metabolites, can directly affect insect
performance or indirectly attract natural enemies of the
attacking herbivore [1, 4, 56, 57]. In plants, all terpenoids
are derived from the mevalonic acid (MVA) pathway and
the methylerythritol phosphate (MEP) pathway [58]. In
rice, infestation by chewing herbivores, such as C. suppressalis, S. frugiperda, or Cnaphalocrocis medinalis induces
the release of a complex of blend of volatiles that increase
the search efficiency of natural enemies [14]. In the
current work, the expression of HMGR, which is the critical regulator that catalyzes the conversion of HMG-CoA
to mevalonate in the MVA pathway [58], was up-
Page 14 of 17
regulated by C. suppressalis feeding. Farnesyl diphosphate
(FPP), geranyl diphosphate (GPP) and geranylgeranyl diphosphate (GGPP) are the main precursors in the biosynthesis of monoterpenes, sesquiterpenes and
triterpenes, and diterpenes [58]. Genes encoding enzymes that catalyze dimethylallyl pyrophosphate
(DMAPP)/isopentenyl pyrophosphate (IPP) into FPP
or GPP and that catalyze FPP to GGPP were also found
to be up-regulated in our study. Moreover, key genes involved in the diterpenoid and carotenoid pathways were
also activated by C. suppressalis feeding (Fig. 8). Previous studies have shown that rice plants damaged by C.
suppressalis for at least 24 h increased their release of
the terpenes as limonene, copaene, β-caryophyllene, αbergamotene, germacrene D, δ-selinene, and α-cedrene
[8, 57].
Conclusions
In summary, our integrated transcriptome and metabolome analyses generated a large data set concerning the
dynamic defense of rice plants induced by C. suppressalis
attack. The defense responses involved primary metabolisms, including photosynthesis, amino acid metabolism,
and carbohydrate metabolism, and secondary metabolisms, including the biosynthesis of phenylpropanoids and
terpenoids. The genes and metabolic networks identified
in this study provide new insights into rice defense mechanisms and the current findings will provide clues for the
development of insect-resistant rice cultivars as has for example been reported for soybeans with resistance to nematodes [59–61].
Additional files
Additional file 1: Table S1. Genes and primer pairs used for quantitative
real-time PCR. (XLS 34 kb)
Additional file 2: Table S2. Summary of RNA sequencing and mapping
using the rice genome (Oryza sativa) as reference. (XLS 29 kb)
Additional file 3: Table S3. Summary of gene structures. (XLS 31 kb)
Additional file 4: Table S4. Genes detected in all samples. (XLS 14574 kb)
Additional file 5: Table S5. All differentially expressed genes between
any two groups. (XLS 1102 kb)
Additional file 6: Table S6. Five classes of the differentially expressed
genes. (XLS 342 kb)
Additional file :7 Figure S1. Comparisons of metabolic changes in rice
plants that had been fed by Chilo suppressalis larvae for different durations.
(a) 24 h vs 0 h. (b) 48 h vs 0 h. (C) 72 h vs 0 h. The colour intensity indicates
the expression ratio at logarithmic scale (red: up-regulated, blue: downregulated). (TIF 1806 kb)
Additional file 8: Table S7. Significant (FDR < 0.01) GO terms
(biological processes) associated with the grouped DEGs. (XLS 54 kb)
Additional file 9: Table S8. Orthologous Arabidopsis and rice genes
used for Hormonometer analysis. (XLS 2918 kb)
Additional file 10: Table S9. The list of Chilo suppressalis-responsive
transcription factors (TFs). (XLS 61 kb)
Liu et al. BMC Plant Biology (2016) 16:259
Additional file 11: Table S10. Metabolic profiles for Chilo Suppressalis
damaged rice plants (0, 48, 72 and 96 h after infection). (XLS 103 kb)
Additional file 12: Figure S2. Functional categorization of 151 rice
metabolites across the four time points. (TIF 377 kb)
Additional file 13: Table S11. Genes derived from RNA-seq involved in
metabolism based on KEGG pathway maps. (XLS 33 kb)
Abbreviations
4CL: 4-coumarate-CoA ligase; ABA: Abscisic acid; ACC: 1-aminocyclopropane1-caroxylic acid (a metabolic precursor of ethylene); ADH: Aldehyde
dehydrogenase; ADT/PDT: Arogenate/prephenate dehydratase;
AGI: Arabidopsis gene identifies; AGL: Asalpha-glucosidase; AGLS: 4-alphaglucanotransferase; AOC: Allene oxide cyclase; AP2-EREBP: Apetala2-ethyleneresponsive element binding proteins; ASL: Adenylosuccinate lyase; BF: Betafructofuranosidase; BGLU: Beta-glucosidase; bHLH: Basic helix-loop-helix;
BR: Brassinosteroid; bZIP: Basic region/leucine zipper motif; C4H: Cinnamic
acid 4-hydroxylase; CAD: Cinnamyl-alcohol dehydrogenase; CCR: CinnamoylCoA reductase; CDP-ME: 4-diphosphocytidyl-2-C-methyl-D-erythritol; CDPME-2P: 4-diphosphocytidyl-2-C-methyl-D-erythritol 2-phosphate;
CM: Chorismate mutase; CMK: 4-diphosphocytidyl-2-C-methyl-D-erythritol
kinase; CPA: N-carbamoylputrescine amidase; CPP: Copalyl diphosphate;
CPS: CPP synthase; CTK: Cytokinin; DEG: Differentially expressed genes;
DMAPP: Catalyze dimethylallyl pyrophosphate; DXP: 1-deoxy-D-xylulose 5phosphate; DXR: 1-deoxy-d-xylulose 5-phosphate reductoisomerase; DXS: 1deoxy-d-xylulose 5-phosphate synthase; FBA: Fructose-bisphosphate aldolase,
class I; FDR: False discovery rate; FPP: Farnesyl diphosphate; FPS: Farnesyl
diphosphate synthase; GA2o: GA 2-oxidase; GA3: Gibberellic acid 3;
GABA: Gamma-aminobutyric acid; GAD: Glutamate decarboxylase;
GAL: Andalpha-galactosidase; GAP: Glyceraldehyde-3-phosphate; GC-MS: Gas
chromatography–mass spectrometry; GDH: Glutamate dehydrogenase;
GGPP: Geranylgeranyl diphosphate; GGPS: Geranylgeranyl diphosphate
synthase; GGS: L-glutamate gamma-semialdehyde; GO: Gene ontology;
GPP: Geranyl diphosphate; GPS: Geranyl diphosphate synthase; GS: Glutamate
synthase; GSEABase: Gene set enrichment analysis base; GST: Glutathione Stransferase; HB: Hunchback; HDIK: Ent-2-alpha-Hydroxyisokaurene; HDS: 4hydroxy-3-methylbut-2-enyl diphosphate synthase; HMBPP: 4-hydroxy-3methylbut-2-enyl diphosphate; HMG-CoA: Hydroxymethylglutaryl-Coenzyme
A; HMGR: Hydroxymethylglutaryl- CoA reductase; HST: Shikimate Ohydroxycinnamoyltransferase; IAA: Indole-3-acetic acid; IDI: IPP isomerase;
IPP: Isopentenyl pyrophosphate; JA: Jasmonic acid; JAZ: Jasmonate ZIM
domain-containing protein; KEGG: Kyoto encyclopedia of gene and
genomes; KH: Ent-isokaurene C2-hydroxylase; KS: Kaurene synthase; LASPO: laspartate oxidase; MCT: 4-diphosphocytidyl-2-c-methyl-d-erythritol kinase;
MEcPP: 2-C-methyl-D-erythritol 2,4-cyclodiphosphate; MEP: Methylerythritol
phosphate; MEP: Methylerythritol phosphate; MJ: Methyl jasmonate;
MVA: Mevalonicacid; NAC: An acronym for NAM, ATAF1-2, and CUC2;
NCED: 9-cis-epoxycarotenoid dioxygenase; NON: 9′-cis-Neoxanthin;
ODC: Ornithine decarboxylase; P5CS: Delta-1-pyrroline-5-carboxylate
synthetase; PAL: Phenylalanine ammonia-lyase; PAO: Polyamine oxidase;
PDT: Prephenate dehydratase; PFK: 6-phosphofructokinase 1;
PFPA: Pyrophosphate-fructose-6-phosphate 1-phosphotransferase;
PlnTFDB: Plant transcription factor database; PMD: Pimara-8(14), 15-diene;
PMI: Mannose-6-phosphate isomerase; PP: Phosphatase; PRX: Peroxidase;
PS: Phytoene synthase; PSY: Phytoene synthase; qPCR: Quantitative real-time
PCR; RFS: Raffinose synthase; RNA-Seq: RNA-sequencing; RPKM: Reads per
kilobase of exon model per million mapped reads; SA: Salicylic acid;
SK: Shikimate kinase; STEM: Short time-series expression miner; SUS: Sucrose
synthase; TFs: Transcription factors; TGA: TGACGTCA cis-element-binding
protein; TPS: Trehalose 6-phosphate synthase; TREH: Alpha, alpha-trehalase;
UHPLC-MS: Ultrahigh performance liquid chromatography-tandem mass
spectroscopy; VON: 9-cis-Violaxanthin; ZEP: Zeaxanthin epoxidase
Acknowledgments
We thank Pengwei Hou and Dai Chen from Novel Bioinformatics Ltd., Co. for
their technical assistance in bioinformatics analysis.
Funding
This work was supported by the National Natural Science Foundation of
China (grant no. 31272041).
Page 15 of 17
Availability of data and materials
The data sets supporting the results of this article are included within the
article and its additional files.
Authors’ contributions
YL, QL, and XW designed the study. QL and XW performed all the
experiments. QL, XW, VT, JR, YP, and YL analyzed the data and wrote the
manuscript. YP and YL provided experimental materials. All authors have
read and approved the manuscript for publication.
Competing interests
The authors declare that they have no competing interests.
Consent for publication
Not applicable.
Ethics approval and consent to participate
Rice seeds used in this study were kindly provided by Prof. Yongjun Lin
(Huazhong Agricultural University, Wuhan, China). Since the plant material
was not collected from a wild source, no any permissions/permits were
necessary. Larvae of C. suppressalis used in this study were retrieved from a
laboratory colony that was maintained in our own laborartoy, and so far no
any guildelines were adhered to for keeping the insects since they are
common insect pests in rice fields.
Author details
1
State Key Laboratory for Biology of Plant Diseases and Insect Pests, Institute
of Plant Protection, Chinese Academy of Agricultural Sciences, Beijing, China.
2
The French Associates Institute for Agriculture and Biotechnology of
Drylands, The Jacob Blaustein Institute for Desert Research, Ben-Gurion
University of the Negev, Sede Boqer, Israel. 3Agroscope, Biosafety Research
Group, Zurich, Switzerland.
Received: 26 July 2016 Accepted: 23 November 2016
References
1. Stam JM, Kroes A, Li Y, Gols R, van Loon JJ, Poelman EH, Dicke M. Plant
interactions with multiple insect herbivores: from community to genes.
Annu Rev Plant Biol. 2014;65(1):689–713.
2. Ray S, Gaffor I, Acevedo FE, Helms A, Chuang W, Tooker J, Felton GW, Luthe
DS. Maize plants recognize herbivore-associated cues from caterpillar frass. J
Chem Ecol. 2015;41(9):781–92.
3. Howe GA, Jander G. Plant immunity to insect herbivores. Annu Rev Plant
Biol. 2008;59:41–66.
4. Dicke M, Baldwin IT. The evolutionary context for herbivore-induced plant
volatiles: beyond the ‘cry for help’. Trends Plant Sci. 2010;15(3):167–75.
5. Huang X, Chen J, Xiao H, Xiao Y, Wu J, Wu J, Zhou J, Zhang Y, Guo Y. Dynamic
transcriptome analysis and volatile profiling of Gossypium hirsutum in response
to the cotton bollworm Helicoverpa armigera. Sci Rep. 2015;5:11867.
6. Li J, Zhu L, Hull JJ, Liang S, Daniell H, Jin S, Zhang X. Transcriptome analysis
reveals a comprehensive insect resistance response mechanism in cotton to
infestation by the phloem feeding insect Bemisia tabaci (whitefly). Plant
Biotechnol J. 2016. doi: 10.1111/pbi.12554
7. Tzin V, Fernandez-Pozo N, Richter A, Schmelz EA, Schoettner M, Schafer M,
Ahern KR, Meihls LN, Kaur H, Huffaker A, et al. Dynamic maize responses to
aphid feeding are revealed by a time series of transcriptomic and
metabolomic assays. Plant Physiol. 2015;169(3):1727–43.
8. Zhou G, Wang X, Yan F, Wang X, Li R, Cheng J, Lou Y. Genome-wide
transcriptional changes and defence-related chemical profiling of rice in
response to infestation by the rice striped stem borer Chilo suppressalis.
Physiol Plant. 2011;143(1):21–40.
9. Qi J, Sun G, Wang L, Zhao C, Hettenhausen C, Schuman MC, Baldwin IT, Li J,
Song J, Liu Z, et al. Oral secretions from Mythimna separata insects
specifically induce defense responses in maize as revealed by highdimensional biological data. Plant Cell Environ. 2016;39(8):1749–66.
10. Barah P, Bones AM. Multidimensional approaches for studying plant
defence against insects: from ecology to omics and synthetic biology. J Exp
Bot. 2015;66(2):479–93.
11. Zhou S, Lou YR, Tzin V, Jander G. Alteration of plant primary metabolism in
response to insect herbivory. Plant Physiol. 2015;169(3):1488–98.
Liu et al. BMC Plant Biology (2016) 16:259
12. Ehlting J, Chowrira SG, Mattheus N, Aeschliman DS, Arimura G,
Bohlmann J. Comparative transcriptome analysis of Arabidopsis thaliana
infested by diamond back moth (Plutella xylostella) larvae reveals
signatures of stress response, secondary metabolism, and signalling.
BMC Genomics. 2008;9:154.
13. Khush GS. What it will take to feed 5.0 billion rice consumers in 2030. Plant
Mol Biol. 2005;59(1):1–6.
14. Lou Y, Zhang G, Zhang W, Hu Y, Zhang J. Biological control of rice insect
pests in China. Biol Control. 2013;67(1):8–20.
15. Cohen MB, Chen M, Bentur JS, Heong KL, Ye G. Bt rice in Asia: potential
benefits, impact, and sustainability. In: Romeis J, Shelton AM, Kennedy GG,
editors. Integration of insect-resistant genetically modified crops within IPM
programs. Dordrecht: Springer Science + Business Media B.V; 2008. p. 223–
48.
16. Liu Y, Wu H, Chen H, Liu Y, He J, Kang H, Sun Z, Pan G, Wang Q, Hu J, et al.
A gene cluster encoding lectin receptor kinases confers broad-spectrum
and durable insect resistance in rice. Nat Biotechnol. 2015;33(3):301–5.
17. Wang Y, Guo H, Li H, Zhang H, Miao X. Identification of transcription factors
potential related to brown planthopper resistance in rice via microarray
expression profiling. BMC Genomics. 2012;13:687.
18. Wang Y, Li H, Si Y, Zhang H, Guo H, Miao X. Microarray analysis of broadspectrum resistance derived from an indica cultivar Rathu Heenati. Planta.
2012;235(4):829–40.
19. Yang L, Zhang W. Genetic and biochemical mechanisms of rice resistance
to planthopper. Plant Cell Rep. 2016;35(8):1559–72.
20. Hua H, Lu Q, Cai M, Xu C, Zhou D, Li X, Zhang Q. Analysis of rice genes
induced by striped stemborer (Chilo suppressalis) attack identified a
promoter fragment highly specifically responsive to insect feeding. Plant
Mol Biol. 2007;65(4):519–30.
21. Sun Y, Zhang Y, Cao G, Gu S, Wu K, Gao X, Guo Y. Rice gene expression
profiles responding to larval feeding of the striped stem borer at the 1st to
2nd instar stage. Insect Sci. 2011;18(3):273–81.
22. Han L, Li S, Liu P, Peng Y, Hou M. New artificial diet for continuous rearing
of Chilo suppressalis (Lepidoptera: Crambidae). Ann Entomol Soc Am. 2012;
105(2):253–8.
23. Liu Z, Li X, Zhang J, Cai Y, Cheng T, Cheng C, Wang Y, Zhang C, Nie Y, Chen
Z, et al. Autism-like behaviours and germline transmission in transgenic
monkeys overexpressing MeCP2. Nature. 2016;530(7588):98–102.
24. Livak KJ, Schmittgen TD. Analysis of relative gene expression data using
real-time quantitative PCR and the 2(−Delta Delta C(T)) method. Methods.
2001;25(4):402–8.
25. Jain M, Nijhawan A, Tyagi AK, Khurana JP. Validation of housekeeping genes
as internal control for studying gene expression in rice by quantitative realtime PCR. Biochem Biophys Res Commun. 2006;345(2):646–51.
26. Kawahara Y, de la Bastide M, Hamilton J, Kanamori H, McCombie WR,
Ouyang S, Schwartz D, Tanaka T, Wu J, Zhou S, et al. Improvement of the
Oryza sativa Nipponbare reference genome using next generation
sequence and optical map data. Rice. 2013;6(1):4.
27. Wang K, Singh D, Zeng Z, Coleman SJ, Huang Y, Savich GL, He X, Mieczkowski
P, Grimm SA, Perou CM, et al. MapSplice: accurate mapping of RNA-seq reads
for splice junction discovery. Nucleic Acids Res. 2010;38(18):e178.
28. Wang L, Feng Z, Wang X, Wang X, Zhang X. DEGseq: an R package for
identifying differentially expressed genes from RNA-seq data. Bioinformatics.
2010;26(1):136–8.
29. Mortazavi A, Williams BA, McCue K, Schaeffer L, Wold B. Mapping and
quantifying mammalian transcriptomes by RNA-Seq. Nat Meth.
2008;5(7):621–8.
30. Benjamini Y, Hochberg Y. Controlling the false discovery rate: a practical
and powerful approach to multiple testing. J R Stat Soc Series B Stat
Methodol. 1995;57:289–300.
31. Usadel B, Nagel A, Steinhauser D, Gibon Y, Blasing OE, Redestig H,
Sreenivasulu N, Krall L, Hannah MA, Poree F, et al. PageMan: an interactive
ontology tool to generate, display, and annotate overview graphs for
profiling experiments. BMC Bioinformatics. 2006;7:535.
32. Oliveros JC. VENNY. An interactive tool for comparing lists with Venn
Diagrams. 2007.
33. Ernst J, Bar-Joseph Z. STEM: a tool for the analysis of short time series gene
expression data. BMC Bioinformatics. 2006;7(1):191.
34. Volodarsky D, Leviatan N, Otcheretianski A, Fluhr R. HORMONOMETER: a tool
for discerning transcript signatures of hormone action in the Arabidopsis
transcriptome. Plant Physiol. 2009;150(4):1796–805.
Page 16 of 17
35. Reimand J, Arak T, Vilo J. g:Profiler–a web server for functional interpretation
of gene lists (2011 update). Nucleic Acids Res. 2011;39(Web Server issue):
W307–15.
36. DeHaven CD, Evans AM, Dai H, Lawton KA. Organization of GC/MS and LC/
MS metabolomics data into chemical libraries. J Cheminform. 2010;2:9–9.
37. Kucharzewska P, Christianson HC, Belting M. Global profiling of metabolic
adaptation to hypoxic stress in human glioblastoma cells. PloS one.
2015;10(1):e0116740.
38. Pérez-Rodríguez P, Riaño-Pachón DM, Corrêa LGG, Rensing SA, Kersten
B, Mueller-Roeber B. PlnTFDB: updated content and new features of the
plant transcription factor database. Nucleic Acids Res. 2010;38(Database
issue):D822–7.
39. Tzin V, Galili G. New insights into the shikimate and aromatic amino acids
biosynthesis pathways in plants. Mol Plant. 2010;3(6):956–72.
40. Appel HM, Fescemyer H, Ehlting J, Weston D, Rehrig E, Joshi T, Xu D,
Bohlmann J, Schultz J. Transcriptional responses of Arabidopsis thaliana to
chewing and sucking insect herbivores. Front Plant Sci. 2014;5:565.
41. Artico S, Ribeiro-Alves M, Oliveira-Neto OB, de Macedo LL, Silveira S, Grosside-Sa MF, Martinelli AP, Alves-Ferreira M. Transcriptome analysis of
Gossypium hirsutum flower buds infested by cotton boll weevil
(Anthonomus grandis) larvae. BMC Genomics. 2014;15:854.
42. Wang F, Ning D, Chen Y, Dang C, Han N, Liu Y, Ye G. Comparing gene
expression profiles between Bt and non-Bt rice in response to brown
planthopper infestation. Front Plant Sci. 2015;6:1181.
43. Wang Y, Wang X, Yuan H, Chen R, Zhu L, He R, He G. Responses of two
contrasting genotypes of rice to brown planthopper. Mol Plant Microbe
Interact. 2007;21(1):122–32.
44. Dubey NK, Goel R, Ranjan A, Idris A, Singh SK, Bag SK, Chandrashekar K,
Pandey KD, Singh PK, Sawant SV. Comparative transcriptome analysis of
Gossypium hirsutum L. in response to sap sucking insects: aphid and
whitefly. BMC Genomics. 2013;14:241.
45. Giri MK, Swain S, Gautam JK, Singh S, Singh N, Bhattacharjee L, Nandi AK.
The Arabidopsis thaliana At4g13040 gene, a unique member of the AP2/
EREBP family, is a positive regulator for salicylic acid accumulation and basal
defense against bacterial pathogens. J Plant Physiol. 2014;171(10):860–7.
46. Hu L, Ye M, Li R, Zhang T, Zhou G, Wang Q, Lu J, Lou Y. The rice
transcription factor WRKY53 suppresses herbivore-induced defenses by
acting as a negative feedback modulator of mitogen-activated protein
kinase activity. Plant Physiol. 2015;169(4):2907–21.
47. Li R, Zhang J, Li J, Zhou G, Wang Q, Bian W, Erb M, Lou Y. Prioritizing plant
defence over growth through WRKY regulation facilitates infestation by
non-target herbivores. eLife. 2015;4:e04805.
48. Wu J, Baldwin IT. New insights into plant responses to the attack from
insect herbivores. Annu Rev Genet. 2010;44(1):1–24.
49. Lu J, Robert CA, Riemann M, Cosme M, Mene-Saffrane L, Massana J, Stout
MJ, Lou Y, Gershenzon J, Erb M. Induced jasmonate signaling leads to
contrasting effects on root damage and herbivore performance. Plant
Physiol. 2015;167(3):1100–16.
50. Lou Y, Du M, Turlings TJ, Cheng J, Shan W. Exogenous application of
jasmonic acid induces volatile emissions in rice and enhances parasitism of
Nilaparvata lugens eggs by the parasitoid Anagrus nilaparvatae. J Chem
Ecol. 2005;31(9):1985–2002.
51. De Vleesschauwer D, Xu J, Höfte M. Making sense of hormone-mediated
defense networking: from rice to Arabidopsis. Front Plant Sci. 2014;5:611.
52. De Vos M, Van Oosten VR, Van Poecke RM, Van Pelt JA, Pozo MJ, Mueller
MJ, Buchala AJ, Metraux JP, Van Loon LC, Dicke M, et al. Signal signature
and transcriptome changes of Arabidopsis during pathogen and insect
attack. Mol Plant Microbe Interact. 2005;18(9):923–37.
53. Schwachtje J, Baldwin IT. Why does herbivore attack reconfigure primary
metabolism? Plant Physiol. 2008;146(3):845–51.
54. Liu C, Hao F, Hu J, Zhang W, Wan L, Zhu L, Tang H, He G. Revealing
different systems responses to brown planthopper infestation for pest
susceptible and resistant rice plants with the combined metabonomic and
gene-expression analysis. J Proteome Res. 2010;9(12):6774–85.
55. Scholz SS, Reichelt M, Mekonnen DW, Ludewig F, Mithofer A. Insect
herbivory-elicited GABA accumulation in plants is a wound-induced, direct,
systemic, and jasmonate-independent defense response. Front Plant Sci.
2015;6:1128.
56. Hagenbucher S, Olson DM, Ruberson JR, Wäckers FL, Romeis J. Resistance
mechanisms against arthropod herbivores in cotton and their interactions
with natural enemies. Crit Rev Plant Sci. 2013;32(6):458–82.
Liu et al. BMC Plant Biology (2016) 16:259
Page 17 of 17
57. Liu Q, Romeis J, Yu H, Zhang Y, Li Y, Peng Y. Bt rice does not disrupt the hostsearching behavior of the parasitoid Cotesia chilonis. Sci Rep. 2015;5:15295.
58. Tholl D. Biosynthesis and biological functions of terpenoids in plants. Adv
Biochem Eng Biotechnol. 2015;148:63–106.
59. Matsye PD, Kumar R, Hosseini P, Jones CM, Tremblay A, Alkharouf NW,
Matthews BF, Klink VP. Mapping cell fate decisions that occur during
soybean defense responses. Plant Mol Biol. 2011;77:513–28.
60. Matsye PD, Lawrence GW, Youssef RM, Kim K-H, Matthews BF, Lawrence KS,
Klink VP. The expression of a naturally occurring, truncated allele of an αSNAP gene suppresses plant parasitic nematode infection. Plant Mol Biol.
2012;80:131–55.
61. Matthews BF, Beard H, MacDonald MH, Kabir S, Youssef RM, Hosseini P,
Brewer E. Engineered resistance and hypersusceptibility through functional
metabolic studies of 100 genes in soybean to its major pathogen, the
soybean cyst nematode. Planta. 2013;237:1337–57.
Submit your next manuscript to BioMed Central
and we will help you at every step:
• We accept pre-submission inquiries
• Our selector tool helps you to find the most relevant journal
• We provide round the clock customer support
• Convenient online submission
• Thorough peer review
• Inclusion in PubMed and all major indexing services
• Maximum visibility for your research
Submit your manuscript at
www.biomedcentral.com/submit