Changes in transcription of cytokinin metabolism and signalling genes in grape (Vitis vinifera L.) berries are associated with the ripening-related increase in isopentenyladenine
Bạn đang xem bản rút gọn của tài liệu. Xem và tải ngay bản đầy đủ của tài liệu tại đây (1.36 MB, 15 trang )
Böttcher et al. BMC Plant Biology (2015) 15:223
DOI 10.1186/s12870-015-0611-5
RESEARCH ARTICLE
Open Access
Changes in transcription of cytokinin
metabolism and signalling genes in grape
(Vitis vinifera L.) berries are associated with
the ripening-related increase in
isopentenyladenine
Christine Böttcher*, Crista A. Burbidge, Paul K. Boss and Christopher Davies
Abstract
Background: Cytokinins are known to play an important role in fruit set and early fruit growth, but their involvement
in later stages of fruit development is less well understood. Recent reports of greatly increased cytokinin concentrations
in the flesh of ripening kiwifruit (Actinidia deliciosa (A. Chev.) C.F. Liang & A.R. Ferguson) and grapes (Vitis vinifera L.)
have suggested that these hormones are implicated in the control of ripening-related processes.
Results: A similar pattern of isopentenyladenine (iP) accumulation was observed in the ripening fruit of several
grapevine cultivars, strawberry (Fragaria ananassa Duch.) and tomato (Solanum lycopersicum Mill.), suggesting a
common, ripening-related role for this cytokinin. Significant differences in maximal iP concentrations between
grapevine cultivars and between fruit species might reflect varying degrees of relevance or functional adaptations
of this hormone in the ripening process. Grapevine orthologues of five Arabidopsis (Arabidopsis thaliana L.) gene
families involved in cytokinin metabolism and signalling were identified and analysed for their expression in
developing grape berries and a range of other grapevine tissues. Members of each gene family were characterised by
distinct expression profiles during berry development and in different grapevine organs, suggesting a complex regulation
of cellular cytokinin activities throughout the plant. The post-veraison-specific expression of a set of biosynthesis,
activation, perception and signalling genes together with a lack of expression of degradation-related genes
during the ripening phase were indicative of a local control of berry iP concentrations leading to the observed
accumulation of iP in ripening grapes.
Conclusions: The transcriptional analysis of grapevine genes involved in cytokinin production, degradation and
response has provided a possible explanation for the ripening-associated accumulation of iP in grapes and other
fruit. The pre- and post-veraison-specific expression of different members from each of five gene families
suggests a highly complex and finely-tuned regulation of cytokinin concentrations and response to different
cytokinin species at particular stages of fruit development. The same complexity and specialisation is also
reflected in the distinct expression profiles of cytokinin-related genes in other grapevine organs.
Keywords: Cytokinins, Isopentenyladenine, Vitis vinifera, Ripening
* Correspondence:
CSIRO Agriculture Flagship, Waite Campus, WIC West Building, PMB2, Glen
Osmond, South Australia 5064, Australia
© 2015 Böttcher et al. Open Access This article is distributed under the terms of the Creative Commons Attribution 4.0
International License ( which permits unrestricted use, distribution, and
reproduction in any medium, provided you give appropriate credit to the original author(s) and the source, provide a link to
the Creative Commons license, and indicate if changes were made. The Creative Commons Public Domain Dedication waiver
( applies to the data made available in this article, unless otherwise stated.
Böttcher et al. BMC Plant Biology (2015) 15:223
Background
Naturally occurring cytokinins are adenine derivatives
whose diverse functions in plant growth and development have earned them recognition as molecules of
great biological and agricultural importance. The four
most abundant cytokinins found in plants, trans-zeatin
(tZ), N6-(Δ2-isopentenyl)-adenine (iP), cis-zeatin (cZ),
and dihydrozeatin, differ in the stereo-isomeric position,
hydroxylation and saturation of the isoprenoid side
chain [1], but little is known about the physiological
relevance of these side chain differences [2]. Apart from
their well-described role in regulating cell division and
differentiation [3], cytokinins are involved in a range of
processes essential to plant survival, such as leaf senescence [4, 5], control of shoot-to-root balance [6, 7],
nutritional signalling [8, 9], stress tolerance [10] and
nodulation [11, 12]. Quantity and composition of
cellular cytokinins are regulated through biosynthesis,
transport, inter-conversion of distinct forms, transient
inactivation by conjugation, and irreversible inactivation
by side chain cleavage [13]. The targeted disturbance of
this balance, leading to increased activity of inflorescence
and floral meristems and higher seed yield in rice (Oryza
sativa L.) [14] and Arabidopsis (Arabidopsis thaliana L.)
[15], has recently provided evidence for the importance of
cytokinins in reproductive development and hence crop
productivity. In support of this, high cytokinin activities or
concentrations have been reported in immature seeds and
fruit from a large number of species, including pea (Pisum
sativum L.) [16], white lupine (Lupinus albus L.) [17],
Christmas rose (Helleborus niger L.) [18], tomato (Solanum lycopersicum Mill.) [19], strawberry (Fragaria ananassa Duch.) [20], kiwifruit (Actinidia deliciosa (A. Chev.)
C.F. Liang & A.R. Ferguson) [21], raspberry [22] and
grape (Vitis vinifera L.) [23–25]. Generally, cytokinin
activities/concentrations were found to peak shortly after
fertilization coinciding with periods of high rates of cell
division, which has linked these hormones to fruit set and
early fruit growth [26, 27]. Applications of synthetic
cytokinins such as 6-benzylaminopurine, N-(2-Chloro4-pyridinyl)-N’-phenylurea (CPPU) and thidiazuron
(TDZ) have been widely used in fruit such as grape
[28], kiwifruit [29], blueberry (Vaccinium ashei Reade)
[30], apple (Malus domestica Borkh.) [31] and pear
(Pyrus communis L.) [32] to improve fruit set and/or
increase fruit size. In contrast, the role of cytokinins
during later stages of fruit development is less well
documented and understood, partly due to the often
reported decrease in cytokinin activities/concentrations
following the initial growth phase [33]. Treatment of fruit
with the above mentioned cytokinins has produced inconsistent effects on the progression of ripening varying with
fruit species and cytokinin used. For example, CPPUtreated grapes showed a delayed accumulation of sugars
Page 2 of 15
and anthocyanins and remained firmer than control berries [34] and a similar CPPU-induced ripening delay has
been described in blueberry [30]. However, the opposite
effect was observed in kiwifruit, where CPPU treatment
led to increased sugar accumulation, decreased acidity
and reduced flesh firmness [35]. TDZ had the same
ripening-advancing effect on kiwifruit as CPPU [35],
whereas ripening of TDZ-treated persimmon (Diospyros
kaki L.) fruit was delayed, as evidenced by a delay in sugar
accumulation and chlorophyll degradation [36]. In contrast, treatment with 6-benzylaminopurine had no effect
on the ripening progression of persimmon [36]. While
application studies have therefore not given any clear
indications for possible functions of endogenous cytokinins in the ripening process, the asynchronous ripening of siliques and reduced production of viable
seeds in cytokinin-deficient Arabidopsis mutants suggest
an involvement of these hormones in fruit maturation [6].
In addition, two recent studies on kiwifruit [37] and grape
berries [38] have reported a sharp increase in the concentration of active cytokinins in the flesh of ripening fruit. In
the case of kiwifruit, the main contributor to this increase
was tZ, whereas iP was found to be the main cytokinin
species accumulating in ripening grapes.
The aim of this study was to further investigate the
ripening-related increase in iP concentrations in grapes,
focusing on the role of local cytokinin biosynthesis, activation, perception, signalling and degradation. The expression profiles of relevant genes in developing grape berries
were indicative of distinct sets of cytokinin-related genes
controlling the quantity and composition of, and responsiveness to, cytokinin species accumulating in the fruit
during different stages of development. In addition, evidence is provided that the accumulation of iP during the
ripening phase is common to a range of grapevine cultivars and also occurs in tomato and strawberry.
Methods
Plant material
For the analysis of developmental changes in the expression of cytokinin-related genes and cytokinin levels, Vitis
vinifera L. cv. Shiraz berries from a commercial vineyard
were collected at weekly intervals as described by
Böttcher et al. [39] in the 2010/2011 season. All tissues
used for gene expression studies in various grapevine
organs were collected from Shiraz plants grown in an
experimental vineyard or glasshouse in Adelaide, South
Australia [39]. In addition to the Shiraz berry series,
cytokinin measurements were also taken from the following samples: 1) Vitis vinifera L. cv. Cabernet Sauvignon and cv. Riesling, grown at a commercial vineyard
(Waikerie, South Australia; −34.100°, 139.842°) and sampled every two weeks as described by Kalua and Boss
[40, 41]. Seeds were removed from frozen berries prior
Böttcher et al. BMC Plant Biology (2015) 15:223
to grinding and cytokinin extraction. 2) Vitis vinifera L.
cv. Pinot Noir berries, grown at a commercial vineyard
(Willunga, South Australia; −35.263°, 138.553°) and sampled as in 1), but retaining the seeds. 3) Grapes of similar
sugar content (19.4–20.8°Brix) collected from 13 grapevine
species (11 Vitis vinifera, one Vitis hybrid and one interspecific hybrid) grown at an experimental vineyard (Waite
Coombe vineyard, Adelaide, South Australia; −34.263°,
138.553°) in the 2013/2014 season. Juice from individual
berries (10 berries per replicate, three replicates) sampled
from six bunches across two vines was tested for total soluble solids using a PAL-1 digital refractometer (Atago,
Tokyo, Japan), followed by immediate deseeding and freezing in liquid nitrogen of berries within the above specified
sugar content range. 4) Tomatoes (Solanum lycopersicum
Mill. var. Moneymaker) grown from seed in the glasshouse
(CSIRO Agriculture, Adelaide, South Australia) and
harvested at five standard ripening stages as detailed
by Böttcher et al. [42]. 5) Strawberries (Fragaria ananassa
Duch. cv. Ablion) at four different ripening stages (small
green, large green, turning, red ripe), sampled at a commercial strawberry farm (Hahndorf, South Australia; −35.038°,
138.816°) in November 2009. A minimum of five strawberries per stage was used for each biological replicate. For
a second set of samples, achenes were removed with
tweezers prior to freezing in liquid nitrogen.
Determination of total soluble solids (TSS) levels
Measurements of TSS (degrees Brix) for the berries
from the developmental series were done as described
by Davies et al. [43].
Phylogenetic analysis
Grapevine sequences belonging to five families of proteins involved in the biosynthesis, activation, perception,
signalling and degradation of cytokinins were identified
by BLASTP searches of the non-redundant NCBI protein database ( using the
respective Arabidopsis sequences (see Additional file 1),
obtained from The Arabidopsis Information Resource
(TAIR; as queries. Phylogenetic analyses were conducted using the corresponding nucleotide sequences in MEGA6.06 [44] as follows:
The Arabidopsis and grapevine nucleotide sequences for
each gene family were aligned using MUSCLE [45], all
positions containing gaps and missing data were eliminated. The evolutionary history was inferred by using
the Maximum Likelihood method based on the JTT
matrix-based model [46]. A bootstrap consensus tree
was generated from 100 replicates [47] and branches corresponding to partitions replicated in less than 70 % replicates were collapsed. Initial tree(s) for the heuristic search
were obtained automatically by applying Neighbor-Join
and BioNJ algorithms to a matrix of pairwise distances
Page 3 of 15
estimated using a JTT model and then selecting the topology with superior log value. The coding data was translated assuming a standard genetic code table. The naming
of grapevine genes followed the guidelines published by
Grimplet et al. [48].
RNA extraction, cDNA synthesis and qRT-PCR
RNA extraction, cDNA synthesis and qRT-PCR were
performed as described previously [49] with modifications as described by Böttcher et al. [39]. The genespecific primers and corresponding accession number
used for ACT2 (reference gene) have been published
previously [50]. All primer pairs for cytokinin-related
genes used in this study are listed with corresponding
amplicon sizes in Additional file 2. Gene expression data
was analysed using the MeV software (version 4.9;
and presented as heat maps with hierarchical clustering.
Extraction and quantification of nucleobase cytokinins
For the quantification of iP and tZ, 100 mg of fruit tissue
was extracted in 1 mL of 70 % (v/v) ethanol, 0.2 mM
diethyldithiocarbamic acid, spiked with 5 pmol of d6-iP
and d5-tZ (OlChemIm Ltd., Olomouc, Czech Republic)
as internal standards, for 2 h at 4 °C on a rotating mixer.
After the tissue was pelleted by centrifugation at 4 °C,
the supernatant was removed and kept at 4 °C, while the
pellet was re-extracted in 1 mL of 70 % (v/v) ethanol,
0.2 mM diethyldithiocarbamic acid for 1 h at 4 °C. Following centrifugation the supernatant was combined
with the initial extract, the organic solvent was removed
in vacuo and the aqueous phase was adjusted to pH 7.5
(NaOH) and applied to a 100 mg C18 SPE column
(Waters, Wexford, Ireland). The column was washed
with water pH 7.5 (2 mL) and then eluted with 80 % (v/v)
MeOH, 2 % (v/v) acetic acid (2.5 mL). The dried residue
was re-suspended in 50 μL 90 % (v/v) 15 mM formic acid,
adjusted to pH 4.0 with ammonia, 10 % (v/v) methanol to
be analyzed with an Agilent LC-MS system (1200 series
HPLC coupled with a 6410 triple quad mass spectrometer). The sample (10 μL) was first separated on a Luna
C18 column (75 × 4.6 mm, 5 μm, (Phenomenex, Torrance,
CA)) held at 30 °C using the following solvent conditions:
0–20 min, linear gradient from 10 % (v/v) MeOH, 90 %
15 mM formic acid, adjusted to pH 4.0 with ammonia to
95 % (v/v) MeOH, 5 % (v/v) 15 mM formic acid, adjusted
to pH 4.0 with ammonia, held for 5 min, linear gradient
from 95 % (v/v) to 10 % (v/v) MeOH in 1 min, held for
6 min, 0.4 mL min−1. The effluent was introduced into the
ESI ion source (nebulizer pressure 35 psi) with a desolvation gas temperature of 300 °C at a flow of 8 L min−1, with
the capillary voltage set to 4 kV. The detection was performed by multiple reaction monitoring in positive ion
mode. The optimization of fragmentation was done with
Böttcher et al. BMC Plant Biology (2015) 15:223
iP, tZ (Sigma-Aldrich, St. Louis, MO, USA) as well as
the labelled standards using the Agilent MassHunter
Optimizer software (version B03.01). The following main
transitions were used for quantitation: d6-iP 210 > 137, iP
204 > 136, d5-tZ 225 > 137, tZ 220 > 136. In addition,
a qualifier ion transition was included for each compound: d6-iP 210 > 148, iP 204 > 148, d5-tZ 225 > 119,
tZ 220 > 119. The sensitivity of the analysis was enhanced by monitoring d5-tZ and tZ in a different retention window (0–15 min) to d6-iP and iP (15–22 min).
The concentrations of iP and tZ in the extracts were
quantified in relation to their internal standards using
calibration curves that had been generated as follows:
50 μM stocks were used to prepare eight standard solutions (1 nM–500 nM) and 50 μL of each standard solution was mixed with 5 pmol of d6-iP and d5-tZ (in
triplicate). Samples were dried in vacuo and resuspended in 50 μL of 90 % (v/v) 15 mM formic acid,
adjusted to pH 4.0 with ammonia, 10 % (v/v) methanol
resulting in internal standard concentrations of 100 nM
each. A 10 μl-aliquot of each sample was subjected to
an LC-ESI-MS/MS analysis as described above and
calibration curves were generated using the Agilent
Quantification software (version B04.00) by plotting the
known concentration of each unlabelled compound
against the ratio of analyte peak area to corresponding
internal standard peak area. The limits of detection
(signal-to-noise ratio >3) gained from the calibration
curves were 0.2 fmol μL−1 for tZ and 0.08 fmol μL−1 for
iP, the limits of quantification (signal-to-noise ratio >10)
were 0.67 fmol μL−1 for tZ and 0.25 fmol μL−1 for iP.
Statistical data analysis
Significant differences in TSS contents and cytokinin
concentrations were identified by analysis of variance
(ANOVA) followed by Duncan’s post hoc test. ANOVA
was also performed for the gene expression data collected from the Shiraz berry development samples and
this was followed by Fisher’s Least Significant Difference
(LSD) post hoc test to test for significant differences.
Statistical testing of the various datasets was conducted
using IBM SPSS Statistics ver. 20 (IBM Australia, Sydney,
NSW, Australia).
Results
Grape cultivars exhibit similar patterns of cytokinin
accumulation during fruit development but iP
concentrations at full ripeness vary
The recent discovery of a large increase in iP concentrations in ripening Shiraz berries has provided the first
evidence for a possible involvement of a cytokinin in the
ripening process of grapes [38]. In order to evaluate if
the ripening-associated accumulation of iP is a common occurrence in grapes, berries from three different
Page 4 of 15
grapevine cultivars, sampled from 2 weeks post flowering
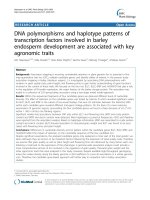
(wpf) to commercial harvest after 15–17 wpf, were analysed for their iP content (Fig. 1). The only other active
cytokinin present in detectable amounts in grape berries,
tZ [38], was also included in the analysis. tZ concentrations were generally found to be low (below 1 pmol g−1
fresh weight (FW)) and were elevated significantly at only
one time point in Cabernet Sauvignon (Fig. 1a, 4 wpf),
Riesling (Fig. 1b, 2 wpf) and Pinot Noir (Fig. 1c, 6 wpf).
The biggest increase in tZ concentration was recorded for
Pinot Noir berries (~20-fold), which, unlike Cabernet Sauvignon and Riesling berries, had not been deseeded prior
to cytokinin extraction. In berries from all three cultivars
tested, iP concentrations had increased significantly by
four weeks after veraison (here defined as the last sampling time point prior to a significant increase in TSS
levels) and continued to increase thereafter (Fig. 1). However, absolute iP concentrations at harvest varied greatly,
being highest in Cabernet Sauvignon (73.9 pmol g−1 FW),
followed by Pinot Noir (31.5 pmol g−1 FW) and Riesling
(14.6 pmol g−1 FW).
For a more detailed analysis of cultivar-specific differences in berry iP concentrations, grapes from 13 different grapevine cultivars grown in the same vineyard were
sampled at a similar TSS content (19.4–20.8°Brix) and
subjected to iP quantification (Table 1). Measured iP
concentrations differed up to 14-fold, ranging from 4.46
pmol g−1 FW in Viognier to 62.90 pmol g−1 FW in Shiraz, and iP abundance was not associated with berry skin
colour. Whilst the iP concentration in Cabernet Sauvignon berries (Table 1) was comparable to berries in the
same TSS range sampled in a different year and from a
different vineyard (Fig. 1a), it was lower in berries from
Riesling, Pinot Noir (Table 1 and Fig. 1b, c) and Shiraz
(Table 1 and Fig. 2a).
Multigene families encode grapevine genes with roles in
cytokinin biosynthesis, activation, perception, signalling
and catabolism
To investigate if the post-veraison increase in grape
berry iP concentrations is the result of changes in local
cytokinin biosynthesis, activation and/or catabolism, grapevine genes belonging to the families of isopentenyltransferases (IPTs), LONELY GUY (LOG) cytokinin nucleoside
5′-monophosphate phosphoribohydrolases and cytokinin
oxidases/dehydrogenases (CKXs) were identified by
sequence similarity to the respective Arabidopsis genes
(Table 2, Additional files 1 and 3A-C). Cytokinin histidine
kinase (CHK) receptors and type-A and –B response
regulators (RRs) were also included in the analysis
since a functional perception and signal transduction
system is a prerequisite for the detection of, and response
to, changed iP concentrations (Table 2 and Additional
files 1, 3D and 4).
Böttcher et al. BMC Plant Biology (2015) 15:223
Page 5 of 15
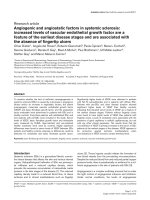
Fig. 1 Concentrations of iP and tZ in developing berries from three grapevine cultivars.iP and tZ were quantified by LC-MS/MS in developing berries of
field-grown (a) Cabernet Sauvignon, b Riesling and c Pinot Noir. All data represent means (n = 3) ± SE. “v” indicates veraison, as determined by the last time
point before a significant increase (p <0.05) in TSS levels was recorded. Asterisks mark the start of a significant increase in iP concentrations. In each cultivar,
the concentration of tZ was significantly higher (p <0.05) at one time point compared to the others, and this is denoted by an arrow. FW, fresh weight
Adenylate IPTs catalyse the initial step in the main
pathway for cytokinin biosynthesis, the N6-prenylation of
adenosine 5′-phosphates to form iP-riboside 5′-phosphates
[51, 52]. The isoprenoid side chain can subsequently
be hydroxylated by the cytochrome P450 enzymes
CYP735A1/CYP735A2 to produce tZ-ribotides [53]. However, the single grapevine CYP735A orthologue [NCBI:
XM_002280169, CRIBI: VIT_214s0006g02970] was not
expressed in berries (data not shown) and cytokinin species conversion was therefore not considered to be a relevant mechanism in the context of this study. tRNA-IPTs
catalyse the addition of an isopentenyl group to adenine
bases in tRNAs, which can lead to the release of cZ and iP
upon hydrolysis [54]. The grapevine genome was found to
encode eight IPTs (Table 2), six of which clustered with
the Arabidopsis adenylate IPTs and two orthologues
(VviIPT2, VviIPT9) of the respective Arabidopsis tRNAIPTs (Additional file 3A). Inactive cytokinin ribotides produced by the action of adenylate IPTs can be converted to
active nucleobases by LOG phosphoribohydrolases [55].
Ten grapevine LOG genes were identified (Table 2),
compared with nine genes of this family in Arabidopsis
Böttcher et al. BMC Plant Biology (2015) 15:223
Page 6 of 15
Table 1 iP concentration in berries (19.4–20.8 °Brix) of 13 grape
cultivars
Species
Cultivar
Colour of iP (pmol g−1 FW)
berry skin
V. vinifera
Shiraz
Red
62.90 ± 0.43a
V. vinifera
Cabernet Sauvignon
Red
40.77 ± 1.72b
V. vinifera
Durif
Red
21.85 ± 5.90c
V. vinifera
Pedro Ximénez
White
21.16 ± 1.19cd
Red
20.27 ± 4.17cd
Interspecific hybrid Chambourcin
V. vinifera
Sauvignon Blanc
White
15.59 ± 4.17cde
V. vinifera
Barbera
Red
12.82 ± 0.44def
V. vinifera
Muscat Gordo Blanco White
8.79 ± 3.83ef
Vitis hybrid
Rubired
Red
7.97 ± 0.37ef
V. vinifera
Riesling
White
6.11 ± 0.77f
V. vinifera
Pinot Noir
Red
5.69 ± 0.60f
V. vinifera
Verdelho
White
5.33 ± 0.87f
V. vinifera
Viognier
White
4.46 ± 0.77f
iP values represent means (n = 3) ± SE and different letters indicate significant
differences between the cultivars as determined by one-way ANOVA (p <0.05)
followed by Duncan’s post hoc test
(Additional file 3B). Inactivation of cytokinins occurs by
CKX-catalysed oxidative cleavage of the isoprenoid side
chain [56, 57]. Out of the eight grapevine CKXs
(Table 2), four were close orthologues of Arabidopsis
CKXs (Additional file 3C). One-to-one orthologues
were identified for all five grapevine CHK sequences
(Table 2 and Additional file 3D), three of which
(VviCHK2-VviCHK4) represented the bona fide cytokinin
receptors [58]. The downstream targets of the His-Asp
phosphorelay of the cytokinin signalling pathway are
RRs, which are classified as negative (type-A) or positive
(type-B) regulators of cytokinin signalling [59–61]. In contrast to Arabidopsis, more type-A (11) than type-B (8)
RRs (Table 2 and Additional file 4) were identified in the
grapevine genome.
The expression of a subset of cytokinin-related genes
coincides with the accumulation of iP during berry
development
In an attempt to uncover causal relationships between
the post-veraison accumulation of iP and the transcript
abundance of genes involved in the control of cellular
cytokinin concentrations, cytokinin nucleobases were
quantified in developing Shiraz berries (Fig. 2a) and the
same berry tissue was used to analyse the expression of
48 cytokinin-related genes (Table 2 and Fig. 2b). For
those genes expressed at more than two time points
(29), copy numbers and statistical data analyses are provided in Additional file 5. VviCHK1, VviCHK5 and
VviCKI were not included in this study due to their unclear contribution to cytokinin perception and signal
transduction [62, 63]. Splice variants have been described for 40 % of the genes analysed in this study
(Table 2, [64]). The primer pairs used for gene-specific
amplification allowed for >90 % coverage of all known
variants and were therefore expected to provide reliable
expression patterns for each gene.
The changes in cytokinin concentration in Shiraz berries during development (Fig. 2a) followed a similar pattern to those observed in Cabernet Sauvignon, Riesling
and Pinot Noir (Fig. 1). These results confirmed and expanded previous data obtained for a subset of the Shiraz
samples using different methods of extraction and quantification [38]. tZ concentrations remained low and unchanged throughout development whereas a significant
increase in iP concentrations was recorded from 11 wpf
onwards reaching a maximum of 98.7 pmol g−1 FW at
15 wpf (Fig. 2a).
In total, 38 cytokinin-related genes, were found to be
expressed at one or more time point(s) in berry tissue
and hierarchical clustering revealed six groups of gene
expression profiles (Fig. 2b). Cluster 1 contained four
genes, one LOG, one CHK and two RRs, with the highest
expression between 1 and 4 wpf and moderate to low
transcript levels for the rest of development. Nine genes,
composed of two IPTs, one LOG, one CHK and five RRs,
constituted Cluster 2 and showed peaks of expression
between 1–4 wpf and 11–16 wpf with the highest transcript abundance in the post-veraison peak. Cluster 3
was made up of IPT12 and RR11a, which displayed a
transcript peak between 5 and 8 wpf and, in the case of
RR11a, also at 16 wpf. The expression in Cluster 4 (one
CKX, two RRs) was mainly restricted to the 4 wpf time
point. Cluster 5 was the biggest cluster, consisting of 15
genes representing all five families of cytokinin-related
genes analysed, with predominant expression in very
young berries (1–4 wpf ). Cluster 6 contained two genes,
both of them LOGs, which were expressed between 9
and 16 wpf. Outside of the clusters, LOG13 and CKX6a
transcripts were only detected at one time point (2 wpf
and 10 wpf, respectively), whereas RR37 had low expression levels in young berries (1–2 wpf ) and was highly
expressed from 14 to 16 wpf.
Cytokinin-related genes are characterised by diverse
expression profiles in different grapevine tissues
To gain a more complete picture of the expression and
deduced activities of components of cytokinin metabolism and signalling in grapevine, the transcript accumulation of the above mentioned 48 cytokinin-related genes
was also analysed in a range of other grapevine tissues
(Fig. 3). All attempts to amplify CKX10 and RR36 fragments from any of the tested grapevine cDNAs for the
generation of qRT-PCR standards failed (data not
shown), so these two genes could not be included in the
Böttcher et al. BMC Plant Biology (2015) 15:223
Page 7 of 15
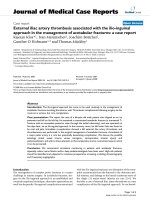
Fig. 2 Changes in iP and tZ concentrations and the expression of 38 cytokinin-related genes in developing Shiraz grape berries. a Changes in
TSS, iP and tZ concentrations in field-grown Shiraz berries during the 2010/2011 season. All data represent means (n = 3) ± SE. “v” indicates veraison as
determined by the last time point before a significant increase (p <0.05) in TSS levels was recorded. The asterisk marks the start of a significant increase
in iP concentrations (p <0.05). FW, fresh weight. b Heat map showing changes in transcript levels of cytokinin-related genes expressed in berries as
determined by qRT-PCR. In order to adjust for differences in absolute copy numbers between the genes, the mean (n = 3) expression values for each
transcript were normalized by dividing by the maximum copy number obtained from the berry developmental series, making all values fall between 0
and 1. Each column represents a time point after flowering, each row represents a gene of interest. Hierarchical clustering was used to group genes
with similar expression profiles. Copy numbers for the 29 genes expressed at more than two time points and statistical analyses of the data are given
in Additional file 5
expression analysis. Transcripts of the remaining 46
genes, including eight genes that were not expressed in
berries (Fig. 2b), were detected in at least one of the
tested tissue types with gene expression profiles clustering into seven groups (Fig. 3). Cluster 1, consisting of
RR34 and LOG12, was characterised by predominant
expression in node five (L5) and nine (L9) leaves and in
seeds 5 wpf (S5; RR34). Cluster 2 was also made up of
two genes, RR35 and CKX6b, which were expressed in
flowers and roots. Cluster 3 included five genes, one
LOG and four RRs, with transcripts detected in all tissues and highest expression in flowers, L9, S5, S9 or
roots. The largest set of genes (21) was grouped in Cluster 4 and was predominantly expressed in tendrils and
roots. CKX5 and CXK6a were also highly expressed in
S5. Cluster 5 contained eight genes, representing all five
families of cytokinin-related genes analysed, with highest
expression in L9 or roots. The common feature of RR26,
CKX11 and LOG13 in Cluster 6 was S14-specific expression, whereas Cluster 7 CHK3 and RR31 transcripts were
mainly detected in flowers and seeds. Three genes
showed unique expression profiles: LOG5b was mainly
expressed in internodes, LOG5a showed expression in all
tissues except seeds and RR40 transcripts were only detected in roots. Copy numbers of all expressed genes are
provided in Additional files 6 and 7.
A ripening-associated increase in iP concentrations also
occurs in tomato and strawberry
Studies involving the measurement of cytokinins throughout fruit development are scarce, which could be one reason why the accumulation of iP during the ripening phase
of fruit has not been reported from any fruit species other
than grape [38]. In order to investigate if the ripeningassociated iP increase is unique to grape berries or a common phenomenon in fruit, nucleobase cytokinins were
Böttcher et al. BMC Plant Biology (2015) 15:223
Page 8 of 15
Table 2 Names, NCBI and CRIBI accession numbers and EST and splice variant numbers of the cytokinin-related grapevine sequences
identified in this study
Name
NCBI
Reference Sequence
NCBI
ESTs
VviIPT2
XM_002263711
VviIPT9
VviIPT10
VviIPT11
VviIPT12
Fernandes et al. [109]a
CRIBI (V2)
Locus ID
Splice variants
Amplified variants
8
VIT_206s0061g01410
1,2
1,2
XM_002282976
3
VIT_219s0014g01630
1,2
1
XM_002279335
0
VIT_201s0011g03640
1
1
XM_002268812
0
VIT_209s0070g00710
1
1
XM_002271926
2
VIT_207s0104g00270
1
1
VviIPT13
XM_003632592
0
VIT_208s0040g01010
1
1
VviIPT14
XM_002277555
4
VIT_205s0020g02630
1
1
VviIPT15
XM_002278900
5
VIT_208s0040g00100
1–5
1–5
VviLOG5a
XM_010665788
6
VIT_218s0001g00210
1
1
VviLOG5b
XM_002281803
4
VIT_203s0038g03420
1–3
1–3
VviLOG10
XM_002276739
38
VIT_218s0001g14030
1–6
1–6
VviLOG11
XM_002275378
0
VIT_208s0007g02480
1
1
VviLOG12
XM_002276243
1
VIT_208s0040g01780
1
1
VviLOG13
XM_002285210
15
VIT_206s0004g02680
1–7
1–7
VviLOG14
XM_002285680
2
VIT_206s0004g00590
1–4
1–4
VviLOG15
XM_002274711
0
VIT_213s0064g00740
1–8
1,3,5–8
VviLOG16
XM_002277816
0
VIT_208s0007g08340
1
1
VviLOG17
XM_002278269
5
VIT_204s0008g01040
1
1
VviCKX5
XM_002280761
21
VIT_218s0001g13200
1,2
1,2
VviCKX6a
XM_002270805
1
VIT_213s0158g00320
1–3
1–3
VviCKX6b
XM_002284524
1
VIT_200s0252g00040
1
1
VviCKX7
XM_002279924
15
VIT_204s0008g01880
1–3
1–3
VviCKX8
XM_002279483
0
VIT_211s0016g02110
1
1
VviCKX9
XM_003632356
0
VIT_207s0005g06025
1
1
VviCKX10
XM_002263610
1
VIT_207s0005g05960
1
1
VviCKX11
XM_002264409
0
VIT_207s0005g06010
1
1
VviCHK1
XM_002265212
2
VIT_204s0023g03680
1,2
na
VviCHK2
XM_002269941
2
VvCyt1
VIT_212s0057g00690
1–6
1–5
VviCHK3
XM_002276925
24
VvCyt2
VIT_201s0010g03780
1–4
1–4
VviCHK4
XM_002285081
10
VvCyt3
VIT_201s0011g06190
1–6
1–5
VviCHK5
XM_002271707
2
VIT_204s0069g00750
1–4
na
VviCKI
XM_002270283
0
VIT_207s0005g01380
1
na
VviRR11a
XM_002274637
2
VvRRb1
VIT_217s0000g10100
1,2
1,2
VviRR11b
XM_002267580
1
VvRRb5
VIT_201s0010g02230
1
1
VviRR25
XM_002269335
0
VvRRb2
VIT_207s0005g01010
1
1
VviRR26
XM_002270082
0
VvRRb4
VIT_211s0052g01160
1
1
VviRR27
XM_002275106
13
VvRRb6
VIT_205s0077g01480
1–4
1–4
VviRR28
XM_002281255
20
VIT_201s0011g05830
1
1
VviRR29
XM_002270797
4
VIT_211s0206g00060
1,2
1,2
VviRR30
XM_002282892
8
VIT_204s0008g05900
1–4
2,4
VviRR31
FJ822980 (partial cds)
0
VIT_201s0026g00940
1
1
VviRR32
XM_002283751
9
VvRRa1
VIT_217s0000g07580
1
1
VviRR33
XM_002280710
3
VvRRa3
VIT_213s0067g03070
1
1
VvRRb3
Böttcher et al. BMC Plant Biology (2015) 15:223
Page 9 of 15
Table 2 Names, NCBI and CRIBI accession numbers and EST and splice variant numbers of the cytokinin-related grapevine sequences
identified in this study (Continued)
VviRR34
XM_002284468
1
VIT_218s0001g02540
VviRR35
XM_002273954
7
VviRR36
XM_002266214
0
VviRR37
XM_002268316
4
VIT_213s0067g03510
1
1
VviRR38
XM_002267339
0
VIT_213s0067g03450
1
1
VviRR39
XM_002267896
2
VIT_213s0067g03490
1
1
VviRR40
XM_003634849
0
VIT_213s0067g03480
1
1
VviRR41
XM_002267368
8
VIT_213s0067g03430
1
1
VvRRa2
VvRRa4
1–4
1
VIT_208s0007g05390
1
1
VIT_213s0067g03460
1
1
Phylogenetic trees for each family, using grapevine and Arabidopsis nucleotide sequences, are shown in Additional files 3 and 4. Additional file 1 contains the
TAIR accession numbers of the Arabidopsis sequences used for the analyses. na, not applicable
a
names previously used by Fernandes et al. [109]
measured in several developmental stages of tomato and
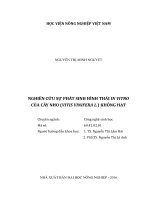
strawberry fruit (Fig. 4). In tomato, tZ concentrations were
generally below the limit of quantification and iP concentrations were below 1 pmol g−1 FW in all stages tested
(Fig. 4a). However, in red firm fruit, the iP concentration
was found to be significantly increased. In strawberry, tZ
could only be detected in receptacles of pre-ripening fruit
(Fig. 4b). In small green fruit the concentration of tZ was
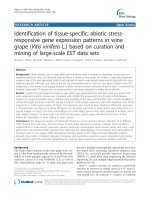
Fig. 3 Expression profiles of 46 cytokinin-related genes in different
Shiraz grapevine tissues. Heat map showing transcript levels of
cytokinin-related genes expressed in different tissues of either field
grown (flower, seeds, leaves, tendril, internode) or glasshouse grown
(root) Shiraz plants as determined by qRT-PCR. In order to adjust for
differences in absolute copy numbers between the genes, the mean
(n = 3 technical replicates) expression values for each transcript were
normalized by dividing by the maximum copy number obtained
from the tissue series, making all values fall between 0 and 1. Each
column represents a grapevine tissue, each row represents a gene
of interest. Hierarchical clustering was used to group genes with
similar expression profiles. Copy numbers for all expressed genes are
given in Additional files 6 and 7. F, flower; I, internode; L, leaf (node
indicated by number, increasing from the shoot apex); R, root; S,
seed (wpf indicated by number); T, tendril
Fig. 4 Concentrations of iP and tZ in developing tomatoes and
strawberries. iP and tZ were analysed by LC-MS/MS in (a) small green
(SG), large green (LG), turning (Tur), red firm (RF) and red ripe
(RR) tomatoes and in (b) small green (SG), large green (LG), turning
(Tur) and red ripe (RR) strawberry receptacles with (+) and without (−)
achenes. tZ concentrations were below the limit of quantification in
tomato. FW, fresh weight; nd, not detected. Bars represent means ± SE
(n = 3) and are denoted by a different letter (a-d, iP; a’-b’, tZ) if the
means for each time point differed significantly (p <0.05) using
one-way ANOVA followed by Duncan’s post hoc test
Böttcher et al. BMC Plant Biology (2015) 15:223
significantly decreased by the removal of achenes prior to
cytokinin extraction. Similar to tomato, iP concentrations
in strawberry receptacles were low, but were found to be
significantly increased in turning fruit and were even
higher in fully mature, red ripe strawberries (Fig. 4b). At
this last developmental stage, achene-containing receptacles contained significantly higher concentrations of iP
than receptacles without achenes.
Discussion
Most of the published studies on cytokinins in fruit, including grape [23–25], strawberry [20], tomato [19], apple
[65], watermelon (Citrullus lanatus (Thunb.) Mansf.) [66],
Japanese pear (Pyrus serotina L.) [67] and persimmon
[68], have utilized bioassays, based on changes in cell proliferation or pigment accumulation, to determine the concentration of active cytokinins. Across all fruit species,
high cytokinin activity was reported in young fruit progressing through the cell division phase, whereas activities
were low or undetectable in ripening fruit. This seems
to contradict the ripening-associated increase in iP
concentrations reported for four grapevine cultivars
(Figs. 1 and 2a), tomato and strawberry (Fig. 4) in
this work, but it has to be considered that the above
mentioned bioassays were mostly using tZ, and never
iP, as the reference cytokinin. Detectable tZ concentrations were found to be restricted to pre-ripening
strawberries (Fig. 4) and in pre-veraison grapes, seeds
seemed to be the main tZ source as evidenced by a
high tZ concentration in seed-containing Pinot Noir
berry tissue at 6 wpf (Fig. 1c). The accumulation of
tZ during early grape seed development has previously been reported [69, 70]. Although both, tZ and
iP, are classified as cytokinins and only differ in the
hydroxylation of the side chain, they need to be considered as different and independent molecules in regard to their localization and transport within the
plant, signalling outputs and biological effects. In Arabidopsis, recent experiments with mutants impaired
in the trans-hyroxylation step that converts iP to tZ
have revealed that the regulation of cell proliferation
in the shoot apical meristem is a function exclusive
to tZ [71]. In further support of a functional specification, Takei et al. [9] have reported that application
of Z-type cytokinins to maize (Zea mays L.) leaves
led to the induction of ZmRR1, whereas no changes
in ZmRR1 expression were observed in response to
iP-type cytokinins. In addition, CHK receptors [72–75]
and members of the CKX degradation pathway [57, 76]
were reported to differ in their preference for iP and tZ. A
different role for tZ and iP in the long distance signalling
pathways of plants has long been discussed since xylem
sap has been found to mainly contain tZ in the form of its
ribosides and ribotides [9, 77, 78], whereas iP ribosides
Page 10 of 15
and ribotides seem to be transported through the phloem
[78, 79]. From the evidence listed above it is therefore
feasible that changes in fruit iP concentrations have previously escaped detection due to lack of activity of this cytokinin in the chosen bioassays. However, from the few
examples where iP has been quantified throughout the development of fleshy fruit, grapes ([38]; this study) were
shown to accumulate up to 100-fold more iP during the
ripening phase than tomato (this study), strawberry (this
study) and kiwifruit [21, 37] and no increase in iP concentration was detected during the transition from pink to
red raspberries [22]. iP concentrations in tomato, strawberry and kiwifruit fall into a similar range to what has
been published for Arabidopsis seedlings [80, 81], maize
roots, leaves and kernels [82], young ‘Microtom’ tomato
ovaries [83], rice inflorescence meristem [14] and various
soybean (Glycine max (L.) Merr.) tissues [84], whereas the
iP quantities detected in grape berries are unprecedented.
This points to a specific relevance for iP accumulation in
grapes and might be related to the expansion-driven postveraison growth and the high rate of sugar accumulation
in these berries [85]. A study utilizing data from eight independent Arabidopsis microarray experiments revealed
the induction of 12 expansins and 18 other cell-wallrelated genes by cytokinins [86], confirming previously
reported cytokinin-induced changes of cell wall characteristics, such as increased extensibility [87], or decreased thickness [88]. It is therefore possible that the post-veraison
expansion of berry cells is at least in part controlled by the
observed changes in iP concentrations. The induction of
cell wall invertase genes and the large number of cytokininregulated genes involved in trehalose-6-phosphate metabolism [86] further indicate a possible role for iP in the maintenance of sink strength in ripening berries. Cytokinins are
known as positive regulators of sink strength in vegetative
organs, attracting carbohydrates and amino acids from
source tissues to sites of high cytokinin concentration
[89–92]. Studies on Chenopodium rubrum L. cell suspension cultures [93] and leaf senescence in tobacco (Nicotiana
tabacum L.) [4, 94] have suggested that sink strength
is likely to be mediated by cytokinin-inducible cell
wall invertases and hexose transporters, which are
functionally linked to the apoplastic phloem unloading
pathway and hence to the maintenance of a sucrose gradient between source and sink organs [95]. In grapes, a shift
from symplastic to apoplastic phloem unloading, coinciding with the start of the ripening phase and the increased
expression of invertases and hexose transporters, has
been described [96, 97]. In support of a possible role
of iP in the maintenance of post-veraison berries as
strong sink organs, a cell wall invertase gene with an
expression profile resembling the post-veraison pattern of iP accumulation has been reported in Cabernet
Sauvignon [98, 99].
Böttcher et al. BMC Plant Biology (2015) 15:223
The causal connection for the large variation in maximal
iP concentration between different grapevine cultivars
observed in this study (Figs. 1 and 2a, Table 1) is unknown
and will require further investigation, but genetic as well
as environmental factors are likely contributors. The welldescribed stimulatory effect of cytokinins on anthocyanin
accumulation in a number of plant species [100–102] suggested a possible link between the post-veraison accumulation of iP and anthocyanins in red cultivars. However, iP
data obtained from red and white skinned cultivars at a
similar berry sugar level, showed that, although the three
cultivars with the highest iP concentrations were red
skinned, a clear distinction between red and white skinned
cultivars could not be made. For example, the iP concentration of Rubired berries, which in addition to the skin
also produce anthocyanins in the flesh, could not be
distinguished from white cultivars with low iP concentrations, e.g. Riesling or Viognier (Table 1).
A number of cytokinin nucleobases, ribosides and
ribotides, including low levels of iP-type cytokinins, have
been detected in the bleeding sap of Shiraz vines at
budbreak [103] and it cannot be excluded that the postveraison iP accumulation reported in this study (Figs. 1
and 2a) was the result of iP import from the phloem.
However, the spatial expression patterns of cytokininrelated genes in tomato [83] and kiwifruit [37] indicated
that local cytokinin biosynthesis and degradation occur
in fruit and play an important role in fruit development.
This was also confirmed in grapes, where genes regulating cytokinin biosynthesis (IPTs), activation (LOGs), degradation (CKXs), perception (CHKs) and signalling (RRs)
were found to be expressed in all stages of berry development (Fig. 2b, Additional file 5). Transcripts of all
eight grapevine IPTs (Table 2) were detected in berries.
Five of them (IPT10-14) were restricted to pre-veraison
stages, the other three (IPT2, IPT9, IPT15) were expressed
pre- and post-veraison, including during the time of iP
accumulation (Fig. 2). The expression of specific IPT genes
at certain developmental stages seems to be highly regulated since IPT12, which peaked between 5 and 8 wpf, has
been described as the target of two siRNAs in postveraison berries leading to post-transcriptional silencing
[104]. The increased expression of the two tRNA-IPTs
(IPT2, IPT9) in post-veraison berries might reflect a bigger
contribution of tRNA-hydrolysis to the cytokinin pool in
these later stages of berry development, which could
produce cZ and iP [54]. However, as was the case in a
previous study [38], cZ concentrations in Shiraz berries
remained below the detection limit throughout berry development (data not shown). Judging from the expression
of IPT genes in other grapevine organs (Fig. 3 and
Additional file 6) and in agreement with reports from
Arabidopsis [105], tomato [83] and soybean [84], local
cytokinin biosynthesis seemed to occur throughout the
Page 11 of 15
plant, in particular in roots, tendrils, and mature leaves.
The LOG-dependent pathway of producing active cytokinin
nucleobases from ribotide precursors has recently been
established as the dominant cytokinin-activating mechanism in rice [55] and Arabidopsis [106]. It also appeared to
be active early (1–3 wpf) and late (9–16 wpf) in berry development, since LOG12 and LOG17 were expressed in
pre- and post-veraison fruit, four additional LOGs were
expressed during the pre-veraison stages and expression of
LOG5a and LOG14 was post-veraison-specific (Fig. 2b)
with the transcript accumulation of LOG5a closely matching the pattern of iP increase (Fig. 2). All ten LOG genes
(Table 2) were found to be expressed with distinct patterns
in at least one of the grapevine tissues tested, with predominant transcript accumulation in the same organs as IPTs
(Fig. 3 and Additional file 6).
The irreversible degradation of cytokinins by CKX
enzymes is a vital part of the regulation of local cytokinin concentrations [107] and in grape berries seemed to
be restricted to early developmental stages (1–4 wpf,
Fig. 2a). The progressive decrease of CKX5 transcripts has
previously been reported in two microarray studies investigating transcriptional changes in developing grape
berries [99, 108]. The lack of cytokinin degradation in
post-veraison grapes might contribute to the large increase in iP concentrations, especially since iP has
been found to be more susceptible to CKX-catalysed
degradation than other cytokinins [57, 76].
All three grapevine cytokinin receptor genes (Table 2)
were expressed in every tissue (Fig. 3 and Additional file 6)
and berry developmental stage analysed (Fig. 2b), but
whilst CHK3 and CHK4 showed higher transcript accumulation in pre-veraison berries, CHK2 was characterised
by a significant increase in expression during the late,
high-iP, post-veraison phase. The Arabidopsis orthologue
of VviCHK2 has been reported to preferentially bind iP,
whereas the other two receptors preferred tZ [74]. The
post-veraison increase in expression of CHK2 might therefore represent an amplifier for the orchestration of iPspecific responses during the ripening phase. Supporting
this hypothesis is the expression of a set of post-veraisonspecific RRs, including four B-type RRs (RR11a, RR11b,
RR27, RR29) and three A-type RRs (RR31, RR35, RR37)
which could translate the iP signal into a ripening-specific,
transcriptional response (Table 2 and Fig. 2b). Preveraison berries were characterised by the expression
of a separate set of RR genes (two B-type RRs, four
A-type RRs), whereas no RR gene with significant transcript accumulation in both pre- and post-veraison berry
stages was identified (Table 2 and Fig. 2b). In other grapevine organs, roots showed the overall highest expression
of RRs, but RR transcripts were found in all tested tissues,
with nine RRs expressed ubiquitously and nine RRs
restricted to specific organs (Fig. 3 and Additional file 7).
Böttcher et al. BMC Plant Biology (2015) 15:223
Conclusions
The present study provides evidence for the occurrence
of a ripening-associated increase in iP concentrations in
a number of different grapevine cultivars, strawberry
and tomato and therefore suggests a universal role for
this cytokinin in the regulation of fruit ripening processes. The unusually high concentrations of iP found in
post-veraison grape berries suggest a specific relevance
for iP accumulation in these fruit, possibly related to the
equally high concentrations of sugar stored in grapes.
Developmental changes in the expression of genes related to cytokinin biosynthesis, activation, perception,
signalling and catabolism indicate that the regulation of
berry cytokinin concentrations and the response to
specific cytokinin species can be controlled locally and
provide a possible explanation for the post-veraison accumulation of iP. Distinct expression patterns within
each gene family in berries and a range of other grapevine tissues suggest spatial and temporal specification
and hence a highly complex system for the regulation of
cytokinin concentrations and responses.
Availability of supporting data
All supporting data are included as additional files.
Additional files
Additional file 1: TAIR accession numbers of the Arabidopsis
nucleotide sequences used for phylogenetic analyses. (PDF 33 kb)
Additional file 2: Gene-specific primer pairs used for qRT-PCR
analyses. (PDF 59 kb)
Additional file 3: Phylogenetic relationship of IPT, LOG, CKX and
CHK coding sequences from grapevine and Arabidopsis. Unrooted
trees of (A) IPT, (B) LOG, (C) CKX and (D) CHK sequences were generated
from alignments created with MUSCLE [45], all positions containing gaps
and missing data were eliminated. The evolutionary history was inferred by
using the Maximum Likelihood method based on the JTT matrix-based
model [46]. A bootstrap consensus tree was generated from 100 replicates
[47] and branches corresponding to partitions replicated in less than 70 %
replicates were collapsed. Initial tree(s) for the heuristic search were obtained
automatically by applying Neighbor-Join and BioNJ algorithms to a matrix of
pairwise distances estimated using a JTT model and then selecting
the topology with superior log value. The coding data was translated
assuming a standard genetic code table. The naming of grapevine
genes followed the guidelines published by Grimplet et al. [48].
Grapevine sequences are highlighted with a grey background. NCBI or TAIR
accession numbers for all sequences used in the phylogenetic analysis are
listed in Table 2 and Additional file 1. (PDF 52 kb)
Additional file 4: Phylogenetic relationship of RR coding sequences
from grapevine and Arabidopsis. The unrooted tree was generated
from an alignment created with MUSCLE [45], all positions containing
gaps and missing data were eliminated. The evolutionary history was
inferred by using the Maximum Likelihood method based on the JTT
matrix-based model [46]. A bootstrap consensus tree was generated from
100 replicates [47] and branches corresponding to partitions replicated in
less than 70 % replicates were collapsed. Initial tree(s) for the heuristic
search were obtained automatically by applying Neighbor-Join and BioNJ
algorithms to a matrix of pairwise distances estimated using a JTT model
and then selecting the topology with superior log value. The coding data
was translated assuming a standard genetic code table. The naming of
grapevine genes followed the guidelines published by Grimplet et al. [48].
Page 12 of 15
Grapevine sequences are highlighted with a grey background. NCBI or TAIR
accession numbers for all sequences used in the phylogenetic analysis are
listed in Table 2 and Additional file 1. (PDF 31 kb)
Additional file 5: Transcript accumulation of cytokinin-related genes
expressed at two or more time points in a Shiraz berry developmental
series. The expression of (A) IPT, (B) LOG, (C) CKX, (D) RR and (E) pre-veraisonspecific genes was analysed by qRT-PCR. All data represent means
(n = 3) ± SE and LSD values were determined at the p <0.05 significance
level. Asterisks mark samples in which expression could not be detected.
(PDF 188 kb)
Additional file 6: Transcript accumulation of IPT, LOG, CKX and CHK
genes in different Shiraz tissues. The expression of (A) IPT, (B) LOG,
(C) CKX and (D) CHK genes was analysed by qRT-PCR. All data represent
means ± SE (n = 3 technical replicates). Asterisks mark tissues in which
expression could not be detected. F, flower; I, internode; L, leaf (node
indicated by number); R, root; S, seed (wpf indicated by number);
T, tendril. (PDF 493 kb)
Additional file 7: Transcript accumulation of RR genes in different
Shiraz tissues. The expression of RR genes was analysed by qRT-PCR. All
data represent means ± SE (n = 3 technical replicates). Asterisks mark tissues
in which expression could not be detected. F, flower; I, internode; L, leaf
(node indicated by number); R, root; S, seed (wpf indicated by number);
T, tendril. (PDF 310 kb)
Abbreviations
ACT: Actin; ANOVA: Analysis of variance; CHK: Cytokinin histidine kinase;
CKX: Cytokinin oxidase/dehydrogenase; CPPU: N-(2-Chloro-4-pyridinyl)-N’phenylurea; ESI: Electrospray ionization; F: Flower; FW: Fresh weight;
HPLC: High performance liquid chromatography; I: Internode; iP: N6-(Δ2Isopentenyl)-adenine; IPT: Isopentenyltransferase; L: Leaf; LC-MS: Liquid
chromatography-mass spectrometry; LG: Large green (tomato ripening stage);
LOG: LONLEY GUY; LSD: Least significant difference; MS/MS: Tandem mass
spectrometry; NA: Not applicable; ND: Not detected; qRT-PCR: Quantitative real
time polymerase chain reaction; R: Root; RF: Red firm (tomato ripening stage);
RR: Response regulator or Red ripe (tomato ripening stage); S: Seed; SE: Standard
error; SG: Small green (tomato ripening stage); SPE: Solid phase extraction;
T: Tendril; TDZ: Thidiazuron; TSS: Total soluble solids; Tur: Turning (tomato
ripening stage); WPF: Weeks post flowering; cZ: cis-Zeatin; tZ: trans-Zeatin.
Competing interests
The authors declare that they have no competing interests.
Authors’ contributions
All authors contributed to the sampling and processing of tissue samples
derived from field-grown and glasshouse-grown plants. CB participated in
the design of the study, carried out the phylogenetic analyses, primer design
and cytokinin measurements and drafted the manuscript. CAB carried out
the qRT-PCR analyses and participated in the cytokinin extractions.
PKB participated in the design of the study and performed the statistical
analyses. CD conceived of the study and participated in its design and
coordination. All authors read and approved the final manuscript.
Acknowledgements
The authors would like to thank Angela Keulen, Sue Maffei and Emily Nicholson
for technical assistance. We also thank Chalk Hill Wines and Yalumba Wines for
providing the fruit used in this study. This project was partly funded by
Australia’s grape growers and winemakers through their investment body the
Australian Grape and Wine Authority (grant no. CSP 09/05 and 14/01) with
matching funding from the Australian Federal Government. CSIRO Agriculture
Flagship is a partner of the Wine Innovation Cluster.
Received: 18 June 2015 Accepted: 10 September 2015
References
1. Mok DW, Mok MC. Cytokinin metabolism and action. Annu Rev Plant
Physiol Plant Mol Biol. 2001;52:89–118.
2. Sakakibara H. Cytokinins: activity, biosynthesis, and translocation. Annu Rev
Plant Biol. 2006;57:431–49.
Böttcher et al. BMC Plant Biology (2015) 15:223
3.
4.
5.
6.
7.
8.
9.
10.
11.
12.
13.
14.
15.
16.
17.
18.
19.
20.
21.
22.
23.
24.
25.
26.
27.
28.
29.
Amasino R. 1955: Kinetin arrives. The 50th anniversary of a new plant
hormone. Plant Physiol. 2005;138:1177–84.
Gan S, Amasino RM. Inhibition of leaf senescence by autoregulated
production of cytokinin. Science. 1995;270:1986–8.
Kim HJ, Ryu H, Hong SH, Woo HR, Lim PO, Lee IC, et al. Cytokinin-mediated
control of leaf longevity by AHK3 through phosphorylation of ARR2 in
Arabidopsis. Proc Natl Acad Sci U S A. 2006;103:814–9.
Werner T, Motyka V, Laucou V, Smets R, Van Onckelen H, Schmülling T.
Cytokinin-deficient transgenic Arabidopsis plants show multiple
developmental alterations indicating opposite functions of cytokinins in the
regulation of shoot and root meristem activity. Plant Cell. 2003;15:2532–50.
Werner T, Motyka V, Strnad M, Schmülling T. Regulation of plant growth by
cytokinin. Proc Natl Acad Sci. 2001;98:10487–92.
Samuelson ME, Larsson C-M. Nitrate regulation of zeation riboside levels in
barley roots: Effects of inhibitors of N assimilation and comparison with
ammonium. Plant Sci. 1993;93:77–84.
Takei K, Sakakibara H, Taniguchi M, Sugiyama T. Nitrogen-dependent
accumulation of cytokinins in root and the translocation to leaf: Implication
of cytokinin species that induces gene expression of maize response
regulator. Plant Cell Physiol. 2001;42:85–93.
Argueso CT, Ferreira FJ, Kieber JJ. Environmental perception avenues: the
interaction of cytokinin and environmental response pathways. Plant Cell
Environ. 2009;32:1147–60.
Cooper JB, Long SR. Morphogenetic rescue of Rhizobium meliloti nodulation
mutants by trans-zeatin secretion. Plant Cell. 1994;6:215–25.
Sasaki T, Suzaki T, Soyano T, Kojima M, Sakakibara H, Kawaguchi M. Shootderived cytokinins systemically regulate root nodulation. Nat Commun.
2014;5:4983 doi:10.1038/ncomms5983.
Kudo T, Kiba T, Sakakibara H. Metabolism and long-distance translocation of
cytokinins. J Integr Plant Biol. 2010;52:53–60.
Ashikari M, Sakakibara H, Lin S, Yamamoto T, Takashi T, Nishimura A, et al.
Cytokinin oxidase regulates rice grain production. Science. 2005;309:741–5.
Bartrina I, Otto E, Strnad M, Werner T, Schmülling T. Cytokinin regulates the
activity of reproductive meristems, flower organ size, ovule formation, and
thus seed yield in Arabidopsis thaliana. Plant Cell. 2011;23:69–80.
Quesnelle PE, Emery RJN. cis-Cytokinins that predominate in Pisum sativum
during early embryogenesis will accelerate embryo growth in vitro. Can J
Bot. 2007;85:91–103.
Emery RJN, Ma Q, Atkins CA. The forms and sources of cytokinins in
developing white lupine seeds and fruits. Plant Physiol. 2000;123:1593–604.
Tarkowski P, Tarkowská D, Novák O, Mihaljević S, Magnus V, Strnad M, et al.
Cytokinins in the perianth, carpels, and developing fruit of Helleborus niger
L. J Exp Bot. 2006;57:2237–47.
Desai N, Chism GW. Changes in cytokinin activity in the ripening tomato
fruit. J Food Sci. 1978;43:1324–6.
Lis EK, Borkowska B, Antoszewski R. Growth regulators in the strawberry
fruit. Fruit Science Reports. 1978;5:17–29.
Lewis DH, Burge GK, Hopping ME, Jameson PE. Cytokinins and fruit
development in the kiwifruit (Actinidia deliciosa). II. Effects of reduced
pollination and CPPU application. Physiol Plant. 1996;98:187–95.
Miret J, Cela J, Bezerra L, Arrom L, Juvany M, Müller M, et al. Application of a
rapid and sensitive method for hormonal and vitamin E profiling reveals
crucial regulatory mechanisms in flower senescence and fruit ripening.
J Plant Growth Regul. 2014;33:34–43.
Alleweldt G, Duering H, Waits G. Untersuchungen zum mechanismus der
zuckereinlagerung in die wachsenden weinbeeren. Angew Bot.
1975;49:65–73.
Chacko EK, Saidha T, Swamy RD, Reddy YN, Kohli RR. Studies on cytokinins
in fruits 1: occurrence and levels of cytokinin-like substances in grape
berries at different developmental stages. Vitis. 1976;15:221–6.
Inaba A, Ishida M, Sobajima Y. Changes in endogenous hormone
concentrations during berry development in relation to the ripening of
Delaware grapes. J Jpn Soc Hortic Sci. 1976;45:245–52.
Gillaspy G, Ben-David H, Gruissem W. Fruits - a developmental perspective.
Plant Cell. 1993;5:1439–51.
Srivastava A, Handa A. Hormonal regulation of tomato fruit development: a
molecular perspective. J Plant Growth Regul. 2005;24:67–82.
Zabadal TJ, Bukovac MJ. Effect of CPPU on fruit development of selected
seedless and seeded grape cultivars. HortSci. 2006;41:154–7.
Kim JG, Takami Y, Mizugami T, Beppu K, Fukuda T, Kataoka I. CPPU application
on size and quality of hardy kiwifruit. Sci Hortic. 2006;110:219–22.
Page 13 of 15
30. NeSmith DS. Response of rabbiteye blueberry (Vaccinium ashei Reade) to
the growth regulators CPPU and gibberellic acid. HortSci. 2002;37:666–8.
31. Stern RA, Ben-Arie R, Neria O, Flaishman M. CPPU and BA increase fruit size
of ‘Royal Gala’ (Malus domestica) apple in a warm climate. Journal of
Horticultural Science and Biotechnology. 2003;78:297–302.
32. Flaishman MA, Shargal A, Stern RA. The synthetic cytokinin CPPU increases
fruit size and yield of ‘Spadona’ and ‘Costia’ pear (Pyrus communis L.).
J Hortic Sci Biotechnol. 2001;76:145–9.
33. Davies C, Böttcher C. Other hormone signals during ripening. In: Nath P,
Bouzayen M, Matto A, Pech JC, editors. Fruit ripening: physiology, signalling
and genomics. United Kingdom: CABI publishers; 2014. p. 202–16.
34. Peppi MC, Fidelibus MW. Effects of forchlorfenuron and abscisic acid on the
quality of ‘Flame Seedless’ grapes. HortSci. 2008;43:173–6.
35. Famiani F, Battistelli A, Moscatello S, Boco M, Antognozzi E. Thidiazuron
affects fruit growth, ripening and quality of Actinidia deliciosa. J Hortic Sci
Biotechnol. 1999;74:375–80.
36. Itai A, Tanabe K, Tamura F, Susaki S, Yonemori K, Sugiura A. Synthetic
cytokinins control persimmon fruit shape, size and quality. J Hortic Sci.
1995;70:867–73.
37. Pilkington SM, Montefiori M, Galer AL, Emery RJN, Allan AC, Jameson PE.
Endogenous cytokinin in developing kiwifruit is implicated in maintaining
fruit flesh chlorophyll levels. Ann Bot. 2013;112:57–68.
38. Böttcher C, Boss PK, Davies C. Increase in cytokinin levels during ripening in
developing Vitis vinifera cv. Shiraz berries. Am J Enol Vitic. 2013;64:527–31.
39. Böttcher C, Burbidge CA, di Rienzo V, Boss PK, Davies C. Jasmonic acidisoleucine formation in grapevine (Vitis vinifera L.) by two enzymes with
distinct transcription profiles. J Integr Plant Biol. 2015;57:618–27.
40. Kalua CM, Boss PK. Evolution of volatile compounds during the
development of Cabernet Sauvignon grapes (Vitis vinifera L.). J Agric Food
Chem. 2009;57:3818–30.
41. Kalua CM, Boss PK. Comparison of major volatile compounds from Riesling
and Cabernet Sauvignon grapes (Vitis vinifera L.) from fruitset to harvest.
Aust J Grape Wine Res. 2010;16:337–48.
42. Böttcher C, Keyzers RA, Boss PK, Davies C. Sequestration of auxin by the
indole-3-acetic acid-amido synthetase GH3-1 in grape berry (Vitis vinifera L.)
and the proposed role of auxin conjugation during ripening. J Exp Bot.
2010;61:3615–25.
43. Davies C, Nicholson EL, Böttcher C, Burbidge CA, Bastian SEP, Harvey KE,
et al. Shiraz wines made from grape berries (Vitis vinifera) delayed in
ripening by plant growth regulator treatment have elevated rotundone
concentrations and “pepper” flavor and aroma. J Agric Food Chem.
2015;63:2137–44.
44. Tamura K, Stecher G, Peterson D, Filipski A, Kumar S. MEGA6: molecular
evolutionary genetics analysis version 6.0. Mol Biol Evol. 2013;30:2725–9.
45. Edgar RC. MUSCLE: multiple sequence alignment with high accuracy and
high throughput. Nucleic Acids Res. 2004;32:1792–7.
46. Jones DT, Taylor WR, Thornton JM. The rapid generation of mutation data
matrices from protein sequences. Comput Appl Biosci. 1992;8:275–82.
47. Felsenstein J. Confidence limits on phylogenies: an approach using the
bootstrap. Evolution. 1985;39:783–91.
48. Grimplet J, Adam-Blondon A-F, Bert P-F, Bitz O, Cantu D, Davies C, et al. The
grapevine gene nomenclature system. BMC Genomics. 2014;15:1077.
49. Böttcher C, Burbidge CA, Boss PK, Davies C. Interactions between ethylene
and auxin are crucial to the control of grape (Vitis vinifera L.) berry ripening.
BMC Plant Biol. 2013;13:222.
50. Böttcher C, Boss PK, Davies C. Acyl substrate preferences of an IAA-amido
synthetase account for variations in grape (Vitis vinifera L.) berry ripening
caused by different auxinic compounds indicating the importance of auxin
conjugation in plant development. J Exp Bot. 2011;62:4267–80.
51. Kakimoto T. Identification of plant cytokinin biosynthetic enzymes as
dimethylallyl diphosphate:ATP/ADP Isopentenyltransferases. Plant Cell
Physiol. 2001;42:677–85.
52. Takei K, Sakakibara H, Sugiyama T. Identification of genes encoding
adenylate isopentenyltransferase, a cytokinin biosynthesis enzyme, in
Arabidopsis thaliana. J Biol Chem. 2001;276:26405–10.
53. Takei K, Yamaya T, Sakakibara H. Arabidopsis CYP735A1 and CYP735A2
encode cytokinin hydroxylases that catalyze the biosynthesis of trans-zeatin.
J Biol Chem. 2004;279:41866–72.
54. Murai N. Cytokinin biosynthesis in tRNA and cytokinin incorporation into
plant RNA. In: Mok DWS, Mok MC, editors. Cytokinins: chemistry, activity,
and function. Boca Raton, Fla: CRC Press; 1994.
Böttcher et al. BMC Plant Biology (2015) 15:223
55. Kurakawa T, Ueda N, Maekawa M, Kobayashi K, Kojima M, Nagato Y, et al.
Direct control of shoot meristem activity by a cytokinin-activating enzyme.
Nature. 2007;445:652–5.
56. Hare PD, van Staden J. Cytokinin oxidase: biochemical features and
physiological significance. Physiol Plant. 1994;91:128–36.
57. Galuszka P, Popelková H, Werner T, Frébortová J, Pospíšilová H, Mik V, et al.
Biochemical characterization of cytokinin oxidases/dehydrogenases from
Arabidopsis thaliana expressed in Nicotiana tabacum L. J Plant Growth
Regul. 2007;26:255–67.
58. Hwang I, Sheen J. Two-component circuitry in Arabidopsis cytokinin signal
transduction. Nature. 2001;413:383–9.
59. D’Agostino IB, Kieber JJ. Phosphorelay signal transduction: the emerging
family of plant response regulators. Trends Biochem Sci. 1999;24:452–6.
60. D’Agostino IB, Deruère J, Kieber JJ. Characterization of the response of the
Arabidopsis response regulator gene family to cytokinin. Plant Physiol.
2000;124:1706–17.
61. Imamura A, Hanaki N, Nakamura A, Suzuki T, Taniguchi M, Kiba T, et al.
Compilation and characterization of Arabiopsis thaliana response regulators
implicated in His-Asp phosphorelay signal transduction. Plant Cell Physiol.
1999;40:733–42.
62. Yamada H, Suzuki T, Terada K, Takei K, Ishikawa K, Miwa K, et al. The Arabidopsis
AHK4 histidine kinase is a cytokinin-binding receptor that transduces cytokinin
signals across the membrane. Plant Cell Physiol. 2001;42:1017–23.
63. Choi J, Hwang I. Cytokinin: perception, signal transduction, and role in plant
growth and development. J Plant Biol. 2007;50:98–108.
64. Vitulo N, Forcato C, Carpinelli EC, Telatin A, Campagna D, D’Angelo M, et al.
A deep survey of alternative splicing in grape reveals changes in the
splicing machinery related to tissue, stress condition and genotype. BMC
Plant Biol. 2014;14:99.
65. Letham DS, Williams MW. Regulators of cell division in plant tissues VIII. The
cytokinins of the Apple fruit. Physiol Plant. 1969;22:925–36.
66. Prakash R, Maheshwari SC. Studies on cytokinins in Watermelon seeds.
Physiol Plant. 1970;23:792–9.
67. Ohkawa M. Studies on growth of Japanese pear fruits. I. Isolation of zeatin
and its related compound from immature Japanese pear fruits. J Jpn Soc
Hortic Sci. 1973;42:183–7.
68. Sobajima Y, Ishida M, Inaba A, Horiguchi H. Studies on the fruit
development of Japanese persimmon (Diospyros kaki L.) I. Cytokinin activity
in young fruits. J Jpn Soc Hortic Sci. 1974;43:224–8.
69. Pandey SN, Singh R. Endogenous level of hormones in developing grape
seed Vitis vinifera Linn. Indian J Plant Physiol. 1989;32:299–305.
70. Zhang X, Luo G, Wang R, Wang J, Himelrick DG. Growth and developmental
responses of seeded and seedless grape berries to shoot girdling. J Am Soc
Hortic Sci. 2003;128:316–23.
71. Kiba T, Takei K, Kojima M, Sakakibara H. Side-chain modification of
cytokinins controls shoot growth in Arabidopsis. Dev Cell. 2013;27:452–61.
72. Romanov GA, Lomin SN, Schmülling T. Biochemical characteristics and
ligand-binding properties of Arabidopsis cytokinin receptor AHK3 compared to
CRE1/AHK4 as revealed by a direct binding assay. J Exp Bot. 2006;57:4051–8.
73. Stolz A, Riefler M, Lomin SN, Achazi K, Romanov GA, Schmülling T. The
specificity of cytokinin signalling in Arabidopsis thaliana is mediated by
differing ligand affinities and expression profiles of the receptors. Plant J.
2011;67:157–68.
74. Shi X, Rashotte A. Advances in upstream players of cytokinin phosphorelay:
receptors and histidine phosphotransfer proteins. Plant Cell Rep.
2012;31:789–99.
75. Choi J, Lee J, Kim K, Cho M, Ryu H, An G, et al. Functional identification of
OsHk6 as a homotypic cytokinin receptor in rice with preferential affinity for
iP. Plant Cell Physiol. 2012;53:1334–43.
76. Bilyeu KD, Cole JL, Laskey JG, Riekhof WR, Esparza TJ, Kramer MD, et al.
Molecular and biochemical characterization of a cytokinin oxidase from
Maize. Plant Physiol. 2001;125:378–86.
77. Beveridge CA, Murfet IC, Kerhoas L, Sotta B, Miginiac E, Rameau C. The
shoot controls zeatin riboside export from pea roots. Evidence from the
branching mutant rms4. Plant J. 1997;11:339–45.
78. Hirose N, Takei K, Kuroha T, Kamada-Nobusada T, Hayashi H, Sakakibara H.
Regulation of cytokinin biosynthesis, compartmentalization and
translocation. J Exp Bot. 2008;59:75–83.
79. Corbesier L, Prinsen E, Jacqmard A, Lejeune P, Van Onckelen H, Périlleux C,
et al. Cytokinin levels in leaves, leaf exudate and shoot apical meristem of
Arabidopsis thaliana during floral transition. J Exp Bot. 2003;54:2511–7.
Page 14 of 15
80. Kasahara H, Takei K, Ueda N, Hishiyama S, Yamaya T, Kamiya Y, et al. Distinct
isoprenoid origins of cis- and trans-zeatin biosyntheses in Arabidopsis. J Biol
Chem. 2004;279:14049–54.
81. Zhang X, Chen Y, Lin X, Hong X, Zhu Y, Li W, et al. Adenine phosphoribosyl
transferase 1 is a key enzyme catalyzing cytokinin conversion from
nucleobases to nucleotides in Arabidopsis. Mol Plant. 2013;6:1661–72.
82. Veach YK, Martin RC, Mok DWS, Malbeck J, Vankova R, Mok MC. O-Glucosylation
of cis-zeatin in Maize. Characterization of genes, enzymes, and endogenous
cytokinins. Plant Physiol. 2003;131:1374–80.
83. Matsuo S, Kikuchi K, Fukuda M, Honda I, Imanishi S. Roles and regulation of
cytokinins in tomato fruit development. J Exp Bot. 2012;63:5569–79.
84. Le DT, Nishiyama R, Watanabe Y, Vankova R, Tanaka M, Seki M, et al.
Identification and expression analysis of cytokinin metabolic genes in
soybean under normal and drought conditions in relation to cytokinin
levels. PLoS One. 2012;7:e42411.
85. Davies C, Boss PK, Gerós H, Lecourieux F, Delrot S: Source/sink relationships
and molecular biology of sugar accumulation in grape berries. In: The
Biochemistry of the Grape Berry. Edited by Gerós H, Chaves MM, Delrot S,
vol. 1: Bentham Science Publishers; 2012: 44–66.
86. Brenner WG, Ramireddy E, Heyl A, Schmülling T. Gene regulation by
cytokinin in Arabidopsis. Frontiers in Plant Science. 2012;3:8.
87. Thomas J, Ross CW, Chastain CJ, Koomanoff N, Hendrix JE, Van Volkenburgh E.
Cytokinin-induced wall extensibility in excised cotyledons of radish and
cucumber. Plant Physiol. 1981;68:107–10.
88. Jung KW, Seung-Ick O, Yun Young K, Kyoung Shin Y, Mei Hua C, Jeong SS.
Arabidopsis histidine-containing phosphotransfer factor 4 (AHP4) negatively
regulates secondary wall thickening of the anther endothecium during
flowering. Mol Cells. 2008;25:294–300.
89. Mothes K, Engelbrecht L. On the activity of a kinetin-like root factor. Life Sci.
1963;2:852–7.
90. Mothes K, Engelbrecht L, Schütte HR. Über die Akkumulation von
α-Aminoisobuttersäure im Blattgewebe unter dem Einfluss von Kinetin.
Physiol Plant. 1961;14:72–5.
91. Kuiper D. Sink strength: established and regulated by plant growth
regulators. Plant Cell Environ. 1993;16:1025–6.
92. Werner T, Holst K, Pörs Y, Guivarc’h A, Mustroph A, Chriqui D, et al.
Cytokinin deficiency causes distinct changes of sink and source parameters
in tobacco shoots and roots. J Exp Bot. 2008;59:2659–72.
93. Ehness R, Roitsch T. Co-ordinated induction of mRNAs for extracellular
invertase and a glucose transporter in Chenopodium rubrum by cytokinins.
Plant J. 1997;11:539–48.
94. Lara MEB, Garcia M-CG, Fatima T, Ehness R, Lee TK, Proels R, et al.
Extracellular invertase is an essential component of cytokinin-mediated
delay of senescence. Plant Cell. 2004;16:1276–87.
95. Ho LC. Partitioning of assimilates in fruiting tomato plants. Plant Growth
Regul. 1984;2:277–85.
96. Davies C, Wolf T, Robinson SP. Three putative sucrose transporters are
differentially expressed in grapevine tissues. Plant Sci. 1999;147:93–100.
97. Zhang X-Y, Wang X-L, Wang X-F, Xia G-H, Pan Q-H, Fan R-C, et al. A shift of
phloem unloading from symplasmic to apoplasmic pathway is involved in
developmental onset of ripening in grape berry. Plant Physiol. 2006;142:220–32.
98. Hayes MA, Davies C, Dry IB. Isolation, functional characterization, and
expression analysis of grapevine (Vitis vinifera L.) hexose transporters:
differential roles in sink and source tissues. J Exp Bot. 2007;58:1985–97.
99. Deluc L, Grimplet J, Wheatley M, Tillett R, Quilici D, Osborne C, et al.
Transcriptomic and metabolite analyses of Cabernet Sauvignon grape berry
development. BMC Genomics. 2007;8:429.
100. Nakamura N, Nakamae H, Maekawa S. Effects of light and kinetin on
anthocyanin accumulation in the petals of Rosa hybrida, Hort cv. Ehigasa. Z
Pflanzenphysiol. 1980;98:263–70.
101. Deikman J, Hammer PE. Induction of anthocyanin acumulation by
cytokinins in Arabidopsis thaliana. Plant Physiol. 1995;108:47–57.
102. Guo J, Hu X, Duan R. Interactive effects of cytokinins, light, and sucrose on
the phenotypes and the syntheses of anthocyanins and lignins in cytokinin
overproducing transgenic Arabidopsis. J Plant Growth Regul. 2005;24:93–101.
103. Field SK, Smith JP, Holzapfel BP, Hardie WJ, Emery RJN. Grapevine response
to soil temperature: xylem cytokinins and carbohydrate reserve mobilization
from budbreak to anthesis. Am J Enol Vitic. 2009;60:164–72.
104. Carra A, Mica E, Gambino G, Pindo M, Moser C, Pè ME, et al. Cloning
and characterization of small non-coding RNAs from grape. Plant J.
2009;59:750–63.
Böttcher et al. BMC Plant Biology (2015) 15:223
Page 15 of 15
105. Miyawaki K, Matsumoto-Kitano M, Kakimoto T. Expression of cytokinin
biosynthetic isopentenyltransferase genes in Arabidopsis: tissue specificity
and regulation by auxin, cytokinin, and nitrate. Plant J. 2004;37:128–38.
106. Kuroha T, Tokunaga H, Kojima M, Ueda N, Ishida T, Nagawa S, et al.
Functional analyses of LONELY GUY cytokinin-activating enzymes reveal the
importance of the direct activation pathway in Arabidopsis. Plant Cell.
2009;21:3152–69.
107. Werner T, Köllmer I, Bartrina I, Holst K, Schmülling T. New insights into the
biology of cytokinin degradation. Plant Biol. 2006;8:371–81.
108. Pilati S, Perazzolli M, Malossini A, Cestaro A, Demattè L, Fontana P, et al.
Genome-wide transcriptional analysis of grapevine berry ripening reveals a
set of genes similarly modulated during three seasons and the occurrence
of an oxidative burst at vèraison. BMC Genomics. 2007;8:428.
109. Fernandes J, Tavares S, Amâncio S. Identification and expression of cytokinin
signaling and meristem identity genes in sulfur deficient grapevine (Vitis
vinifera L.). Plant Signal Behav. 2009;4:1128–35.
Submit your next manuscript to BioMed Central
and take full advantage of:
• Convenient online submission
• Thorough peer review
• No space constraints or color figure charges
• Immediate publication on acceptance
• Inclusion in PubMed, CAS, Scopus and Google Scholar
• Research which is freely available for redistribution
Submit your manuscript at
www.biomedcentral.com/submit