Expression and testing in plants of ArcLight, a genetically–encoded voltage indicator used in neuroscience research
Bạn đang xem bản rút gọn của tài liệu. Xem và tải ngay bản đầy đủ của tài liệu tại đây (1.92 MB, 14 trang )
Matzke and Matzke BMC Plant Biology (2015) 15:245
DOI 10.1186/s12870-015-0633-z
METHODOLOGY ARTICLE
Open Access
Expression and testing in plants of ArcLight,
a genetically–encoded voltage indicator used in
neuroscience research
Antonius J.M. Matzke* and Marjori Matzke
Abstract
Background: It is increasingly appreciated that electrical controls acting at the cellular and supra-cellular levels influence
development and initiate rapid responses to environmental cues. An emerging method for non-invasive optical imaging
of electrical activity at cell membranes uses genetically-encoded voltage indicators (GEVIs). Developed by neuroscientists
to chart neuronal circuits in animals, GEVIs comprise a fluorescent protein that is fused to a voltage-sensing domain. One
well-known GEVI, ArcLight, undergoes strong shifts in fluorescence intensity in response to voltage changes in
mammalian cells. ArcLight consists of super-ecliptic (SE) pHluorin (pH-sensitive fluorescent protein) with an A227D
substitution, which confers voltage sensitivity in neurons, fused to the voltage-sensing domain of the voltage-sensing
phosphatase of Ciona intestinalis (Ci-VSD). In an ongoing effort to adapt tools of optical electrophysiology for plants, we
describe here the expression and testing of ArcLight and various derivatives in different membranes of root cells in
Arabidopsis thaliana.
Results: Transgenic constructs were designed to express ArcLight and various derivatives targeted to the plasma
membrane and nuclear membranes of Arabidopsis root cells. In transgenic seedlings, changes in fluorescence
intensity of these reporter proteins following extracellular ATP (eATP) application were monitored using a fluorescence
microscope equipped with a high speed camera. Coordinate reductions in fluorescence intensity of ArcLight and
Ci-VSD-containing derivatives were observed at both the plasma membrane and nuclear membranes following eATP
treatments. However, similar responses were observed for derivatives lacking the Ci-VSD. The dispensability of the
Ci-VSD suggests that in plants, where H+ ions contribute substantially to electrical activities, the voltage-sensing ability
of ArcLight is subordinate to the pH sensitivity of its SEpHluorin base. The transient reduction of ArcLight fluorescence
triggered by eATP most likely reflects changes in pH and not membrane voltage.
Conclusions: The pH sensitivity of ArcLight precludes its use as a direct sensor of membrane voltage in plants.
Nevertheless, ArcLight and derivatives situated in the plasma membrane and nuclear membranes may offer robust,
fluorescence intensity-based pH indicators for monitoring concurrent changes in pH at these discrete membrane
systems. Such tools will assist analyses of pH as a signal and/or messenger at the cell surface and the nuclear periphery
in living plants.
Keywords: ArcLight, Electrical signalling, Genetically-encoded voltage indicator, pH-sensitive indicator, Super ecliptic
pHluorin
* Correspondence:
Institute of Plant and Microbial Biology, Academia Sinica, 128, Section 2,
Academia Road, Nangang District, Taipei 115, Taiwan
© 2015 Matzke and Matzke. Open Access This article is distributed under the terms of the Creative Commons Attribution 4.0
International License ( which permits unrestricted use, distribution, and
reproduction in any medium, provided you give appropriate credit to the original author(s) and the source, provide a link to
the Creative Commons license, and indicate if changes were made. The Creative Commons Public Domain Dedication waiver
( applies to the data made available in this article, unless otherwise stated.
Matzke and Matzke BMC Plant Biology (2015) 15:245
Background
Growth, development and appropriate responses to the
environment require electrical controls and networks acting
at multiple levels of organization within cells, tissues and
whole organisms [1–3]. At the cellular level, changes in
transmembrane potentials (electrical voltage gradients) and
ion fluxes comprise an extensive system of bioelectrical
communication that is integrated with molecular, chemical
and mechanical signalling pathways [2, 4]. Together with
classical methods for monitoring membrane potentials such
as microelectrodes and patch clamp, a new generation of
electrophysiological tools is being developed based on the
concept of light-based or optical electrophysiology [4, 5].
An important group of these new tools consists of
genetically-encoded, protein-based voltage indicators [6–8].
Genetically-encoded voltage indicators (GEVIs) are composed of a fusion between a fluorescent protein (reporter)
and a voltage-sensing domain (detector) [8]. GEVIs
have been developed by neurobiologists over the last
two decades as a non-invasive method to optically
monitor changes in transmembrane potential in single
and multiple neurons and other cell types [6–9]. One type
of GEVI is based on Förster resonance energy transfer
(FRET) between a pair of fluorescent proteins joined to
a membrane-spanning voltage-sensing domain. Changes
in membrane potential are thought to act through the
voltage-sensing domain to induce more favourable alignment of the two fluorescent proteins, resulting in increased
FRET efficiency [8–10]. By contrast, in monochromatic
GEVIs, a transmembrane voltage-sensing domain is fused
to a single fluorescent protein that reacts to a voltage
change by showing alterations in fluorescence intensity.
This has been proposed to result when membrane
depolarization triggers movement of the voltage-sensing
domain, resulting in deformation of the linked fluorescent
protein in a manner that reduces fluorescence intensity [8].
One intensity-based GEVI is ArcLight [11, 12], which
consists of super-ecliptic (SE) pHluorin (pH-sensitive
fluorescent protein) [13, 14] containing an A227D substitution conferring voltage sensitivity in neurons [11]
and the voltage-sensing domain of the voltage-sensing
phosphatase of Ciona intestinalis (Ci-VSD) [15]. The
fluorescence intensity of ArcLight has been reported to
change significantly in response to voltage changes at
the plasma membrane in mammalian cells [12]. In one
study using human embryonic kidney (HEK293) cells,
the fluorescence intensity of ArcLight decreased 35 % in
response to a membrane depolarization of 100 mV [11].
One advantage of GEVIs as voltage indicators is that
they can be fused to defined membrane targeting motifs,
thus allowing electrophysiological analysis of internal
cellular membranes that are largely inaccessible to classical
tools for measuring membrane potential. Although the
membrane potentials of multiple cells can in principle be
Page 2 of 14
measured using microelectrode arrays [16, 17], GEVIs also
permit noninvasive detection of simultaneous changes in
membrane potentials in populations of cells in intact
tissues and organs [6].
We are interested in using GEVIs to study coordinated
changes in the electrical potentials of plasma membranes
and nuclear membranes of plant cells in response to environmental and developmental stimuli. Owing to their
low background fluorescence and interesting developmental features, root cells provide a good experimental
system for evaluating the feasibility of GEVIs to study
the electrical behavior of different membrane systems in
living plants [18]. We described previously the generation of transgenic Arabidopsis thaliana (Arabidopsis)
plants expressing FRET-based GEVIs in root cells [19].
FRET-based GEVIs are stably expressed and welltolerated by Arabidopsis and a recent study documents
the successful use of Mermaid FRET sensors to monitor
membrane voltage changes in response to exogenous
application of potassium in a plant system [20]. In view
of former findings for ArcLight in mammalian cells
showing large shifts in fluorescence intensity in response
to voltage changes [11, 12], we have assembled and introduced into Arabidopsis constructs encoding ArcLight
and several derivatives targeted to the plasma membrane
and nuclear membranes of root cells. Here we describe
the results of experiments designed to assess changes in
the fluorescence intensity of ArcLight and derivatives
situated in these two membrane systems in response to
external ATP (eATP) and other stimuli expected to trigger changes in transmembrane potential [21].
Results
Transgenic Arabidopsis plants expressing GEVIs and
derivatives in root cells
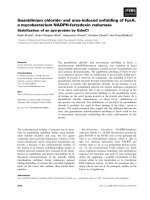
Diagrams of ArcLight [11, 12] and various derivatives used
in this study are depicted in Fig. 1a-f. The corresponding
transgenic constructs introduced into Arabidopsis are
shown in Fig. 2a-f. The predicted cellular locations of the
fluorescent protein reporter with respect to the specific
membrane targeting sequence are shown schematically in
Fig. 1g.
The fluorescent proteins tested include: classic ArcLight
(Fig. 1a), which - in the absence of any other membrane
targeting sequence - is directed to the plasma membrane
by the Ci-VSD (Fig. 1g, sector A); ArcLight joined at the
N-terminus to the WPP domain of Arabidopsis RAN
GTPASE ACTIVATING PROTEIN 1 (RANGAP1) (Fig. 1b)
[22, 23], which promotes targeting to the outer nuclear
membrane (Fig. 1g, sector B); and ArcLight fused at the
N-terminus to the Arabidopsis SAD1/UNC-84 DOMAIN
PROTEIN 2 (SUN2), which contains one transmembrane
domain (Fig. 1c) and is able to target the protein to the
inner nuclear membrane [24] (Fig. 1g, sector C).
Matzke and Matzke BMC Plant Biology (2015) 15:245
Page 3 of 14
A
D
B
E
C
F
INM
G
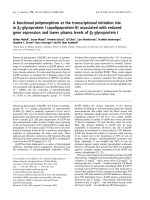
Fig. 1 Diagrams of GEVIs and derivatives used in this study and predicted membrane localizations. GEVIs include: A ArcLight, which consists of
SEpHluorinA227D fused to the Ci-VSD (transmembrane domains indicated as red bars with the voltage-sensing domain in S4); B ArcLight fused at
the N-terminus to outer nuclear membrane (ONM)-tethering sequence WPP; C ArcLight fused at the N-terminus to inner nuclear membrane
(INM) transmembrane protein SUN2. The derivatives, which do not contain Ci-VSD, include: D SEpHluorinA227D fused to the plasma membrane
(PM)-tethering sequence CBL1; E SEpHluorinA227D fused at the N-terminus to WPP; F SEpHluorinA227D fused at the N-terminus to SUN2. Part G
shows the predicted membrane localizations of these proteins. The sector letters A-F correspond to the diagram letters. The endoplasmic
reticulum (ER) is continuous with perinuclear space (PNS). For simplicity, nuclear pores are not shown. Drawing is not to scale
In other constructs, we tested the importance of the transmembrane Ci-VSD in voltage-sensing by replacing it with
either an Arabidopsis CALCINEURIN B-LIKE PROTEIN 1
(CBL1) plasma membrane targeting peptide [25] at the Nterminus (Fig. 1d), which situates the fluorescent reporter at
the cytoplasmic surface of the plasma membrane (Fig. 1g,
sector D); an N-terminal WPP domain (Fig. 1e), which
places the fluorescent reporter at the cytoplasmic
surface of the outer nuclear membrane (Fig. 1g, sector E); or an N-terminal fusion to inner nuclear
membrane protein SUN2 (Fig. 1f ), which positions
the fluorescent reporter in the perinuclear space
(Fig. 1g, sector F).
For comparative purposes, we used transgenic plants expressing the intensity-based free calcium concentration sensor Case12 (Calcium sensor 12) [26] (Fig. 2g) and mCitrine,
which has been modified to reduce environmental sensitivity
[27], joined to either Ci-VSD [28] (Fig. 2h) or CBL1 (Fig. 2i).
A GST-tagged SEpHluorinA227D (Fig. 2j) was expressed in
E. coli and isolated to test as a soluble variant of ArcLight.
Matzke and Matzke BMC Plant Biology (2015) 15:245
Page 4 of 14
a
Ubi10pro
Ci-VSD
b
Ubi10pro
WPP Ci-VSD
c
Ubi10pro
SUN2 Ci-VSD
d
Ubi10pro
CBL1 SEpHluorin A227D NOSter
CBL1-SEpHluorinA227D
e
Ubi10pro
WPP
SEpHluorin A227D NOSter
WPP-SEpHluorinA227D
f
Rps5pro
SUN2
g
Ubi10pro
h
Ubi10pro
Ci-VSD
i
Ubi10pro
CBL1
j
T7pro
Case12
GST
SEpHluorin A227D
NOSter
SEpHluorin A227D
SEpHluorin A227D
SEpHluorin A227D
3c ter
mCitrine
SEpHluorin A227D
NOSter
3c ter
WPP-ArcLight
SUN2-ArcLight
SUN2-SEpHluorinA227D
Case12
NOSter
mCitrine
ArcLight
3c ter
NOSter
T7 ter
Ci-VSD-mCitrine
CBL1-mCitrine
GST-SEpHluorinA227D
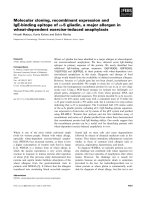
Fig. 2 Constructs used in this study. The construct letters (a-f) correspond to the diagram letters in Fig. 1. SEpHluorinA227D, Ci-VSD and Case12
are defined in the text. The CBL1 motif is a 12 amino acid sequence from the CBL1 protein that contains a myristolated glycine and a
palmitolated cysteine, which tether the fluorescent fusion protein to the cytoplasmic surface of the plasma membrane [25]. The WPP sequence, which
contains a Trp(W)-Pro(P)-Pro motif that is highly conserved in all land plants [22], consists of amino acids 28–131 of Arabidopsis RANGAP1 and is sufficient
for targeting fusion proteins to the outer nuclear membrane [23]. The SUN2 protein, which is 455 amino acids in length, has one transmembrane domain
that can localize SUN2-fusion proteins at the inner nuclear membrane surface [44, 45] . In constructs (a-f) and (g-i), the gene encoding the fluorescence
reporter is under the control of the ubiquitously-expressed Ubi10 plant promoter [39]. Construct F contains the root-specific Rps5 promoter
[40]. Ci-VSD-mCitrine corresponds to VSFP3.1_mCitrine [28]. The constructs (a-i) contain either the nopaline synthase (NOS) or 3C transcriptional terminator.
Construct (j) is designed for expression of GST-tagged SEpHluorinA227D in E. coli and contains the phage T7 promoter and terminator. The amino acid
sequences of SEpHluorinA227D and environmentally-insensitive monomeric (m)Citrine compared to wild-type GFP and SEpHluorin are shown in Additional
file 1: Figure S1. The constructs are not drawn to scale
The amino acid sequences of wild-type GPF, mCitrine,
SEpHluorin and SEpHluorinA227D are shown in Additional
file 1: Figure S1.
Transgenic Arabidopsis lines expressing ArcLight and
various derivatives in root cells were produced and
screened for strong and uniform expression levels of the
transgene throughout the area of the root under investigation (typically the transition zone extending into the root
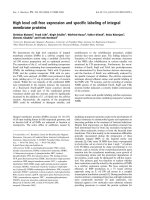
apical meristem) as well as for specificity of membrane targeting and absence of visible aggregate formation. As anticipated, ArcLight (Fig. 1a) and CBL1-SEpHluorinA227D
(Fig. 1d) were largely localized to the plasma membrane
(Fig. 3a and d) with particularly distinct and bright plasma
membrane fluorescence for CBL1-SEpHluorin, which lacks
the Ci-VSD. The WPP fusion proteins (WPP-ArcLight and
WPP-SEpHluorinA227D; Fig. 1b and e, respectively) were
visualized at the nuclear periphery but plasma membrane
localization was also observed (Fig. 3b and e, respectively),
particularly for WPP-ArcLight, which contains the Ci-VSD.
SUN2-SEpHluorinA227D, which lacks the Ci-VSD (Fig. 1f),
localized almost exclusively at the nuclear rim (Fig. 3f)
whereas SUN2-ArcLight, which contains the Ci-VSD
(Fig. 1c), accumulated at both the plasma membrane and
nuclear membrane and tended to aggregate (Fig. 3c). Thus,
the dominance of the Ci-VSD as a plasma membranetargeting motif reduced the preferential nuclear deposition
of fluorescent reporters containing an additional nuclear membrane targeting signal and increased the possibility of fluorescent protein aggregation. Nuclear membrane
targeting by SUN2 may be more specific than that achieved
with WPP because the former involves a transmembrane
domain whereas the latter is likely to associate more loosely
with the membrane through electrostatic interactions.
Transgenic plants expressing Case12 displayed diffuse
fluorescence that was particularly strong at the root tip
whereas fluorescence was localized at the plasma
membrane in root cells of transgenic plant expressing
Ci-VSD-mCitrine and CBL1-mCitrine (Additional file
2: Figure S2). Expression of ArcLight and derivatives
did not noticeably affect the phenotype of the transgenic plants, which grew and reproduced normally
(data not shown).
Matzke and Matzke BMC Plant Biology (2015) 15:245
Page 5 of 14
Fig. 3 Fluorescent confocal images of transgenic plant roots expressing plasma membrane and nuclear membrane-localized GEVIs and derivatives. Images
show the area of the root tip (meristem) and adjacent transition zone. The white bars on the bottom right indicate 100 μm. a ArcLight; b WPP-ArcLight;
c SUN2-ArcLight; d CBL1-SEpHluorinA227D; e WPP-SEpHluorinA277D; f SUN2-SEpHluorinA277D. The letters correspond to those in the diagrams and
constructs in Figs. 1 and 2, respectively
External ATP (eATP)
A previous study demonstrated that addition of 2 mM
extracellular ATP (eATP) to roots of plants expressing a
FRET-based calcium sensor elicited a large peak of fluorescence, indicative of increased intracellular free calcium,
followed by oscillations and a gradual recovery to approach
the baseline over a period of approximately 10 min [29].
We observed a similar response in root cells of transgenic
seedlings expressing the fluorescence intensity-based free
calcium sensor Case12 following the addition of 2 mM
eATP (Fig. 4, Case12). The expected response of Case12 to
eATP application validated our experimental system and
provided a known signal that could be compared to the responses of ArcLight and derivatives to eATP treatments.
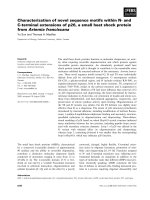
ArcLight displayed a different response from Case12, with
an initial small peak of fluorescence directly after eATP
addition followed by a rapid decrease in fluorescence and
gradual increase to approach the baseline (Fig. 4, ArcLight).
The experimental setup allowed the observation of simultaneous changes in fluorescence intensity of ArcLight in
multiple cells within the root (Fig. 5, top). Although the
decrease in fluorescence intensity of ArcLight would be
consistent with depolarization of the plasma membrane
[11, 12], replacing the transmembrane segment Ci-VSD with
Matzke and Matzke BMC Plant Biology (2015) 15:245
0 sec
Page 6 of 14
100 sec
145 sec
846 sec
100 sec
205 sec
920 sec
Case12
ArcLight
0 sec
Average intensity
+ eATP
Case12
ArcLight
136
546
1092
Time (sec)
Fig. 4 Comparison of Case12 and ArcLight responses to eATP. Top: MiCAM images of root tips of plants expressing ArcLight and Case12 with colored
circles indicating the root and background regions used for the graphs. The images correspond to the beginning of the experiment (0 s), addition of
ATP (100 s), highest response (145 s, Case12, increase of fluorescence; 205 s ArcLight, decrease of fluorescence) and recovery (846 s Case12;
920 s ArcLight), which can also be seen in the open black circles on the traces. Bottom: MiCAM raw data files were imported into Metamorph
and combined into one stack for comparison of fluorescence intensity changes. The traces derived from the colored circled areas at the top
are displayed over a time period of 1092 s. Either 2 mM ATP or buffer was added at approximately 100 sec as indicated by the blue arrow. The red and
green traces represent the responses of ArcLight and Case12, respectively, to eATP addition. Pink and gold traces show the corresponding backgrounds
for ArcLight and Case12, respectively. Turquoise and blue traces show the buffer controls for ArcLight and Case12, respectively. Dark red and dark green
traces indicate background for buffer controls for ArcLight and Case12, respectively (MiCAM images not shown)
the CBL1 membrane-tethering motif did not alter the
response following exposure to eATP (Fig. 5, bottom). This
indicates that the voltage sensitive domain Ci-VSD has no
impact on the fluorescence response of ArcLight in plants.
The dispensability of the voltage sensor suggests that
ArcLight is not responding to voltage but to pH through its
SEpHluorin base following eATP application.
Treatments with 2 mM eATP provoked similar reductions of fluorescence, irrespective of the presence or absence of the Ci-VSD, of the nuclear targeted proteins:
WPP-ArcLight and WPP-SEpHluorinA227D (Fig. 6 top
and bottom, respectively) and SUN2-ArcLight and SUN2-
SEpHluorinA277D (Fig. 7 top and bottom, respectively).
The latter result is noteworthy for monitoring changes specifically at a nuclear membrane given the virtually exclusive
localization of the SUN2-SEpHluorinA227D at the nuclear
rim (Fig. 3f and Fig. 7, bottom). Multiple cells or nuclei
within roots displayed similar signals following addition of
eATP in all transgenic lines tested (Additional file 3: Figure
S3) indicating that the plasma membrane and nuclear
membranes respond in a coordinated manner to eATP
treatments.
All of the observed responses to eATP depended on the
fluorescent proteins being in a cellular context because
Matzke and Matzke BMC Plant Biology (2015) 15:245
Page 7 of 14
ArcLight
% dF/Fmax
12
6
+ eATP
Time (sec)
109.2
1092
546
CBL1-SEpHluorinA227D
+ eATP
% dF/Fmax
12
6
Time (sec)
109.2
546
1092
+ Buffer
Fig. 5 Similar responses of ArcLight and CBL1-SEpHluorinA227D to eATP. The traces derived from the regions of the root indicated by the connecting lines
(MiCAM image at 0 s, 20x objective) are displayed over a time period of 1092 s. Either 2 mM ATP or buffer was added at approximately 100 s as indicated
by the blue arrows. Fractional fluorescence changes (%dF/Fmax) were calculated by the BV-Analyzer software supplied with the MiCAM camera.
The divisions of the Y-axis are set at 6 %. The X-axis shows time in seconds. Top: Responses of ArcLight to eATP addition are shown for multiple cells
within the root. All cells show a qualitatively similar response. The background trace, which remains unchanged following addition of eATP, is shown
above the MiCAM image. Bottom: Response of CBL1-SEpHluorinA227D to addition of eATP or buffer. The observed trace resembles that seen with
ArcLight. The background trace is shown in black
soluble GST-SEpHluorinA227D protein did not display any
changes in fluorescence intensity when ATP was added to
the solution (Additional file 4: Figure S4, top). In addition,
negligible responses to eATP application were observed in
plants expressing environmentally-insensitive mCitrine fused
to either Ci-VSD or CBL1 (Additional file 5: Figure S5).
ITMV and Light
To determine further effects on ArcLight fluorescence,
we tested two additional stimuli that might be expected
to provoke changes in membrane potential: induced
transmembrane voltage (ITMV) [30, 31] and light [32, 33].
For ITMV experiments, seedlings were placed in a chamber
flanked by two electrodes and subjected to an electric pulse
of 2.5 V. For experiments using additional light, seedlings
were placed in an agarose-pad-chamber and illuminated
with various wavelengths of light in addition to continuous
illumination at 500/20 nm, which is the excitation wavelength of ArcLight.
Both ITMV and light in the blue and violet wavelengths
elicited changes in fluorescence intensity of ArcLight in
root cells (Fig. 8). However, similar changes in fluorescence
Matzke and Matzke BMC Plant Biology (2015) 15:245
WPP-ArcLight
Page 8 of 14
+ eATP
% dF/Fmax
12
6
Time (sec)
109.2
546
1092
+ Buffer
WPP-SEpHluorinA227D
% dF/Fmax
+ eATP
12
6
Time (sec)
109.2
546
1092
+ Buffer
Fig. 6 Responses of WPP-ArcLight and WPP-SEpHluorinA227D to eATP. Time period, display settings and sampling time are the same as for Fig. 5
were observed with soluble GST-pHluorinA227D (Additional
file 4: Figure S4, middle and bottom), indicating that
the responses – in contrast to those observed with eATP
treatment - did not require the fluorescent reporter to
be membrane-localized in a cellular context. Plasma
membrane-anchored CBL1-SEpHluorinA227D displayed
responses to blue and violet light resembling those observed with ArcLight (Additional file 6: Figure S6, top).
However, the fluorescence of environmentally-insensitive
mCitrine fused to either Ci-VSD or CBL1 in root cells
remained largely unchanged under additional light illumination at all wavelengths (Additional file 6: Figure S6,
middle and bottom), demonstrating that not all GFP-
related fluorescent proteins respond in a similar manner
to additional light.
Discussion
Our study was designed to test the feasibility of using
the fluorescence intensity-based GEVI ArcLight, which
has been used as a voltage indicator in neurons, to
monitor voltage changes at the plasma membrane and
nuclear membranes in root cells. The membraneassociated fluorescent reporters were expressed well in
Arabidopsis root cells. The voltage-sensing Ci-VSD conferred good targeting to the plasma membrane in the absence of additional targeting motifs. For reasons that are
Matzke and Matzke BMC Plant Biology (2015) 15:245
Page 9 of 14
+ eATP
SUN2-ArcLight
% dF/Fmax
12
6
Time (sec)
109.2
546
1092
+ Buffer
SUN2-SEpHluorinA227D
+ eATP
% dF/Fmax
12
6
Time (sec)
109.2
546
1092
+ Buffer
Fig. 7 Responses of SUN2-ArcLight and SUN2-SEpHluorinA227D to eATP. Time period, display settings and sampling time are the same as for Fig. 5.
The only difference is that for SUN2-SEpHluorinA277D (bottom) the MiCAM image was made using a 40x objective
not completely clear, the Ci-VSD tended to promote
protein aggregation and/or interfere with the specificity
of nuclear envelope targeting when a nuclear membrane
targeting sequence was also present.
As expected from previous work in neural cells, ArcLight and Ci-VSD-containing derivatives situated in these
membrane systems responded robustly to eATP treatments by displaying transient reductions in fluorescence
intensity. However, similar reductions in fluorescence
intensity were observed with ArcLight derivatives lacking
the voltage sensor Ci-VSD, indicating that the observed
responses did not rely on voltage-sensing ability of the
fluorescent protein. Therefore, decreased fluorescence
intensity of ArcLight in response to eATP application in
root cells is best interpreted as reflecting the pH sensitivity
of its SEpHluorin base. In neurons, the pH sensitivity of
ArcLight is less of a concern because H+-fluxes and pH
changes during neuronal activity are of minor importance.
By contrast, H+-ions contribute substantially to depolarisation and electrical activities in plants [34].
The decrease of ArcLight fluorescence in response to
pH changes following eATP treatment can be understood as follows: The transient depolarization induced
by eATP is accompanied by a large increase in free cytoplasmic calcium ion concentration ([Ca2+]cyt), as shown
by the transient increase in fluorescence of Case12. Both
Matzke and Matzke BMC Plant Biology (2015) 15:245
Page 10 of 14
Average intensity
ITMV
2.5V N
2.5V R
26
102
205
Average intensity
Time (sec)
Light Spectrum
on/off
fr
68
nr c
b
v
b
273
c nr
fr
v
546
Time (sec)
Fig. 8 Responses of ArcLight to ITMV and additional illumination by different wavelengths of light. Top – induced transmembrane voltage
(ITMV): Electrodes are positioned at the black arrows to the left of the MiCAM image. Root regions close to the electrodes that were used to
make the graph are circled in red and blue to correspond to the cognate traces in the graph. Images were acquired at 200 ms intervals over a
time period of 205 s. Voltage pulses (2.5 V with a duration of 200 ms) were applied at approximately 60 s and 120 s for normal (N) and reverse
(R) polarities, respectively. ArcLight in the two regions responds in an opposite manner depending on the polarity of the pulse. The different
effect in the two regions can be explained by the proximity of the responding cells to the depolarising electrode (i.e. cathode). With ‘normal
polarity’ (stimulus at t = 60 s) the bottom electrode is the cathode and the blue circled cells responded by a cytoplasmic pH-drop, whereas with
‘reverse polarity’ (stimulus at t = 120 s) the top electrode is the cathode and the red circled cells responded. Bottom - additional illumination:
Light spectrum details are provided in Methods section. Regions sampled are circled in the MiCAM image. Images were acquired at 100 ms
intervals over a time period of 546 s. Duration of light pulses (on/off) was 10 s. Abbreviations: fr, far red; nr, near red; c, cyan; b, blue; v, violet.
Under blue and violet illumination, ArcLight decreases in fluorescence intensity due to photobleaching, which is more pronounced when light
of high energy (violet = 390 nm) is used as compared to lower energy (blue = 438 nm). The recovery of fluorescence after the bleaching light
has been switched off is due to diffusion of unbleached fluorescent proteins into the focal plane of the imaging objective, an effect known as
FRAP (Fluorescence recovery after photo bleaching). The small increases in the signal during illumination with far red, near red and cyan result
from insufficient spectral separation of the illuminating light from the optical emission path of the microscope
depolarisation and [Ca2+]cyt transient are the result of
cation channel activities, which are mainly K+-channels,
but these are rather nonspecific and can also conduct H+
ions. Since there is a membrane potential (negative inside
the cell with respect to the outside) and a pH-gradient
between the outer medium and cytoplasm (the pH of the
apoplast is normally between 4.5 and 6.5 [35], whereas
cytoplasmic pH is usually around 7.3 [36]), protons run
down their electrochemical gradient upon cation channel
opening, enter the cell, and acidify its internal contents. The SEpHluorin component of ArcLight responds to
H+-ion plumes near the membrane and to cytoplasmic
Matzke and Matzke BMC Plant Biology (2015) 15:245
acidification, resulting in reductions in fluorescence. In this
scenario, ArcLight responds primarily to the downstream
consequence of a membrane voltage change (decreased
pH) and not directly to the voltage change itself.
Conclusions
In summary, although ArcLight and the derivatives tested
here do not provide a direct sensor for voltage changes in
plants, they can potentially be used as fluorescence
intensity-based, membrane-localized indicators of pH
changes at the cell surface and nuclear periphery. These
fluorescence intensity-based pH indicators display robust
responses and, following further validation and calibration, may provide facile alternatives to ratiometric-based
pH indicators based on GFP [37]. The development of
monochromatic GEVIs for use in plant systems will
require the identification of fluorescent reporter proteins
that are less sensitive than ArcLight to changes in pH.
Page 11 of 14
one week of growth before being used for experiments
as described.
Expression of SEpHluorinA277D in E. coli
We expressed GST-tagged SEpHluorinA277D in E. coli
strain BL21 (NEB, USA) using the expression vector pET42a(+), which contains a GST-tag and multiple cloning site
(Novagen, USA). The SEpHluorinA227D sequence was
amplified using PCR as a BamHI/HindIII fragment and
cloned in frame into pET-42a(+) and introduced into BL21
cells. Production of GST-tagged SEpHluorinA227D protein
was induced with isopropyl β-D-1-thiogalactopyranoside
(IPTG) on agar plates overnight. The GST-tagged SEpHluorinA277D was isolated using the BugBuster GST-Bind
Purification Kit (Novagen 79794–3 REF) and purified using
the small scale batch method according to the manufacturer’s instructions.
Confocal microscopy
Methods
Transgenic plants expressing fluorescent protein
reporters
The nucleotide sequence of ArcLight, codon-optimized
for expression in Drosophila melanogaster [38], was
obtained from Dr. Michael Nitabach (Yale University)
and then codon-optimized by our lab for Arabidopsis
and synthesized by GeneScript. Transgenic constructs
(Fig. 2) were produced using standard molecular biology
techniques. The transgenes plus promoter (either Ubi10
[39] or Rps5 [40]) were assembled on modified pBC
plasmids (Stratagene, Cat. Nr. 212215) between Sal1 and
XhoI sites, and the entire transgene was inserted into the
Sal1 site of binary vector pZP221 [41]. The respective
binary vectors containing each transgene construct were
introduced via Agrobacterium-mediated transformation
into Arabidopsis thaliana ecotype Columbia-0 using the
floral dip method [42]. All transgenic lines used in this
study were generated in our lab. The Ubi10 promoter
drives expression in the whole root, including root hairs.
The RPS5 promoter is expressed primarily in the division zone-transition zone. The data shown are from
lines that showed the best expression.
Seeds of transgenic plants were surface sterilized in
1.5 ml Eppendorf tubes by shaking them for 20 min in
1 ml of 70 % ethanol solution containing Triton X-100
(50 μl per 100 ml 70 % ethanol). The seeds were centrifuged in an Eppendorf centrifuge for 1 min, the supernatant removed, and the seeds were resuspended in 1 ml
of 100 % ethanol and immediately pipetted onto a filter
paper disk in a sterile hood. After air-drying for 1 h,
seeds were sprinkled onto sterile, solid Murashige and
Skoog (MS) medium in petri dishes, stratified by storing
the plate at 4 °C for 3 days, and then transferred to a
light incubator (23 °C, 16 h light, 8 h dark) for about
Confocal images of seedlings growing on sterile, solid MS
medium in petri dishes were acquired using the Leica TCS
LSI microscope equipped with a 5x Z16 APO A zoom system (Leica Microsystems CMS GmbH, Germany, purchased from Major Instruments, Taiwan).
Fluorescence imaging and data processing
Fluorescence changes were recorded with a fast CCD
imaging system, MiCAM02-HR, which is specialized for
both calcium ion and membrane voltage imaging applications (Brainvision Inc., Japan, purchased from Major
Instruments, Taiwan), mounted on an Axiovert25 inverted
fluorescence microscope (Carl Zeiss GmbH, Germany)
equipped with 5x/0.12 (CP-Acromat), 20x/0.8 (Plan-Apochromat) and 40x/0.9 Pol (EC Plan-Neofluar) objectives
and either an ET YFP filter cube (Ex ET 500/20, beam
splitter T515p, Em ET 535/30) or an FITC filter cube (Ex
HQ 480/40x, beam splitter Q 505 LPe, Em HQ 535/50 m).
The light source for the microscope was a xenon short arc
lamp without reflector, model XBO 150 W/CR OFR
(OSRAM GmbH, Germany) housed in an OptoSource
illuminator (Cairn Research Ltd., U.K. purchased via
Major Instruments, Taiwan). Displays of results were
obtained using Metamorph (Meta Imaging Series Software, Molecular Devices, USA) (Figs. 4, 8; Additional
file 6: Figure S6) or data analysis software BV_Analyzer
(ver1312) (Brainvision Inc., Japan) (Figs. 5, 6, 7; Additional
file 3: Figure S3; Additional file 4: Figure S4; Additional file
5: Figure S5). In the latter case, the fractional fluorescence
changes (dF/Fmax) shown in the figures were calculated
using the processing function of BV_Analyzer. All experiments were performed multiple times and representative
results are shown. After seedlings recovered from the experiments, they could be transferred to soil, where they
grew and reproduced normally.
Matzke and Matzke BMC Plant Biology (2015) 15:245
External ATP (eATP)
For addition of eATP to seedlings, we used a microscope
slide-sized, open-top bath chamber (a gift from Dr. Kai
Konrad, University of Würzburg, Germany) made of 3 mm
thick plexiglass (7.6 × 2.5 cm) with an oval, bevelled indentation (4.5 × 1.8 cm) and a large cover slip (6 × 2.5 cm)
glued on the bottom. This chamber was filled with 1 %
agarose in 1x imaging solution [5 mM potassium chloride,
10 mM MES hydrate, 10 mM calcium chloride, adjusted to
pH5.8 with Tris(hydroxymethyl)aminomethane] [29, 43] to
make tight fitting agar blocks. After solidification at room
temperature, the agar block was removed and transferred
to a round petri dish, where it was kept in 1x imaging solution until use, when it was cut into approximately 1 cm
broad slices.
To mount an Arabidopsis seedling (1–2 weeks old) for
fluorescence imaging, 400 μl 1x imaging solution was
pipetted into the open-top chamber and an intact seedling removed from MS medium was positioned lengthwise into the imaging solution. A 1 cm slice of the agar
block (as prepared above) was then placed on top of the
area of the extended root to be imaged, leaving the root
tip protruding on one side and the leaves on the other
side. With fine forceps, the seedling was pulled carefully
until the root tip was just under the agar block. Excess
solution around the agar block was removed. The chamber
was then mounted on the inverted microscope. A silicon
tube was attached on one end to a Gilson Pipetman and after filling the tube with 50 μl 2 mM ATP in 1x imaging
solution or buffer for buffer-only control experiments as indicated in the figures - the other end was attached to a
holder that is positioned just above the edge of the agar
block under which the root has been positioned (Additional
file 7: Figure S7A). Fluorescence recording was then started
and the eATP solution was pipetted into the bath chamber
at a specified time.
To test soluble GST-SEpHluorinA227D, 200 μl of the
isolated protein in elution buffer EB (BugBuster GST-Bind
Purification Kit, Novagen) (protein concentration approximately 30 μg/ml) was placed in the Bügelkammer (see section on ITMV) and 50 μl eATP solution, which also
contained 30 μg/ml GST-tagged SEpHluorin to maintain
the protein concentration, was added from a silicon tube
positioned just above the edge of the cover slip.
ITMV (induced transmembrane voltage)
For application of voltage pulses, we used a Grass SD
stimulator (Grass, USA) connected to two electrodes
mounted on a slide holder (Bügelkammer, Krüss GmbH,
Germany). The two electrodes of the Bügelkammer are
mounted on separate plastic stirrups and can be clamped
down individually over the sample, thus positioning the
electrodes at a distance of 200 μm. A 24 × 40 mm cover
slip is placed in the open Bügelkammer, 200 μl 1x imaging
Page 12 of 14
solution [29, 43] is placed on the cover slip, and the first
electrode is clamped down on the cover slip. A seedling
is placed horizontally in the imaging solution above the
first electrode and the second electrode is clamped
down onto the cover slip such that the root is under
the second electrode. An 18x18 mm cover slip is then
placed on top of the root for stabilization (Additional
file 7: Figure S7B). The area of the root between the
two electrodes was imaged (see for example, Fig. 8a).
To test soluble GST-SEpHluorinA227D, the isolated protein in elution buffer EB (BugBuster GST-Bind Purification Kit, Novagen) (protein concentration approximately
30 μg/ml) was placed in the Bügelkammer and covered
with an 18x18 mm cover slip.
Light treatment
To test the influence of additional light pulses on fluorescence intensity of ArcLight and derivatives (during
continuous illumination at 500/20 nm, the excitation
wavelength of ArcLight), a SPECTRA X Light Engine
(Lumencor, USA, purchased from Major Instruments,
Taiwan) was used for illumination at 390/18 nm (violet),
438/24 nm (blue), 475/28 nm (cyan), 589/15 nm (near
red) and 632/22 nm (far red). The additional light at
these wavelengths was shone at an angle of 30° and from
a distance of 10 cm on a seedling mounted under an
agar block in the open-top chamber as described for
eATP experiments. The light intensity was set at 10 %
on the SPECTRA X Light Engine and focused on the
imaging plane. Automated turning on and off at certain
wavelengths of the SPECTRA X Light Engine and at
specific time points was achieved by using GhostMouse
software () or was performed by
hand. To test soluble GST-SEpHluorinA227D, the isolated protein in elution buffer EB (BugBuster GST-Bind
Purification Kit, Novagen) (protein concentration approximately 30 μg/ml) was placed in the Bügelkammer,
covered with a 18x18 mm cover slip, and illuminated
with the SPECTRA X Light Engine as described above.
Additional files
Additional file 1: Figure S1. Comparison of amino acid sequences of
mCitrine, wild-type GFP, SEpHlourinA227 and SEpHluorin A227D. (PDF 62 kb)
Additional file 2: Figure S2. Fluorescent confocal images of roots of
transgenic plants expressing soluble Case12 and plasma membrane-localized
Ci-VSD-mCitrine and CBL1-mCitrine. (PDF 610 kb)
Additional file 3: Figure S3. Simultaneous changes in fluorescence
intensity of reporter proteins in multiple root cells following eATP addition.
(PDF 371 kb)
Additional file 4: Figure S4. Responses of soluble GST-SEpHlorinA227D
to eATP, light and ITMV. (PDF 197 kb)
Additional file 5: Figure S5. Responses to Ci-VSD-Citrine and CBL1-Citrine
to eATP. (PDF 225 kb)
Matzke and Matzke BMC Plant Biology (2015) 15:245
Page 13 of 14
Additional file 6: Figure S6. CBL1-SEpHluorinA227D but not
environmentally-insensitive mCitrine responds to additional illumination by
different wavelengths of light. (PDF 627 kb)
8.
Additional file 7: Figure S7. Photographs showing mounted seedlings
for treatments with eATP, light and ITMV. (PDF 196 kb)
10.
Abbreviations
ArcLight: SEpHluorinA227D fused to Ci-VSD; Case12: Calcium sensor 12;
CBL1: CALCINEURIN B-LIKE PROTEIN 1. The Arabidopsis CBL1 protein
(At4g17615) contains a myristolated glycine and a palmitolated cysteine,
which tether the fluorescent fusion protein to the cytoplasmic surface of the
plasma membrane; Ci-VSD: voltage sensing domain of Ciona intestinalis
voltage-sensing phosphatase; eATP: extracellular ATP; FRET: Förster resonance
energy transfer; GEVI: genetically-encoded voltage indicator; GST: glutathione
S-transferase; ITMV: induced transmembrane voltage; mCitrine: monomeric citrine;
RANGAP1: RAN GTPASE ACTIVATING PROTEIN 1; SEpHluorin: super-ecliptic(SE)
pHluorin (pH-sensitive fluorescent protein); SEpHluorinA227D: super-ecliptic(SE)
pHluorin (pH-sensitive fluorescent protein) containing an A227D substitution that
confers voltage sensitivity in neurons; SUN2: SAD1/UNC-84 DOMAIN PROTEIN 2.
The Arabidopsis SUN2 protein (At3g10730) has one transmembrane domain that
can localize SUN2-fusion proteins at the inner nuclear membrane surface;
WPP: The WPP sequence contains a Trp(W)-Pro(P)-Pro motif consists of amino
acids 28–131 of Arabidopsis RANGAP1 (At3g63130) that is sufficient for targeting
fusion proteins to the outer nuclear membrane.
11.
Competing interests
The authors declare no competing interests.
9.
12.
13.
14.
15.
16.
17.
18.
19.
Authors’ contributions
AJMM and MM designed the study. AJM conducted the experimental work.
AJMM and MM interpreted the results, wrote the paper and approved the
final manuscript. Both authors read and approved the final manuscript.
20.
Authors’ information
Not applicable.
21.
22.
Availability of data and materials
Not applicable.
Acknowledgments
We thank Map Chen for helpful advice and discussions; Jason Fu for
microscope administration; Dr. Hiroo Fukuda, University of Tokyo, for SUN2;
Dr. Roger Deal, Emory University, for WPP; Dr. Thomas Knöpfel, Imperial
College, London, for V3.1-mCitrine; and and Dr. Michael Nitabach, Yale
University, for the sequence of ArcLight. We are grateful to the anonymous
reviewers of the first version of this paper for many helpful comments.
Funding
Financial support for this work has been generously provided by Academia
Sinica (AS) and the Institute of Plant and Microbial Biology (AS).
23.
24.
25.
26.
27.
28.
Received: 27 July 2015 Accepted: 30 September 2015
29.
References
1. Jaffe LF, Nuccitelli R. Electrical controls of development. Annu Rev Biophys
Bioeng. 1977;6:445–76.
2. Levin M, Stevenson CG. Regulation of cell behavior and tissue patterning by
bioelectrical signals: challenges and opportunities for biomedical
engineering. Annu Rev Biomed Eng. 2012;14:295–323.
3. Chang F, Minc N. Electrochemical control of cell and tissue polarity. Annu
Rev Cell Dev Biol. 2014;30:317–36.
4. Cohen AE, Venkatachalam V. Bringing bioelectricity to light. Annu Rev Biophys.
2014;43:211–32.
5. Pastrana E. Light-based electrophysiology. Nat Methods. 2012;9:38.
6. Knöpfel T. Genetically encoded optical indicators for the analysis of neuron
al circuits. Nat Rev Neuroscience. 2012;13:687–700.
7. Miyawaki A, Niino Y. Molecular spies for bioimaging–fluorescent protein-based
probes. Mol Cell. 2015;58:632–43.
30.
31.
32.
33.
34.
Patti J, Isacoff E. Measuring Membrane Voltage with Fluorescent Proteins.
Cold Spring Harb Protoc. 2013;7:606–13.
Alford SC, Wu J, Zhao Y, Campbell RE, Knöpfel T. Optogenetic reporters. Biol
Cell. 2013;105:14–29.
Tsutsui H, Karasawa S, Okamura Y, Miyawaki A. Improving membrane voltage
measurements using FRET with new fluorescent proteins. Nat Methods.
2008;5:683–5.
Jin L, Han Z, Platisa J, Wooltorton JR, Cohen LB, Pieribone VA. Single action
potentials and subthreshold electrical events imaged in neurons with a
fluorescent protein voltage probe. Neuron. 2012;75:779–85.
Han Z, Jin L, Chen F, Loturco JJ, Cohen LB, Bondar A, et al. Mechanistic studies
of the genetically encoded fluorescent protein voltage probe ArcLight. PLoS
One. 2014;9:e113873.
Miesenböck G, De Angelis DA, Rothman JE. Visualizing secretion and
synaptic transmission with pH-sensitive green fluorescent proteins. Nature.
1998;394:192–5.
Miesenböck G. Synapto-pHluorins: genetically encoded reporters of synaptic
transmission. Cold Spring Harb Protoc. 2012;2012:213–7.
Murata Y, Iwasaki H, Sasaki M, Inaba K, Okamura Y. Phosphoinositide phosphatase
activity coupled to an intrinsic voltage sensor. Nature. 2005;435:1239–43.
Masi E, Ciszak M, Stefano G, Renna L, Azzarello E, Pandolfi C, et al.
Spatiotemporal dynamics of the electrical network activity in the root apex.
Proc Natl Acad Sci U S A. 2009;106:4048–53.
Zhao DJ, Wang ZY, Huang L, Jia YP, Leng JQ. Spatio-temporal mapping of
variation potentials in leaves of Helianthus annus L. seedlings in situ using
multi-electrode array. Sci Rep. 2014;4:5435.
Matzke AJM, Weiger TM, Matzke M. Ion channels at the nucleus:
electrophysiology meets the genome. Mol Plant. 2010;3:642–52.
Matzke AJM, Matzke M. Membrane “potential-omics”: toward voltage
imaging at the cell population level in roots of living plants. Front Plant Sci.
2013;4:311.
Grefen C, Karnik R, Larson E, Lefoulon C, Wang Y, Waghmare S, et al. A
vesicle-trafficking protein commandeers Kv channel voltage sensors for
voltage-dependent secretion. Nat Plants. 2015, DOI:10.1038/
NPLANTS.2015.108
Tanaka K, Gilroy S, Jones AM, Stacey G. Extracellular ATP signaling in plants.
Trends Cell Biol. 2010;20:601–8.
Rose A, Meier I. A domain unique to plant RanGAP is responsible for its
targeting to the plant nuclear rim. Proc Natl Acad Sci U S A. 2001;98:15377–82.
Deal RB, Henikoff S. A simple method for gene expression and chromatin
profiling of individual cell types within a tissue. Dev Cell. 2010;18:1030–40.
Oda Y, Fukuda H. Dynamics of Arabidopsis SUN proteins during mitosis and
their involvement in nuclear shaping. Plant J. 2011;66:629–41.
Batistic O, Sorek N, Schültke S, Yalovsky S, Kudla J. Dual fatty acyl modification
determines the localization and plasma membrane targeting of CBL/CIPK Ca2+
signaling complexes in Arabidopsis. Plant Cell. 2008;20:1346–62.
Souslova EA, Belousov VV, Lock JG, Strömblad S, Kasparov S, Bolshakov AP,
et al. Single fluorescent protein-based Ca2+ sensors with increased dynamic
range. BMC Biotechnol. 2007;7:37.
Griesbeck O, Baird GS, Campbell RE, Zacharias DA, Tsien RY. Reducing the
environmental sensitivity of yellow fluorescent protein. Mechanism and
applications. J Biol Chem. 2001;276:29188–94.
Perron A, Mutoh H, Launey T, Knöpfel T. Red-shifted voltage-sensitive
fluorescent proteins. Chem Biol. 2009;16:1268–77.
Loro G, Drago I, Pozzan T, Schiavo FL, Zottini M, Costa A. Targeting of
Cameleons to various subcellular compartments reveals a strict cytoplasmic/
mitochondrial Ca2+ handling relationship in plant cells. Plant J. 2012;71:1–13.
Kralj JM, Hochbaum DR, Douglass AD, Cohen AE. Electrical spiking in
Escherichia coli probed with a fluorescent voltage-indicating protein. Science.
2011;333:345–8.
Zou P, Zhao Y, Douglass AD, Hochbaum DR, Brinks D, Werley CA, et al.
Bright and fast multicoloured voltage reporters via electrochromic FRET. Nat
Commun. 2014;5:4625.
Roelfsema MR, Steinmeyer R, Staal M, Hedrich R. Single guard cell
recordings in intact plants: light-induced hyperpolarization of the plasma
membrane. Plant J. 2001;26:1–13.
Galen C, Rabenold JJ, Liscum E. Light-sensing in roots. Plant Signal Behav.
2007;2:106–8.
Duby G, Boutry M. The plant plasma membrane proton pump ATPase: a
highly regulated P-type ATPase with multiple physiological roles. Pflugers
Arch - Eur J Physiol. 2009;457:645–55.
Matzke and Matzke BMC Plant Biology (2015) 15:245
Page 14 of 14
35. Felle HH. pH: Signal and messenger in plant cells. Plant Biol. 2001;3:577–91.
36. Shen J, Zeng Y, Zhuang X, Sun L, Yao X, Pimpl P, et al. Organelle pH in the
Arabidopsis endomembrane system. Mol Plant. 2013;6:1419–37.
37. Martinière A, Desbrosses G, Sentenac H, Paris N. Development and
properties of genetically encoded pH sensors in plants. Front Plant Sci.
2013;4:523. doi:10.3389/fpls.2013.00523.
38. Cao G, Platisa J, Pieribone VA, Raccuglia D, Kunst M, Nitabach MN.
Genetically targeted optical electrophysiology in intact neural circuits. Cell.
2013;154:904–13.
39. Grefen C, Donald N, Hashimoto K, Kudla J, Schumacher K, Blatt MR. A
ubiquitin-10 promoter-based vector set for fluorescent protein tagging
facilitates temporal stability and native protein distribution in transient and
stable expression studies. Plant J. 2010;64:355–65.
40. Weijers D, Franke-van Dijk M, Vencken RJ, Quint A, Hooykaas P, Offringa R.
An Arabidopsis Minute-like phenotype caused by a semi-dominant mutation
in a RIBOSOMAL PROTEIN S5 gene. Development. 2001;128:4289–99.
41. Hajdukiewicz P, Svab Z, Maliga P. The small, versatile pPZP family of
Agrobacterium binary vectors for plant transformation. Plant Mol Biol.
1994;25:989–94.
42. Clough SJ, Bent AF. Floral dip: a simplified method for Agrobacterium-mediated
transformation of Arabidopsis thaliana. Plant J. 1998;16:735–43.
43. Loro G, Costa A. Imaging of mitochondrial and nuclear Ca2+ dynamics in
Arabidopsis roots. Cold Spring Harb Protoc. 2013;8:781–5.
44. Graumann K, Vanrobays E, Tutois S, Probst AV, Evans DE, Tatout C.
Characterization of two distinct subfamilies of SUN-domain proteins in
Arabidopsis and their interactions with the novel KASH-domain protein
AtTIK. J Exp Bot. 2014;65:6499–512.
45. Graumann K, Runions J, Evans DE. Characterization of SUN-domain proteins
at the higher plant nuclear envelope. Plant J. 2010;61:134–44.
Submit your next manuscript to BioMed Central
and take full advantage of:
• Convenient online submission
• Thorough peer review
• No space constraints or color figure charges
• Immediate publication on acceptance
• Inclusion in PubMed, CAS, Scopus and Google Scholar
• Research which is freely available for redistribution
Submit your manuscript at
www.biomedcentral.com/submit