A bulk segregant transcriptome analysis reveals metabolic and cellular processes associated with Orange allelic variation and fruit β-carotene accumulation in melon fruit
Bạn đang xem bản rút gọn của tài liệu. Xem và tải ngay bản đầy đủ của tài liệu tại đây (3.71 MB, 18 trang )
Chayut et al. BMC Plant Biology (2015) 15:274
DOI 10.1186/s12870-015-0661-8
RESEARCH ARTICLE
Open Access
A bulk segregant transcriptome analysis
reveals metabolic and cellular processes
associated with Orange allelic variation and
fruit β-carotene accumulation in melon
fruit
Noam Chayut1,2, Hui Yuan3, Shachar Ohali1, Ayala Meir1, Yelena Yeselson5, Vitaly Portnoy1, Yi Zheng4,
Zhangjun Fei4, Efraim Lewinsohn1, Nurit Katzir1, Arthur A. Schaffer5, Shimon Gepstein2, Joseph Burger1, Li Li3,6
and Yaakov Tadmor1*
Abstract
Background: Melon fruit flesh color is primarily controlled by the “golden” single nucleotide polymorhism of the
“Orange” gene, CmOr, which dominantly triggers the accumulation of the pro-vitamin A molecule, β-carotene, in
the fruit mesocarp. The mechanism by which CmOr operates is not fully understood. To identify cellular and
metabolic processes associated with CmOr allelic variation, we compared the transcriptome of bulks of developing
fruit of homozygous orange and green fruited F3 families derived from a cross between orange and green fruited
parental lines.
Results: Pooling together F3 families that share same fruit flesh color and thus the same CmOr allelic variation,
normalized traits unrelated to CmOr allelic variation. RNA sequencing analysis of these bulks enabled the
identification of differentially expressed genes. These genes were clustered into functional groups. The relatively
enriched functional groups were those involved in photosynthesis, RNA and protein regulation, and response
to stress.
Conclusions: The differentially expressed genes and the enriched processes identified here by bulk segregant RNA
sequencing analysis are likely part of the regulatory network of CmOr. Our study demonstrates the resolution power
of bulk segregant RNA sequencing in identifying genes related to commercially important traits and provides a
useful tool for better understanding the mode of action of CmOr gene in the mediation of carotenoid
accumulation.
Keywords: Melon, Cucumis melo, Carotenoids, Beta-carotene, Bulk segregant analysis, CmOr, Fruit development,
Transcriptome
* Correspondence:
1
Plant Science Institute, Agricultural Research Organization, Newe Ya’ar
Research Center, P.O. Box 1021, Ramat Yishay 30095, Israel
Full list of author information is available at the end of the article
© 2015 Chayut et al. Open Access This article is distributed under the terms of the Creative Commons Attribution 4.0
International License ( which permits unrestricted use, distribution, and
reproduction in any medium, provided you give appropriate credit to the original author(s) and the source, provide a link to
the Creative Commons license, and indicate if changes were made. The Creative Commons Public Domain Dedication waiver
( applies to the data made available in this article, unless otherwise stated.
Chayut et al. BMC Plant Biology (2015) 15:274
Background
Carotenoids in fruits have been subjected to extensive
studies due to their nutritional and visual appealing importance. The metabolic pathway leading to the accumulation of carotenoids in plants has been well elucidated
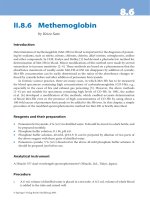
and extensively reviewed by many authors, including recently by Nisar et al. [1]. A scheme of the carotenoid
biosynthetic pathway is illustrated in Fig. 1. Some carotenoids such as β-carotene serve as precursors of vitamin
A, some are potent antioxidants and many carotenoids
are believed to provide protection against certain cancers, heart diseases, and age-related eye disease [2–4]. A
large number of fruits owe their vivid color to carotenoid accumulation. In fleshy fruits, carotenoid level and
composition vary dramatically among species and within
Fig. 1 Schematic presentation of the metabolic pathway leading to
β-carotene formation and major downstream products. Enzymes are
aligned with arrows. The three upstream enzymes belonging to the
methylerthritol-4-phosphate (MEP) pathway are: deoxy-d-xylulose
5-phosphate (DXP) synthase (DXS), DXP reductoisomerase (DXR)
and geranylgeranyl diphosphate synthase (GGPPS). The carotenogenesis
enzymes are: phytoene synthase (PSY); phytoene desaturase (PDS);
ζ-carotene isomerase (Z-ISO); ζ-carotene desaturase (ZDS); carotene
isomerase (CRTISO). lycopene ɛ-cyclase (ε-LCY); lycopene β-cyclase
(β-LCY); β-carotene hydroxylase (β-OHase) carotenoid cleavage
dioxygenases (CCDs); 9-cis-epoxycarotenoid dioxygenases (NCEDs);
Enzyme names and abbreviations are after [1]
Page 2 of 18
different varieties of the same species. Because carotenoids
confer fruit color, their evolutionary role in fruit is likely
to attract seed dispersers. Carotenoids also constitute an
important economical trait in horticulture. In addition, carotenoid breakdown products have profound effects in
fruit flavor and aroma, which may have further attractive
effects on seed dispersers and consumers [5–10].
Melon (Cucumis melo) is an economically important
crop and has been subjected to intensive breeding programs for over a century [11]. Roughly 29.5 million tons
of melon fruit were produced worldwide in 2013 [12].
Melon is a diploid (2n = 24) species with a relatively
small genome size (estimated 450 Mb), which was recently sequenced and assembled [13]. Melon fruit flesh
color is an important quality trait typically divided into
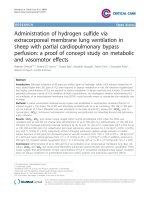
three phenotypes: white, green, and orange. However,
the color intensity may vary dramatically within these
groups (Fig. 2). The orange fruit flesh phenotype is dominant over the non-orange phenotypes. The orange versus non-orange flesh color trait inheritance is controlled
by a single gene termed green-flesh, which determines
dominantly the accumulation of relatively high levels of
β-carotene in orange flesh fruit [14]. Recently we reported that the melon’s Or gene (CmOr) governs the
“green-flesh” trait [15]. OR, a plastid localized protein,
increases carotenoids accumulation by inducing the biogenesis of chromoplasts with an enhanced sink strength
[16, 17]. Several single nucleotide polymorphism (SNPs)
distinguish between the CmOr alleles that dictate orange and non-orange fruit flesh colors, but only one of
them alters an amino acid in the CmOR protein, an arginine at position 108 in white and green-flesh fruit is
replaced by a histidine in orange flesh fruit. Functional
proof for the role of this amino acid alteration in the
phenotype determination was obtained by site directed
mutagenesis followed by transgenic expression in
Arabidopsis callus system [15]. A comparative transcriptome analysis of the two CmOr alleles in developing melon fruit could identify differentially expressed
genes. Many of these genes are likely to be directly or
indirectly associated with metabolic and cellular processes affected by CmOr allelic variation, or in other
words, part of the gene network that is affected by
CmOr allelic variation. This data will shed more light
on CmOr function and mechanism of action.
Bulk segregant analysis (BSA) was established in
1991 as a method to detect markers in a specific genomic region by comparing two pooled DNA samples
of individuals from a segregating population [18].
Within each bulk, the individuals are arbitrary for all
traits except the trait or the gene of interest. The
pooled individuals share the same genotype in the
genomic area that surrounds the gene that distinguishes between the bulks. Coupling BSA with the
Chayut et al. BMC Plant Biology (2015) 15:274
Page 3 of 18
would identify differentially expressed genes (DEGs)
that are associated with CmOr allelic variation.
In this study, we applied BSR-Seq to reveal metabolic
and cellular processes associated with β-carotene accumulation under the control of CmOr allelic variation in orange
and green flesh melon fruit. We show that BSR-Seq is an
effective approach for gene discovery. Our results point to
an association between the initiation of β-carotene accumulation and gene expression in the processes of photosynthesis, RNA and protein regulation, stress response,
and interestingly sucrose metabolism that could be affected
by CmOr allelic variation, or by variation in genes that are
tightly linked to CmOr.
Results
The bulking process - phenotypes of the bulks and the
parental lines
Fig. 2 Representative fruit of 10 inbred lines cut open showing various
flesh color phenotype. A-E: orange flesh phenotype, homozygous
dominant CmOr encoding CmOR protein with a histidine at position
108. F-G: White and green flesh phenotypes, homozygous recessive
Cmor encoding CmOR with an arginine at position 108. Accession
names and taxonomic groups: (a) PI 414723 (subspecies agrestis);
(b) Indian Best, Chandalc; (c) CEZ, Cantalupensis (marketed as
‘Charentais’); (d) Dulce, Cantalupensis (marketed as Catalope); (e) HP,
Cantalupensis, (marketed as ‘magenta-type’); (f) Piel De Sapo, Inodorus;
(g). NA, Inodorus (marketed as ‘Canary Yellow’); (h). Ein Dor, Reticulatus;
(i). Noy Yizreel, Cantalupensis; and (j): Tam-Dew, Inodorus (marketed as
‘Honey-Dew)’. All plants were field grown in the summer of 2012
high throughput RNA sequencing (RNA-Seq) has been
shown to be an efficient tool for gene mapping and
has been termed BSR-Seq [19, 20]. We hypothesized
that comparing the transcriptomes of bulked melon F3
families, derived from a cross between orange and
green fruited parental lines, with different flesh color,
We chose the segregating population originated from a
cross between the orange flesh fruit ‘Dulce’ (‘Dul’) and
the green flesh ‘Tam-Dew’ (‘Tad’) for constructing the
bulks that were comparatively analyzed using BSR-Seq.
In addition to fruit flesh color, ‘Dul’ and ‘Tad’ fruits differed in size, shape, rind darkness at 10 days after anthesis (DAA), rind color of the mature fruit, and netting on
mature fruit peel (Fig. 3a). The parental lines also differed in the levels of total soluble solids (TSS), sucrose
concentration, taste, aroma, rind width, rind hardness,
and time to reach maturation, among other agronomical
important traits. Selected bulked F3 families were phenotyped for these traits and except for the TSS levels and
sucrose content of mature fruits no differences were
found to distinguish between the mean values of the
‘green’ (Cmor/Cmor) and ‘orange’ (CmOr/CmOr) bulks.
For example the average mature fruit weight of ‘Dul’
was 938 g while ‘Tad’ fruit weighed 2218 gr (2.4 fold
more). However, the average orange and green mature
fruit weight of the bulked families (based on 75 fruits; 3
fruit of each of the 25 families in each bulk) weighed
1512 g and 1496 g respectively, showing insignificant differences in average fruit weight (Additional file 1: Figure
S1 A and B). This demonstrated the effectiveness of the
bulk approach to normalize differences between parental
lines in traits that are unrelated to carotenoid accumulation, which is governed by CmOr allelic variation. As expected from such polygenic quantitative trait, the 25
families presented normal distribution around the mean
(Additional file 1: Figure S1C).
Another example of the normalizing effect of the bulks
on a trait that differs between parental lines was the
number of days to flowering (as indicated by the first
successful pollination). Like fruit weight, this trait is controlled by numerous genes since it is dependent on
many factors such as plant growth rate, female flowering
time, preferences of pollinators and stigma receptivity.
Chayut et al. BMC Plant Biology (2015) 15:274
Fig. 3 (See legend on next page.)
Page 4 of 18
Chayut et al. BMC Plant Biology (2015) 15:274
Page 5 of 18
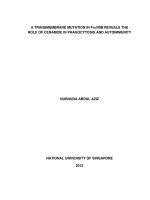
(See figure on previous page.)
Fig. 3 Phenotypic characterization of melon fruit bulks and parental lines. a Developing fruit of ‘Dulce’ and ‘Tam-Dew’, the parental lines of the
segregating population, at four developmental stages. Uncut fruits are shown at 10 DAA and at the mature stage. Bar = 5 cm; (b) 10 DAA fruitlets.
Each three horizontal fruitlets belong to the same F3 family. Pictures of five out of the 25 families’ fruits comprising green (Cmor,Cmor) and
orange (CmOr,CmOr) fruited bulks are depicted. Traits such as fruitlet rind color, fruitlet shape, striped or unstriped rind can be noticed in the
pictures. Variation is evident within and between the F3 families and within the bulks but not between the compared ‘green’ and ‘orange’ bulks;
(c) Accumulation of β-carotene and total chlorophylls (a + b) at four developmental stages. The values of β-carotene were obtained by HPLC
analysis, the values of chlorophylls were obtained spectrophotometrically and they are all means ± SD of three biological repeats. Each
repeat is constructed of 25 fruits, one from each of the F3families that comprise each of the bulks; (d) F3 fruit flesh color at four developmental
stages. Color difference between the bulks became visually evident at 30 DAA; (e) Quantitative HPLC analysis of carotenoid content in the mature
stage of each bulk: representative HPLC chromatograms of the elution profiles at 450 nm for each phenotype are presented. Lutein, α-carotene
and β-carotene were identified according to their characteristic retention time (RT), distinctive spectra and comparison with authentic standards.
Unidentified carotenoids are named by their characteristic RT. Pie-graphs sizes represent the relative total carotenoid content of the green
and the orange mature fruit bulks measured at 450 nm. The inner partition represents the relative integrated peak area at 450 nm
While ‘Dul’ plant on average was successfully pollinated
on May 15th 2012, ‘Tad’ plant on average was successfully
pollinated on May 23rd, exhibiting a substantial and significant (P < 0.01) eight days difference. However, the ‘successful pollination date’ of the ‘orange’ and the ‘green’ bulks
were both averaged to May 19th (18.95 and 19.24 on May,
respectively), indicating again the trait normalizing attribute of the bulking approach.
The same bulking genetic effect was also evident for
mono-genic traits, such as rind color of the young fruitlet, where young fruitlet dark green rind is dominant to
light green [21]. Fruitlet rinds at 10 DAA were either
dark green or light green (Fig. 3b). This trait segregated
equally between bulks, independently of fruit flesh color
and variation existed between and within the F3 families
of both bulks. The dark green rind of the young fruitlet
originated from ‘Dul’ (orange flesh parent) and is dominant over the light green rind that is derived from ‘Tad’
(green flesh parent). Out of the 25 families that were
used to construct the orange-flesh bulk, 6 had light
green rind, 7 had dark rind, and 12 segregated for this
trait. Out of the 25 families that were used to construct
the green-flesh bulk, 7 had light green rind, 5 had dark
rind, and 13 segregated to this trait as expected for independent monogenic trait. Fruits in the segregating families
were randomly chosen for each of the three replicates ensuring nearly similar representation of each phenotype
within each bulk. Taken together, the bulk approach distinguished fruit flesh color and normalized differences in
other unrelated traits between bulks. Thus, the transcriptome differences detected between the orange and green
flesh fruit bulks were expected to be mainly associated
with the effects of the CmOr gene.
Interestingly, we found a significant difference in mature
fruit total solid soluble (TSS, Brix0) between the bulks.
‘Tad’, the green parent, had higher TSS levels (15.9 Brix0)
than ‘Dul’ (13.9 Brix0), the orange parent (Additional file 1:
Figure S1 H). These were not equalized by the bulking
process and the ‘green’ bulk maintained significantly higher
TSS (14.5 Brix0) than the ‘orange’ bulk (13.1 Brix0)
(Additional file 1: Figure S1F-G).
β-carotene and chlorophyll accumulation during
fruit development
‘Dul’ fruit accumulates predominantly β-carotene in the
mesocarp tissue [7]. Fruit flesh β-carotene levels of the
‘green’ and ‘orange’ bulks were measured by HPLC at
four developmental stages: 10, 20, and 30 DAA and mature fruit (Fig. 3c). The fruit of the ‘green’ bulk contained
only traces of β-carotene in all fruit developmental
stages. The fruit of the ‘orange’ bulk started to accumulate β-carotene after 20 DAA, contained 2.8 μg per g of
fresh weight (FW) at 30 DAA and reached the level of
12.9 μg g−1 FW upon maturation.
Chlorophylls levels during fruit ripening were also
measured. The fruit of both the ‘orange’ and ‘green’
bulks contained 3.9 to 4.5 μg g−1 FW chlorophylls at 10
and 20 DAA, showing no significant differences (Fig. 3c).
Furthermore, both bulks accumulated higher levels of
chlorophylls at 30 DAA that declined toward maturation. However, the bulk of the green fruit contained
higher levels of chlorophylls than the bulk of the orange
fruit at 30 DAA (6.8 and 5.5 μg g−1 FW, respectively),
and the difference became larger at the mature stage
(5.5 and 2.6 μg g−1 FW, respectively).
Fruit flesh color within the bulks during the four developmental stages is shown in Fig. 3d and Additional file 1:
Figure S1C. The color difference between the bulks was
first visually noticed at 30 DAA (Fig. 3d), correlated with
the accumulation of β-carotene as measured by HPLC.
However, a slight difference in the fruit yellowness was
clearly identified at 20 DAA by the Chroma-meter measurements, followed by a more dramatic difference in fruit
redness, which was measured at 30 DAA and at the mature
stage (Additional file 1: Figure S1D). Mature fruit color
measurements of the parental lines, F1 hybrid and the bulks
of segregants are shown in Additional file 1: Figure S1E.
Chayut et al. BMC Plant Biology (2015) 15:274
Page 6 of 18
The dramatic difference in β-carotene levels during fruit
development was accompanied by different carotenoid
composition in the bulks. The mature fruit of the ‘orange’
bulk contained mainly β-carotene (90.9 % of the total integrated peak area at 450 nm). Other detected carotenoids
were lutein (0.75 % of the total integrated peak area at
450 nm), α-carotene (0.6 % of the total integrated peak
area at 450 nm), and 3 other unidentified carotenoids with
retention time (RT) 16.59, 18.19 and 25.25, comprising
1.5, 3.9 and 2 %, respectively, of the total integrated peak
area at 450 nm (Fig. 3e). The mature fruit of the ‘green’
bulk had a 14.2 times lower total integrated peak area of
detected carotenoids at 450 nm compared to the bulk of
orange melon fruit. We were able to quantify the peak
area of only three carotenoids of the bulk of green
fruit: β-carotene (49.1 % of the total integrated peak area
at 450 nm), lutein (32.8 %) and a third unidentified carotenoid (RT 4.66, 18.1 %) (Fig. 3e). We also identified traces
of phytoene and ζ-carotene in the orange fruit bulk at
their peak absorbance, 290 nm and 400 nm, respectively.
These intermediate carotenoids were undetectable in the
green fruit bulk (Additional file 1: Figure S2).
SNPs analysis
As described above, the bulks were constructed to
minimize differences between parental lines that were
not related to CmOr allelic variation. We were successful in
doing so as revealed by the identification of only 64 SNPs
between the ‘orange’ and the ‘green’ bulks. All SNPs were
located in a physical proximity to CmOr in a region of
2,258,903 bp on chromosome 9 (Fig. 4a; Additional file 2:
Table S2). These 2,258,903 bp, included 291 genes that
were annotated and listed in Additional file 3: Table S3.
Some of these genes may contribute to the differences between the bulks due to a genetic linkage with CmOr gene.
The CmOr allelic variation of six SNPs that were recently
reported [15], differentiated between the ‘green’ and the ‘orange’ bulks in 100 % of the reads (Fig. 4a, orange asterisk).
Except CmOr, there was only one additional gene adjacent
to CmOr that completely distinguished (100 %) between
the bulks; MELO3C005486. This gene is homologous to a
protein transporter that encodes for a pathogen-inducible
nitrate/nitrite transporters in grapevine and in Arabidopsis
[22] and is most probably not associated with carotenogenesis or chromoplasts biogenesis. Moreover, only 11 and 12
reads were recorded for the two SNPs identified within this
gene (Additional file 2: Table S2).
Comparative bulks transcriptome analysis
We used BSR-Seq of developing fruit mesocarp of the
‘green’ and the ‘orange’ bulks to identify cellular and
metabolic processes affected by CmOr allelic variation.
The 24 barcoded RNA-Seq libraries were sequenced
on a single lane of an Illumina HiSeq 2000 run. A total
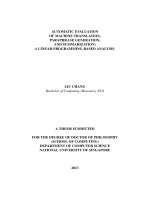
Fig. 4 Bulk segregant transcriptome and SNPs analyses of melon
fruit with different flesh color. a SNPs analysis of ‘green’ and ‘orange’
bulks of fruit identified only 64 SNPs (in genes with coverage higher
than at least ten reads in each bulk and showing more than 90 %
difference between bulks). All of identified SNPs surrounded CmOr
gene in a range of 2,258,903 on chromosome 9. Each point in the
figure represents one SNP. The X axis shows the location of each
SNP on chromosome 9 and the Y axis represents the percentage of
the polymorphic reads. Location of CmOr is marked with an orange
asterisk; (b) The number of DEGs using two different adjusted P values
(0.05 and 0.01) at the four analyzed fruit developmental stages. R is the
ratio between mean RPKM (reads per kilobase, per million sequenced
reads) of ‘orange’ bulk divided by mean RPKM of ‘green’ bulk; (c) and
(d). Venn diagrams of up-regulated P < 0.01 and R > 2 (c) and
down-regulated P < 0.01 and R < 0.5 (d) genes at the four fruit
developmental stages
of between 3.5 and 8.5 million reads from each library were produced with an average of 78.4 % of
them that were mapped to the melon genome. We
preformed statistical analysis to identify genes that
were differentially expressed between the ‘green’ and
the ‘orange’ bulks at the different fruit developmental
stages (Fig. 4b). A total of 79, 805, 37 and 122 genes
were differentially expressed at 10, 20, 30 DAA, and
the mature stage, respectively (Additional file 4: Table S4).
Noticeably, the largest number of DEGs were observed at 20 DAA, the stage when slight flesh color
change could first be measured by the Chroma-meter
(Additional file 1: Figure S2C).
Chayut et al. BMC Plant Biology (2015) 15:274
At the two earlier developmental stages (10 and 20
DAA), before significant amounts of carotenoids start
to accumulate, most of the up-regulated genes were
in the ‘orange’ bulk (67 %: 594 out of 884), while during
the two later stages (30 DAA and mature fruit) most of
the down-regulated genes were in the ‘orange’ bulk (62 %:
98 out of 159). The vast majority of the DEGs were
uniquely altered at a particular fruit developmental stage
(Additional file 4: Table S4). However, 26 genes were upregulated in the ‘orange’ bulk in two consecutive stages
and 6 were down regulated (Fig. 4c–d) (Additional file 5:
Table S5). Only one gene (MELO3C005241, a microtubule
binding protein) was differentially down-regulated in three
consecutive stages (Fig. 4c). Although this gene is cogentically linked to CmOr on chromosome 9 its effect on
carotenoids accumulation needs further studies.
qRT-PCR verification of BSR-Seq differentially
expressed genes
CmOr allelic variation caused transcriptomic changes
in fruit during maturation. In order to validate the
accuracy of the RNA-Seq data, we performed qRTPCR study of 30 selected DEGs along with CmOr.
These genes were selected according to their expression patterns and expression ratio between the bulks
of developing fruit. For each fruit developmental stage, we
chose DEGs displaying the highest ratio between ‘orange’
and ‘green’ bulks. The chosen DEGs expression at the
relevant stage of fruit development was substantially
higher than in the other stages. We measured by qRTPCR the relative expression of these selected DEGs in the
fruit flesh of the bulks and of the population parental
lines, ‘Dul’ (orange) and ‘Tad’ (green). The relative expression of each DEG was measured by qRT-PCR analysis at
the developmental stage in which the differential expression was first observed. In all the examined DEGs, the
qRT-PCR results were in accordance with the RNA-Seq of
the bulks (Additional file 1: Figure S3A). The correlation
coefficient (r) of the examined DEGs was 0.94 showing
highly significant correlation between relative and digital
expression (Additional file 1: Figure S3B). When parental
lines were included in the analysis, there was one gene
(MELO3C005487) that showed a complete opposite
relative expression pattern and additional four genes
(MELO3C008862, MELO3C005502, MELO3C001914
and MELO3C008287) that did not show different relative
expression between parental lines (Additional file 1:
Figure S3A). This can be best explained by the parental
lines different maturation paces, which were normalized in the bulks.
Cellular processes affected by CmOr
The DEGs at the different fruit developmental stages
were categorized into functional groups using MapMan
Page 7 of 18
[23]. This analysis revealed that the distribution of DEGs
in most functional classes varied depending on the fruit
developmental stage (Fig. 5). The relatively enriched
functional groups were those involved in transport, cell,
RNA and protein processes at 10 DAA, RNA, protein,
and signaling at 20 DAA, photosynthesis, RNA, and
stress at 30 DAA and photosynthesis at the mature fruit
stage (Fig. 5). The unclassified group of DEGs, distributed equally between melon fruit developmental stages.
Photosynthesis related genes: A total of 10, 9 and 19 of
the DEGs were clustered by MapMan analysis as photosynthesis related at 20 DAA, 30 DAA, and the mature
fruit stages, respectively. The photosynthesis related
cluster is the most abundant one in the two later developmental stages (Fig. 5). As shown in Fig. 3c chlorophyll
levels were similar in the ‘orange’ and the ‘green’ bulks
during the two earlier stages and differed at the two later
stages. Furthermore, the most notable shift in chlorophyll levels during fruit development was observed in
the ‘orange’ bulk between 30 DAA and the mature stage
(more than 2-fold reduction from 5.5 to 2.64 μg/gFW
tissue). In accordance, all the photosynthetic DEGs were
down regulated in the ‘orange’ bulk during these later
fruit ripening stages. These genes include structural
genes of photosystem I and II, as well as other electron
carrier and genes encoding for Calvin cycle enzymes
(Additional file 6: Table S6).
For example, the expression level of MELO3C000130,
an ortholog of the Arabidopsis large subunit of RUBISCO
(ATCG00490), was 4.3 times higher in the ‘green’ bulk
than in the ‘orange’ bulk at the mature stage. Another
gene was MELO3C01967, an ortholog of a light-harvesting
complex II subunit (AT1G29930), which transfers absorbed
light energy to the reaction center of photosynthesis. Its
expression level was doubled in the ‘green’ bulk at the mature stage. A third example was MELO3C008731, an
ortholog of AT4G12800 that encodes for subunit L of
photosystem I reaction center in Arabidopsis. Its expression was 2.6 higher in the ‘green’ bulk than in the 'orange’
bulk at the mature stage. The down-regulation of these
genes in the orange fruits was concomitant with the difference in chlorophyll contents between the orange- and
green-flesh fruits (Additional file 6: Table S6).
RNA related genes: A total of 7, 77, 8 and 6 DEGs were
clustered as RNA related at 10, 20, 30 DAA and in mature fruit, respectively. At 20 DAA, RNA was the most
abundant functional group. Noticeably, among the 77
RNA-related DEGs, 75 were transcription regulators.
These differentially expressed regulators probably played
a role in the transcriptional differences of a large number of genes between the ‘orange’ and ‘green’ bulks at 20
DAA, the time point of the initiation of fruit flesh color
transition. It is likely that a regulatory network of transcription was activated in the CmOr orange bulk fruit.
Chayut et al. BMC Plant Biology (2015) 15:274
Page 8 of 18
Fig. 5 Cellular processes affected by CmOr. Gene counts according to their MapMan bin-code name of cellular processes. Each bar represents
the number of DEGs between the ‘green’ and the ‘orange’ bulks at (from top to bottom) 10, 20 and 30 DAA and at mature fruit stages. An adjusted
P value of 0.01 was used to detect DEGs at 10, 20 DAA and the mature fruit stages, while for 30 DAA we used an adjusted P value of 0.05.
PS = Photosynthesis; CHO = carbohydrates; met = metabolism; syn = Synthesis; mito. E transport = mitochondrial electron transport; cofac
& vit = cofactors and vitamins; C1 = one carbon
Interestingly 11 differentially expressed transcription factors at 20 DAA belonged to the APETALA2/ethylene-responsive element binding protein family (AP2/EREBP).
The AP2/EREBP supergene family is known to be involved in the regulation of stress related genes [24]
(Additional file 6: Table S6).
Stress related genes: The Or gene has been previously
associated with photo-oxidative stress responses in cauliflower (Brassica oleracea) and the Or mutant seedlings
during de-etiolation showed higher expression levels of
ROS-responsive genes [25]. Moreover, in sweet potato
(Ipomoea batatas) callus system, overexpression of IbOr
was associated with increasing of salt stress tolerance
[26]. A total of 1, 47, 7, 6 DEG were clustered as stress
related at 10, 20, 30 DAA and in mature fruit, respectively. At 20 DAA, 19 of these DEGs were related to heat
stress, 13 to biotic stress, and 9 to drought/salt stress response, 2 to wounding/touch stress, and 4 genes to
unassigned stress response (Additional file 6: Table S6).
Abscisic acid (ABA) is a product of the carotenoid metabolic pathway (Fig. 1) and its production is regulated by environmental cues [27]. ABA is known to regulate genes in
response to environmental changes, in particular osmotic
stress as reviewed in [28]. MELO3C005129, an ortholog of
xanthoxin dehydrogenase (AT1G52340; ABA-2), encodes a
cytosolic short-chain dehydrogenase converting xanthoxin
to ABA-aldehyde during ABA biosynthesis. Its expression
was higher at all the developmental stages in the ‘orange’
bulk, statistically significant and above the 2 fold cutoff at
30 DAA and in mature fruit (2.8 fold and 4 fold higher,
respectively) (Additional file 1: Figure S4).
Protein metabolism and processing related genes: A
substantial number of DEGs were assigned as genes
associated with protein-related processes. A total of 6,
62, 3, and 3 DEGs were clustered as protein related at
10, 20, 30 DAA and in mature fruit, respectively (Fig. 5).
At 20 DAA, the stage when major transcript differences
between the ‘orange’ and the ‘green’ bulks were noted,
25 genes were assigned to protein degradation, 27 were
assigned to posttranslational protein modification (out
of which 15 were kinases), 3 to protein targeting and 3
to protein synthesis (Additional file 6: Table S6).
Changes in genes involved in carotenoid metabolism
Interestingly, the genes annotated to encode for enzymes
in the carotenoid biosynthesis pathway were expressed
similarly in both bulks (Fig. 6). Clearly, the transcript
levels of carotenogenesis genes alone could not explain
the higher carotenoid accumulation in the fruit flesh of
the ‘orange’ bulk. However in the ‘orange’ bulk, where
Chayut et al. BMC Plant Biology (2015) 15:274
Page 9 of 18
Fig. 6 Expression of carotenogenesis genes. Each bar is the average RPKM of three biological repeats at each fruit developmental stage. Error
bars represent standard error of the mean. When there was more than one melon gene annotated, we chose to present the gene with the
highest expression. The gene IDs are () PSY-1, MELO3C025102; PDS, MELO3C017772; ZDS, MELO3C024674; CRTISO,
MELO3C016495; β-LCY, MELO3C020744; ε-LCY, MELO3C004633; β-OHase, MELO3C014945; ZEP, MELO3C020872; CCD4, MELO3C016224; CCD1,
MELO3C023555; and CmOr, MELO3C005449
carotenoids are accumulated in the fruit, carotenogenesis
genes expressions seem to schedule the accumulation and
to regulate the carotenoid composition. PSY-1 and PDS
activities are responsible for carotenoid levels [1, 29]. The
increased expression of PSY-1 and PDS was associated
with the enhanced carotenoids levels at 30 DAA and mature stage of orange fruits. The very low transcript level of
ε-LCY together with higher transcript level of β-LCY
might direct the metabolic flux toward the production of
β-carotene rather than α-carotene. β-OHase was downregulated between 20 and 30 DAA and its low expression
continued until the mature stage. The low transcript levels
might reduce further modification of β-carotene into zeaxanthin and explain the dominance of β-carotene in the
melon fruit flesh carotenoid composition.
Similarly, genes upstream of the carotenogenesis metabolic pathway in the MEP pathway were not differently
expressed between the bulks (Additional file 1: Figure S5).
Thus, MEP gene expression is not affected by CmOr
allelic variation and could not explain the ‘orange’ bulk
phenotype. Similarly to the structural carotenogenesis
genes, MEP genes were up-regulated at 30 DAA and at
the mature stage of both bulks in correlation with the
time of carotenoid accumulation in the ‘orange' bulk.
DXS (MELO3C014965), which encodes the enzyme
synthesizing 1-deoxy-D-xylulose-5-phosphate (DXP),
was 5.9 fold higher in the mature fruit comparing to
fruits at the earlier stages (Additional file 1: Figure S5).
DXR (MELO3C026292), the next gene of the pathway,
was also up-regulated during the later fruit developmental
stages (Additional file 1: Figure S5). The next enzymatic
step is the synthesis of GGPP, the building blocks of phytoene by geranylgeranyl reductase (GGR; MELO3C013320).
GGR was also up-regulated in the later fruit maturation
Chayut et al. BMC Plant Biology (2015) 15:274
Page 10 of 18
stages (Additional file 1: Figure S5). We did not find significant changes of the downstream genes of the metabolic
pathway other than up-regulation of ABA-2 in the ‘orange’
bulk as described above (Additional file 1: Figure S4).
Sugar metabolic pathway analysis
We used plant MetGenMAP [30], a web-based bioinformatics tool, to search for significantly altered metabolic
pathways. The significantly changed pathways included
galactose and sucrose degradation (P value = 0.017, 0.028
respectively) at 20 DAA. In sweet melon, stachyose and
raffinose are translocated to the fruit and sucrose accumulation is associated with developmentally regulated transcriptional changes of sugar metabolism genes in the fruit
sink itself [31]. Our results indicated significant changes in
expression of genes related to sugar metabolism at 20
DAA. We marked the DEGs that were pointed out by
MetGenMAP on the previously elucidated metabolic
pathway leading to melon fruit sucrose accumulation
(Fig. 7). The two genes leading directly to sucrose synthesis, SUSY (which acts in both directions) and SPS were
up-regulated in the ‘green’ bulk at 20 DAA, while genes
degrading sucrose (invertase) and shifting the metabolic
flux away from sucrose (fruktokinase) were up-regulated
in the ‘orange’ bulk at 20 DAA (Fig. 7, Additional file 4:
Table S4). The causal gene for these significant changes
could be either CmOr or another gene genetically linked
to CmOr.
Sugars levels and composition at 30 DAA and at the
mature fruit stage
Sucrose accumulation in melon fruits is a developmentally regulated process. Previous studies showed
that young developing melon fruits do not accumulate
sucrose [32, 33] and that sucrose is accumulated following transcriptional changes in fruit sugar metabolism genes [31]. The transcriptional changes in sugar
metabolism found here are consistent with the observation that mature fruit TSS was higher in the ‘green’
bulk. Since numerous previous studies showed strong
correlation between mature melon fruit TSS and sucrose levels [34–36], we analyzed sugar content and
composition at the late fruit developmental stages,
when melon fruit accumulate sucrose [31, 32].
Expectedly, quantification of soluble sugars by HPLC
at 30 DAA and at the mature stage indicated that sucrose levels significantly increased from 30 DAA to the
mature stage (P < 0.05), partially at the expense of glucose and fructose levels (Fig. 8). Comparison of sugars
levels between the bulks at each analyzed developmental
stage, indicated that the differences in TSS were indeed
due to the sucrose levels that were significantly higher in
green fruit than in orange fruit at both stages (10 vs.
6.25 and 52.98 vs. 43.32 mg/g FW at 30 DAA and at the
Fig. 7 DEGs related to sucrose metabolism. a 20 DAA DEGs placed on
metabolic pathways leading to sucrose accumulation in melon fruit;
sucrose synthase (a) and sucrose-p-synthase (b) leading to sucrose
accumulation are up-regulated in the ‘green’ bulk (green letters) while
acid invertase (c) and fructokinase (d), leading to turnover of sucrose
and sucrose precursors are up-regulated in the ‘orange’ bulk (orange
letters). Unmarked arrows indicate genes with similar expression levels
in the ‘orange’ and the ‘green’ bulks. This schematic pathway was
modified after [33]. Glc-glucose, gal- galactose, fru-fructose,
suc-sucrose, P-phosphate; (b) Expression pattern of the four DEGs
marked in A during fruit development (10, 20, 30 DAA and mature
fruit). The genes IDs are (): a MELO3C015552,
b MELO3C010300, c MELO3C005363, and d MELO3C014574
mature fruits, respectively), while glucose and fructose
differences were insignificant (Fig. 8).
Discussion
BSR-Seq approach for the identification of genes and
cellular processes that are associated with traits of interest
BSR-Seq is a straightforward method for mapping monogenic traits. Using this approach, an early study mapped a
characterized maize mutant glossy3 to the previously
Chayut et al. BMC Plant Biology (2015) 15:274
Page 11 of 18
SNPs analysis between bulks. Using BSR-Seq of orange
and green fruited F3 families, we identified only two
tightly linked genes that completely differentiated between these bulked phenotypes (Fig. 4a). It is most
likely that by adding more F3 families within each bulk
one would raise the probability to identify CmOr alone
due to recombination events. However, for breeding
purposes, a marker in close proximity to the genes of
interests can probably be found by using even less F3
families in a smaller and cheaper experimental design.
A global transcriptional view of cellular processes
associated with CmOr allelic variation
Fig. 8 Melon’s sugars content. Sucrose, glucose and fructose content
in fruit flesh were measured by HPLC at 30 DAA and in mature bulks
of orange and green fruits. Each bar represents the mean of 75 fruits;
three fruits from each of the 25 families comprising each bulk.
Differences in sucrose levels are significant in both developmental
stages (P < 0.05)
known locus at an interval of ~2 Mb. The only down regulated gene located in this interval in the mutant bulk was
shown to be the glossy3 [19, 20].
Using BSR-Seq of ‘green’ and ‘orange’ bulks, derived
from a cross between ‘Dul’ (orange fruit flesh) and
‘Tad’ (green fruit flesh), we demonstrated the competence of this method to investigate the specific transcriptomic effects of a single mutation, similarly to the
accepted use of near-isogenic lines. BSR-Seq approach
was effective in normalizing phenotypes (Fig. 3 and
Additional file 1: Figure S1) and genotypes (Fig. 4a) that
differentiate between the parental lines but are unrelated to fruit flesh color, our trait of interest. Thus, the
BSR-Seq approach led us to identify metabolic and
cellular processes that are associated with the CmOr
allelic variation. The transcriptome analysis suggested
an activation of transcription regulation and of protein
metabolism at the initiation of β-carotene accumulation. Furthermore, BSR-Seq analysis of mature fruits
suggested a loss of the photosynthetic apparatus in orange but not in the green fruits. BSR-Seq analysis of
fruitlets at 20 DAA indicated a later initiation of the sucrose accumulation stage in the orange fruit compared to
the green fruit. We were able to link the two latter transcriptional differences to the physiological differences in
mature fruit: the orange high β-carotene accumulating
fruit had lower chlorophyll and lower sucrose levels compared to the green low β-carotene accumulating fruit.
Our results also demonstrate that BSR-Seq experimental design is indeed an advantageous tool for gene
discovery. The identity and the role of CmOr in determining fruit flesh color in melon would be discovered
using the experimental design as demonstrated with the
The phenotype of BoOr mutant was first described in
1975 [37]. The BoOr mutated gene triggers the biogenesis
of chromoplasts, which serve as metabolic sinks for carotenoid accumulation [16, 17]. Recently, Zhou et al. [38]
showed that the wild-type Arabidopsis OR protein (AtOR)
directly interacts with PSY and post-transcriptionally regulates PSY enzymatic activity as a mechanism by which
AtOR boosts carotenogenesis in plastids. However, the
mechanisms underlying the OR-regulated chromoplast
biogenesis and its associated cellular processes are still not
fully understood.
We performed comparative transcriptome analysis in
hypothesis driven as well as in hypothesis driving means.
The hypothesis driven approach included searching for
changes in the expression of expected candidate genes
(e.g., carotenogenesis genes). This approach revealed that
CmOr did not regulate carotenogenesis genes expression,
similarly to what had been previously found in cauliflower
[39]. However, by clustering DEGs and studying the cluster
annotations in a hypothesis driving manner, we found that
CmOr allelic variation affected the expression of photosynthetic genes expression; was associated with protein metabolic processes; RNA regulation; and was correlated with
cellular stress responses.
CmOr association with photosynthetic genes
The most notable phenotype governed by CmOr allelic
variation was a drastic increased level of β-carotene in the
orange ripe fruit mesocarp (Fig. 3c and Additional file 1:
Figure S2). The increasing carotenoid accumulation in the
‘orange’ bulk was associated with a decrease in chlorophyll
levels (Fig. 3c), Lower chlorophyll levels together with
down-regulation of photosynthetic and chloroplast associated genes in the ‘orange' bulk (Additional file 6: Table S6),
may indicate chloroplast degradation or chloroplast to
chromoplast transition. Transition from chloroplast to
chromoplasts has been well described during tomato fruit
development [40], yet this process had never been associated with melon fruit development, where biogenesis of
chromoplasts directly from non-colored plastids has been
hypothesized [15].
Chayut et al. BMC Plant Biology (2015) 15:274
CmOr association with protein post-translational
regulation
While direct interaction of AtOR and AtPSY was recently described [38], our results suggest that additional
post-transcriptional protein regulation was associated
with CmOr. At 20 DAA, 62 DEG were related to protein modifications, including genes whose products are
involved in protein degradation, protein folding and
post-translational modifications, such as glycosylases,
phosphorylases and carboxylases (Additional file 6:
Table S6). The different expression of these genes was
measured at the stage when color phenotypic difference
was first seen (Additional file 1: Figure S1D). Further
investigation of the associations of these genes with
carotenoid accumulation in melon broad germplasm or
in other fruit species will add new information towards
our understanding of how CmOr regulates massive
carotenoid accumulation.
CmOr association with RNA regulation
Phytoene biosynthesis and desaturation, the first two steps
of carotenogenesis are catalyzed by PSY and PDS (Fig. 1).
Arabidopsis PSY and PDS were shown to include ATCTA
cis acting element which are bound by the AtRAP2.2 transcription factor, a member of the APETALA2/Ethylene-responsive element binding factors (AP2/ERF) gene family
[41–43]. Here we show that CmOr allelic variation is associated with differentially expressed RNA regulation genes,
11 of them belong to the AP2 gene family. However, we
did not record differential PSY or PDS expression between
the bulks. Arabidopsis PSY was also shown to be directly
regulated by transcription factors of the phytochrome
interacting factors (PIFs) which belong to the Basic
Helix-Loop-Helix protein family (bHLH) [44]. Our
data shows 11 bHLH transcription factors differentially expressed in association with CmOr allelic variation. PSY1 promoter in tomato fruit was shown to
directly interact with the MADS-box transcription
factor RIPENING INHIBITOR [45].
The above examples suggest a complex role of transcription factors in regulating carotenogenesis. Still, very
little is known about specific transcription factors which
putatively play a role in carotenoid accumulation in
melon and in other fleshy fruits. The data we describe
here, of 75 deferentially expressed transcription factors
at 20 DAA (Additional file 6: Table S6), may be used in
the future to search for such factors. It is reasonable to
assume that some of these transcription factors are mediators of chromoplast biogenesis, which is the major
known role of the OR protein [16, 17].
CmOr association with cellular stress responses
At 20 DAA, 47 DEGs were clustered as stress related
(Fig. 5, Additional file 6: Table S6). The stress related
Page 12 of 18
and ABA synthesis DEGs (Additional file 1: Figure S4)
probably did not act to promote a stress response since
they were measured in green and orange melon fruits of
vivid and well irrigated plants. This difference could
result simply from the higher availability of ABA precursors (Fig. 1) or from yet unknown roles of these genes in
fruit carotenoid accumulation. Alternatively, these DEGs
might suggest a regulatory role of CmOr in controlling
stress related genes.
In an evolutionary perspective, carotenoids were probably first evolved for their fundamental roles in photosynthesis. Later, they gained new adaptive roles as precursors
of land plant hormones ABA and strigolactones (SL) [1].
In the later evolution of angiosperms, carotenoids were recruited to serve as pigments of flowers and fruits and their
apocarotenoids derivatives were evolved to act as visual
and volatile signals to attract pollinating and seed dispersal
agents [46]. The Or gene, which functions as a regulator
of carotenoid accumulation, is conserved throughout the
plant kingdom, including primitive vascular plants i.e., the
lycophyte Selaginella moellendorffii, the bryophyte Physcomitrella patens [15] and even in the more primitive unicellular green alga Chlamidomonas [17]. While the Or
gene could had gained a totally new function in recent
evolutionary times, a parsimonious possibility might suggest that Or serves as a regulatory gene of the carotenoid
metabolic pathway leading to ABA and SL production.
ABA and SLs are related to plant environmental stress
responses such as drought and salinity [28, 47].
In fruits of well irrigated flourishing plants the putative
role of Or in mediating stress response through carotenoid
derived hormones seems to be phenotypically meaningless. However, this role can be clearly observed at the transcriptional level (Fig. 5 and Additional file 6: Table S6).
We assume that the transcriptional stress response documented in our results may hint not only the ancestral role
of Or but also to its role in other plant tissues.
CmOr association with protein metabolism and processing
Sixty two of the 74 DEGs that were assigned as genes associated with protein-related processes were discovered at 20
DAA (Fig. 5). Forty seven, out of these 62 DEGs, were
up-regulated in the ‘orange’ bulk, suggesting active
protein metabolism in the orange melon fruit in comparison to green fruit. MELO3C004635, which was
clustered as posttranslational modification kinase and annotated as mitogen-activated protein kinase (MAPK), was
expressed 3.3 times higher in the ‘orange’ bulk. MAPK in
leaves of maize plants was shown to be involved in ABA
induced antioxidant defense reaction [48]. Two other kinases, which were up-regulated in the ‘orange’ bulk at 20
DAA, were MELO3C019919 and MELO3C026658 (3.09
and 2.37 fold higher than in the 20 DAA ‘green’ bulk, respectively) that possess a leucine-rich repeat motif. This
Chayut et al. BMC Plant Biology (2015) 15:274
motif, which is present in proteins of diverse functions,
provides proteins with a flexible structure to facilitate protein–protein interactions [49].
CmOr allelic variation did not alter carotenogenesis
gene expression
Transcriptional regulation of carotenoid metabolic pathway genes has been shown to be an important mechanism
in controlling carotenoid levels in various plant species
and tissues. In white flesh loquat mesocarp, low carotenoid content is associated with lower expression levels of
PSY1, β-LCY, and β-OHase in comparison with their levels
in orange flesh cultivar [50]. In marigold petals, the variation of carotenoid levels is attributed to MEP and carotenogenesis gene expression [51]. In tomato fruit, PSY1
gene expression is closely associated with carotenoid levels
during development [52]. Degradation processes has also
been associated with fruit carotenoid accumulation, for
example in peach fruits, where lower carotenoid levels in
the white cultivars are associated with higher transcript
levels of CCD4, which cleaves carotenoids [53].
Here we show the association between PSY1 expression and β-carotene accumulation in developing orange
colored fruits (Fig. 6). Surprisingly, the bulk of green
fruit that do not accumulate carotenoids during fruit development exhibited the same fruit development associated expression pattern of PSY1. Similar to PSY1, almost
all the genes leading to the formation or degradation of
β-carotene, including DXS, DXR, GGR, CmOr, ZDS and
PDS and CCD, were up-regulated during green fruit
maturation. Their expression patterns were in good
association with carotenoid accumulation in the orange
bulk fruits, however, the CmOr recessive allele of the
green fruit was not capable to induce massive carotenoid
accumulation and ‘green’ bulk fruits did not accumulate
carotenoids (Fig. 6 and Additional file 1: Figure S4). This
could happen due to a rapid carotenoid turnover, due to
an inability to form proper sink structure for stable storage [54], due to an inability to interact with PSY-1 [40]
or due to another yet unknown mechanism.
The transcriptional changes of carotenogenic genes during orange melon fruit development also explain the predominant β-carotene accumulation in melon fruit; β-LCY
was up-regulated and ε-LCY was down regulated, channeling the metabolic flux away from the α-carotene/lutein
branch and towards the β-carotene branch (Fig. 1). Furthermore, β-OHase was down regulated during fruit development, decreasing further metabolism of β-carotene.
Undoubtedly, these close associations cannot explain the
color phenotype change, as all these gene expression patterns are maintained in the ‘green’ bulk as well (Fig. 6 and
Additional file 1: Figure S4).
Since orange vs non-orange melon fruit flesh phenotype is determined by a single dominant gene (CmOr)
Page 13 of 18
and bulks of F3 families were analyzed, we can safely assume that the carotenoid biosynthesis capacity is similar
in the two bulks. Fruit carotenoid level is the sum of
synthesis, turnover rates and availability of storage capacity [16]. Since expression levels of biosynthetic and
turnover genes are similar in green and orange melon
fruit (Fig. 6), the accumulation of massive β-carotene in
orange melon is likely due to the specific ability of
CmOr in facilitating stable storage of carotenoids in
chromoplasts, as was shown in BoOr cauliflower mutant
and in transgenic potato overexpressing BoOr [55, 56].
Sugar and carotenoid metabolism
We found a significant difference in mature fruit total
solid soluble (TSS, Brix0) between the bulks. This suggested the existence of a direct or indirect metabolic link
between fruit β-carotene and sugar accumulation or alternatively, a close genetic linkage between CmOr and a
regulator of fruit sugar accumulation.
Carotenoid and soluble sugar accumulation levels were
found to be correlated in various plant species and tissues. Recently a positive correlation between carotenoid
and sucrose contents was demonstrated using melon recombinant inbred lines population derived from a cross
between ‘Dul’ (sweet and orange) and PI414723 (nonsweet and pale orange) accession [57]. In the tomato
fruit pericarp, lycopene accumulation was repressed by
sucrose deficiency [58]. In citrus fruit epicarp, chloroplast to chromoplast transition (degreening) is initiated
by elevation of soluble sugar levels and the process can
be reversed (greening) by lowering sucrose concentration
[59]. In transgenic maize, over-expression of carotenogenesis genes (PSY1 and CrtI) influenced core metabolic processes in seed endosperm including a higher accumulation
of sucrose [60].
In the present study, a comparison of green and orange
fruit bulks of F3 families, derived from a cross between
‘Dul’ (sweet and orange flesh) and ‘Tad’ (very sweet and
green flesh) revealed higher sucrose accumulation in green
fruit segregants. The transcriptome data may provide an
explanation to this result. Developing sweet melon fruits
undergo a metabolic transition from a growing phase, during which stachyose and raffinose that are translocated to
the young fruit are enzymatically processed and degraded,
to a sugar accumulation phase, which is evident at the
transcriptional level [33–35]. Acid invertase is downregulated leading to a near cessation of sucrose degradation and sucrose phosphate synthase is up-regulated,
boosting the synthesis of sucrose [33]. Together these
changes make up part of the metabolic transition to sucrose accumulation [33]. We show here that genes involved in the transition to the fruit sucrose accumulation
phase were differently expressed in the ‘green’ and ‘orange’
bulks during fruit development, most notably at 20 DAA
Chayut et al. BMC Plant Biology (2015) 15:274
(Fig. 7); acid invertase was down-regulated while sucrose
phosphate synthase was up-regulated in the ‘green’ bulk
compared to the ‘orange’ bulk.
Two alternative mechanisms could explain these transcriptional changes: a metabolic link, as shown recently
in transgenic maize [60]; or a genetic linkage between
CmOr and a gene (or genes) that regulates sucrose accumulation. MELO3C005363, annotated as acid invertase,
is physically linked to CmOr (778,126 bp distant), and
was differently expressed between the bulks (Fig. 7b).
This physical proximity of CmOr and acid invertase is
expected to result in segregants having the same parental alleles for both genes in most of the bulked fruits
(Additional file 3: Table S3).
Final melon sucrose levels are primarily governed by the
number of days passing from the decline in soluble acid invertase activity to fruit harvesting [34]. Down-regulation of
acid invertase at 20 DAA in the ‘green’ bulk (Fig. 7) is most
likely the cause for the higher sucrose levels in the green
fruit, although we can’t exclude other unknown linked
genes or a metabolic pleotropic effect of CmOr. To address
the question of whether MELO3C005363 is the causal
gene for the phenotype difference, F4 recombinant lines
between CmOr and MELO3C005363 will be studied and
analyzed in detail for sugar accumulation and metabolism.
Conclusions
Comparative BSR-Seq analysis is a useful tool to reveal the
transcriptomic impact of regulatory genes allelic variation.
When utilizing the BSR-Seq approach, special care has to
be taken regarding genes linked to the regulatory gene, as
demonstrated in our study with acid invertase, which is
linked to CmOr and possibly affected differences in fruit
sugar content between the bulks. Nevertheless, our comparative approach revealed associations between CmOr allelic variation and cellular and metabolic processes during
melon fruit ripening and generated a list of deferentially
expressed genes that were affected by CmOr allelic variation. These genes and the processes that they are involved
in are most probably part of the regulatory network
governed by CmOr allelic variation. Sequence variations in
some of these genes may be involved in the quantitative
regulation of carotenoid accumulation in melon fruit and
could be applied as new targets for breeding high carotenoid content melons.
Methods
Plant materials and bulk construction
A population segregating for fruit flesh color was constructed by crossing two previously characterized melon
inbred lines: ‘Dulce’ (‘Dul’) and ‘Tam-Dew’ (‘Tad’). ‘Dul’
is an orange flesh, climacteric line belonging to the taxonomic group reticulatus and marketed as a Cantaloupe
type. ‘Tad’ is a green flesh, non-climacteric line of the
Page 14 of 18
taxonomic group Inodurus and marketed as a HoneyDew type. ‘Dul’ is homozygous dominant CmOr, while
‘Tad’ is homozygous recessive Cmor. This population
was previously used to associate CmOr with the orange
fruit phenotype, controlled dominantly by the green-flesh
or CmOr gene [15]. As expected, the fruit flesh of the F1
offspring was always orange and the F2 fruit flesh color
segregated to orange and green in the expected 3:1 ratio
[15]. We self-pollinated F2 plants and defined each F2
plant offspring as an F3 family.
To generate bulk fruit material, 25 green and 25 orange
fruit flesh homozygous F3 families (each family is originated from seeds of one F2 fruit) were chosen. DNA of
first true leaf of 10 plantlets of each F3 family were pooled,
amplified using the primers listed in Additional file 7:
Table S1 and the amplicon was digested with HinfI
enzyme, which cuts only the dominant allele (from orange flesh). The calculated chance to miss an orange
segregating family was 1/3^10 or 1.69x10⁻⁵. Genotyping was validated by visualization of the mature flesh
color of 12 plants of each selected F3 family. The calculated chance to miss an orange segregating family
was 1/3^12 or 1.88x10⁻⁶. Thirty plants of each F3 family were grown in an open field during the summer of
2012 at the Newe Ya’ar research center in Northern
Israel. Female flowers were marked on the day of anthesis. Three fruits from each family were picked at
10, 20, and 30 days after anthesis (DAA), as well as
upon maturity (40–45 DAA). Twenty five fruits (one
from each F3 family) were bulked to construct each
biological repeat at each developmental stage. Three
biological replicates were sampled. The large plant
number grown in each F3 family allowed us to sample
equal number of fruits for each color and developmental stage combination at every field sampling day,
eliminating possible effects relating to time of maturation, circadian changes and environmental effects.
Fruit flesh samples were immediately frozen in liquid
nitrogen and kept in −80 °C until use.
RNA extraction, library construction, and sequencing
Total RNA was extracted from bulked fruit mesocarp
tissues following the protocol described by [61]. A
total of 24 samples (2 genotypes x 4 developmental
stages x 3 biological replications) bulked from 25
homozygous green or orange F3 families at different
developmental stages were used for the strand-specific
RNA-Seq library construction following the protocol
previously described by [62]. Briefly, polyA mRNA was
enriched by oligo(dT)25 Dynabeads from 5 ug of total
RNA. The first strand cDNA was synthesized using
SuperScript III reverse transcriptase (Invitrogen) and primer oligodT-VN (NEB). The second strand was formed
using DNA polymerase. The synthesized cDNA was end-
Chayut et al. BMC Plant Biology (2015) 15:274
repaired and dA-Tailing. Barcode adapter was then added
to each cDNA by T4 ligase, followed by purification and
digestion with Uracil DNA glycosylase (NEB). The cDNA
library was enriched by PCR using standard Illumina
primers. AMPure XP beads were used to purify products
after each step. The barcoded libraries (20 ng) were bulked
and sequenced on a single lane of Illumina HiSeq 2000
sequencing system at the Cornell University core facility
( />
Page 15 of 18
housekeeping genes: melon cyclophilin and melon
ARP-1. Primers were designed using primer 3 software and are listed in Additional file 7: Table S1. A
melting curve analysis was performed for each reaction to confirm the amplification specificity. Real-time
PCR was performed in triplicates. For ‘Dul’ and ‘Tad’
parental lines, we pooled fruit mesocarps of 6 fruits
and homogenized them before RNA extraction. Cq
values were determined by the ABI Prism 7000 SDS
software and analyzed according to [69].
RNA-Seq data analysis
RNA-Seq reads were first aligned to the ribosomal RNA
database [63] using Bowtie [64] allowing up to three
mismatches and those that were aligned were discarded.
The resulting reads were aligned to the melon genome
[13] using TopHat [65] allowing one segment mismatch.
The sequencing statistics and the correlation matrix are
provided in Additional file 8: Table S7. Following alignments, raw counts for each melon gene were derived
and normalized to reads per kilobase of exon model per
million mapped reads)RPKM). The raw counts of melon
genes were fed to edgeR [66] to identify differentially
expressed genes (DEGs) between the ‘orange’ bulk and
the ‘green’ bulk at each of the four developmental stages.
Genes with adjusted p-value less than 0.01 and fold
change greater than or equal to 2 were identified as
DEGs. The DEGs were functionally classified using
MapMan [23]. Changed metabolic pathways were identified using Plant MetGenMAP [32].
Pigments analyses
Carotenoids were extracted in a mixture of hexane:acetone:ethanol (2:1:1, v/v/v) as described previously [70] and
separated using a Waters 2695 HPLC apparatus equipped
with a Waters 996 PDA detector (Milford, MA) [71].
Carotenoids were identified by their characteristic absorption spectra, distinctive retention time and comparison to
authentic standards. Quantification was performed by
integrating the peak areas with standard curves of authentic standards and the Waters millennium chromatography
software. Lutein and two other unidentified carotenoids
were relatively quantified at 450 nm by integrating their
peaks areas and calculating its percentage from total integrated peaks areas.
Total chlorophylls were quantified according to [72].
Chlorophyll extracts were diluted 10 times in acetone
and the absorbance of the samples was measured at
661.6 nm and 644.8 nm. Content of chlorophylls was
calculated as follows:
SNPs identification
To minimize the artifacts of PCR amplification in SNPs
identification, only one of the duplicated RNA-Seq reads
in each library was used. To identify SNPs between the
‘green’ and the ‘orange’ bulks, RNA-Seq reads from the
four stages of each bulk were first pooled and the pooled
reads were aligned to the melon genome using BWA [67].
Only uniquely mapped reads (those having one single best
hit to the melon genome) were kept. Following mapping,
SNPs were identified based on the mpileup files generated
by SAMtools [68]. The identified SNPs were supported by
at least ten reads and had allele frequency of at least 0.9.
Quantitative RT-PCR
To verify the RNA-Seq data, the cDNA was synthesized
from the fruit RNA samples using Verso cDNA synthesis
kit (Thermo Fisher Scientific). Quantitative RT-PCR
(qRT-PCR) was conducted using the SYBR Green PCR
master mix in an Applied Biosystems 7500 Real Time
PCR System (Applied Biosystems, CA). PCR conditions
were: denaturation at 95 °C for 20 s, 40 cycles of 95 °C for
3 s and 60 °C for 30s, 95 °C for 15 s, followed by 60 °C for
60s and gradual heating to 95 °C for melt curve construction. Relative expression levels were normalized with two
Chla þ Chlb ðμg=mL acetoneÞ ¼ ð11:24 Â A661:6 – 2:04 Â A644:8 Þ
þð20:13 Â A644:8 – 4:19 Â A661:6 Þ
Fruit flesh color analysis
We used a Chroma-meter Konica-Minolta CR-400 as an
unbiased method to define the visualized color phenotype of the sampled developing fruits. CIE color space
L*, a* and b* values were obtained at three points of
each fruit cross section. L* represents lightness (ranging
from 0, black to 100, white), a* represents red (positive)
to green (negative) axis, and b* represents yellow (positive) to blue (negative) axis. The colorimeter was
calibrated on a white plate before each use.
Sugar analysis
One gram of frozen mesocarp tissue of each of the 300
fruits comprising the bulks at 30 DAA and at the mature stage (25 families X 3 biologic repeats X 2 color
phenotype X 2 developmental stages) was put in 80 %
EtOH. Sugars were extracted and analyzed by HPLC as
described [73].
Chayut et al. BMC Plant Biology (2015) 15:274
Availability of supporting data
The raw sequencing data has been deposited in NBCI
SRA under the accession number SRP059243.
Additional files
Additional file 1: Figure S1. Bulk phenotype during fruit development
and parental line phenotype at the mature fruit stage. A. Average weight
of fruits sampled for the BSAseq. Each point represents the mean of
three repeats from each of the 25 F3 families that comprise each bulk.
The green and orange dots and lines represent the green and orange
flesh bulks respectively. The orange dots and line represent the orange
flesh bulk. X axis is DAA. No significant fruit weight differences were
detected. B. Mature fruit weight of the parental lines. Each column
represents the average of 6 fruits. Error bars are standard error of the
mean. C. Histograms show proportion of different weight groups (Kg) in
the entire population (gray columns) and in the sampled orange and
green fruit (orange and green columns respectively). The orange and
green subpopulations display normal distribution around the mean
according to Goodness of Fit test. (Jump-8 software). C. Chroma-meter
(Minolta Sensing Inc, Minolta Chroma Meter Model CR-400, Osaka, Japan)
measurements of the developing fruits described in A. Each cut-open
fruit was measured at three points of the mesocarp center. The Y axes
colored bars illustrate the color range of a*, b* and l* values (see material
and methods). D. Chroma-meter measurements of mature fruits of the
parental inbred lines, F1 and the bulks. Dulce, Tam-Dew and F1 columns
represent the average of six fruits. The bulks mature fruit are the same
measurements as in C. E. Total soluble solids (TSS) values in the fruit flesh
measured by optical refractometer at three developmental stages. The
TSS values of ‘green’ and ‘orange’ bulks at the mature stage are statistically
different (P < 0.05). F. One-way analysis of TSS variance by bulk colors.
Tukey-Kremer HSD test was measure with Jump-8 software (SAS Institute,
Inc., NC). G. Mature fruit TSS of the inbred parental lines. Differences
are statistically significant (P < 0.05). Fruits are as in B. Figure S2.
intermediate metabolites. Two dimensional HPLC chromatograms of
orange and green mature bulks fruit (for more information see Fig. 3e
legend). Measuring absorbances at 290 nm and at 400 nm enabled
visualizing the peaks of phytoene and ζ-carotene respectively, in the
orange but not in the ‘green’ bulk. Figure S3. Heat map presentation and
correlation analysis of qRT-PCR verification of DEGs in bulks and in parental
lines: A. Each row in the map represents one DEG (from left to right):
ID names (); RNA-seq based log ratio of
digital expression (colored scale bar on top of the map) during fruit
development; log ratio of relative expression based on qRT-PCR analysis of
bulks and parental lines cDNA at one developmental stage outlined in the
RNA-seq column section. B. Correlation analysis between digital and relative
genes expression: X axis is qRT-PCR based log ratio of relative expression.
Y axis is RNA-seq based log ratio of digital expression. Correlation coefficient
(r) was 0.943 showing high and statistically significant correlation
(P < 0.00001). Figure S4. ABA-2 gene expression in ‘green’ and ‘orange’
bulks during fruit development. Each bar is the average RPKM of
three biological repeats. Each biological repeat includes 25 bulked
fruits, one from each F3 family, at four developmental stages presented on
the x axis. Error bars represent the standard error of the mean. Figure S5.
MEP pathway genes expression at different fruit development stages. Each
bar is the average RPKM of three biological repeats. Each biological repeat
includes 25 bulked fruits, one from each F3 family, at four developmental
stages presented on the x axis. Error bars represent the standard error of the
mean. Genes are: deoxy-d-xylulose 5-phosphate (DXP) synthase (DXS), DXP
reductase (DXR) and Geranylgeranyl pyrophosphate synthase (GGPPS). ID
names from (). (DOCX 1141 kb)
Additional file 2: Table S1. List of primers. (XLSX 12 kb)
Additional file 3: Table S2. SNP differentiating between bulks. *:
same base as reference genome; SNP type: M, mismatch; I, insertion; D,
deletion; AA change: SNP causes amino acid changes; for example,
R108H means that SNP at CDS position 108 causes amino acid changes
from R to H (“R” in green bulk to “H” in orange bulk). (XLSX 16 kb)
Page 16 of 18
Additional file 4: Table S3. List of genes included in the significant
SNP area. (XLSX 19 kb)
Additional file 5: Table S4. List of 79, 805, 37 and 122 genes that were
differentially expressed at 10, 20, 30 DAA, and the mature stage,
respectively. (XLSX 162 kb)
Additional file 6: Table S5. List of genes exhibited significant up or
down regulation in two fruit developmental stages. (XLSX 10 kb)
Additional file 7: Table S6. DEGs at different fruit developmental
stages categorized into functional groups using MapMan. (XLSX 4378 kb)
Additional file 8: Table S7. RNA-sequencing statsitics. (XLSX 16 kb)
Abbreviations
‘Dul’: Dulce; ‘Tad’: Tam-Dew; ABA: Abscisic acid; BSA: Bulk segregant analysis;
BSR-Seq: Bulk segregant RNA-Seq; CRTISO: Carotenoid isomerase; DAA: Days
after anthesis; DEG: Differentially expressed gene; ɛ-LCY: Lycopene ɛ-cyclase;
FW: Fresh weight; GGPP: Geranylgeranyl diphosphate; GGR: Geranylgeranyl
reductase; MEP: C-methyl-D-erythritol 4-phosphate; PDS: Phytoene
desaturase; PSY: Phytoene synthase; RPKM: Reads per kilobase, per million
sequenced reads; ZDS: ζ-carotene desaturase; Z-ISO: ζ-carotene isomerase;
β-LCY: Lycopene β-cyclase; β-OHase: β-carotene hydroxylase.
Competing interest
The authors have declared that no competing interests exist.
Authors’ contributions
NC carried out the field experiment including phenotyping, genotyping,
sampling and bulking the plant material and also carried out the molecular
genetics and biochemical experiments, analyzed the results and drafted the
article; HY carried out the RNA sequencing and helped in results analysis; SO
participated in genotyping by CAPS molecular markers; AM carried out the
HPLC carotenoid analysis; YY carried out the sugars extractions and analysis;
VP, EL, NK, and AAS participated in the study design and critically reviewed
the manuscript; YZ and ZF carried out the bioinformatics analysis; SG participated
in the study design and coordination; JB and LL participated in the study design
and coordination and helped to draft the manuscript; YT conceived of the study,
participated in the study design and coordination, and helped to draft
the manuscript. All authors read and approved the final manuscript.
Acknowledgment
We gratefully acknowledge partial support from BARD US-4423-11 and
from the ‘Center for the Improvement of Cucurbit Fruit Quality’, ARO, Israel.
Publication No. 110/2015 of the Agricultural Research Organization, Bet Dagan,
Israel. The authors greatly appreciate the technical assistance of Fabian
Boumkoler, Uzi Sa’ar and Yunnis Ca’abeeya, for field and sampling assistance.
Author details
1
Plant Science Institute, Agricultural Research Organization, Newe Ya’ar
Research Center, P.O. Box 1021, Ramat Yishay 30095, Israel. 2Faculty of
Biology, Technion – Israel Institute of Technology, Haifa 32000, Israel. 3Plant
Breeding and Genetics Section, School of Integrative Plant Science, Cornell
University, Ithaca, NY 14853, USA. 4Boyce Thompson Institute for Plant
Research, Cornell University, Ithaca, NY 14853, USA. 5Plant Science Institute,
Agricultural Research Organization, The Volcani Center, P.O.B. 6, Bet-Dagan
50250, ISRAEL. 6US Department of Agriculture–Agricultural Research Service,
Robert W Holly Center for Agriculture and Health, Cornell University, Ithaca,
NY 14853, USA.
Received: 14 June 2015 Accepted: 3 November 2015
References
1. Nisar N, Li L, Lu S, Khin NC, Pogson BJ. Carotenoid metabolism in plants.
Mol Plant. 2015;8:68–82.
2. Fraser PD, Bramley PM. The biosynthesis and nutritional uses of carotenoids.
Prog Lipid Res. 2004;43:228–65.
3. Krinsky NI, Landrum JT, Bone RA. Biologic mechanisms of the protective role
of lutein and zeaxanthin in the eye. Annu Rev Nutr. 2003;23:171–201.
Chayut et al. BMC Plant Biology (2015) 15:274
4.
5.
6.
7.
8.
9.
10.
11.
12.
13.
14.
15.
16.
17.
18.
19.
20.
21.
22.
23.
24.
25.
26.
Palace VP, Khaper N, Qin Q, Singal PK. Antioxidant potentials of vitamin A
and carotenoids and their relevance to heart disease. Free Radic Biol Med.
1999;26:746–61.
Simkin AJ, Schwartz SH, Auldridge M, Taylor MG, Klee HJ. The tomato
carotenoid cleavage dioxygenase 1 genes contribute to the formation of
the flavor volatiles beta-ionone, pseudoionone, and geranylacetone. Plant J.
2004;40:882–92.
Walter MH, Floss DS, Strack D. Apocarotenoids: hormones, mycorrhizal
metabolites and aroma volatiles. Planta. 2010;232:1–17.
Ibdah M, Azulay Y, Portnoy V, Wasserman B, Bar E, Meir A, et al. Functional
characterization of CmCCD1, a carotenoid cleavage dioxygenase from
melon. Phytochemistry. 2006;67:1579–89.
Goff SA, Klee HJ. Plant volatile compounds: sensory cues for health and
nutritional value? Science. 2006;311:815–9.
Borovsky Y, Tadmor Y, Bar E, Meir A, Lewinsohn E, Paran I. Induced mutation
in β-CAROTENE HYDROXYLASE results in accumulation of β-carotene and
conversion of red to orange color in pepper fruit. Theor Appl Genet.
2013;126:557–65.
Lewinsohn E, Sitrit Y, Bar E, Azulay Y, Meir A, Zamir D, et al. Carotenoid
pigmentation affects the volatile composition of tomato and watermelon
fruits, as revealed by comparative genetic analyses. J Agric Food Chem.
2005;53:3142–8.
Nuñez-Palenius HG, Gomez-Lim M, Ochoa-Alejo N, Grumet R, Lester G,
Cantliffe DJ. Melon fruits: genetic diversity, physiology, and biotechnology
features. Crit Rev Biotechnol. 2008;28:13–55.
FAO of the UN. Food and agriculture organization of the united nations.
Statistics Division. Accessed 10 APR 2015
Garcia-Mas J, Benjak A, Sanseverino W, Bourgeois M, Mir G, González VM, et
al. The genome of melon (Cucumis melo L.). Proc Natl Acad Sci U S A.
2012;109:11872–7.
Cuevas HE, Staub JE, Simon PW, Zalapa JE. A consensus linkage map
identifies genomic regions controlling fruit maturity and beta-caroteneassociated flesh color in melon (Cucumis melo L.). Theor Appl Genet.
2009;119:741–56.
Tzuri G, Zhou X, Chayut N, Yuan H, Portnoy V, Meir A, et al. A “golden” SNP in
CmOr governs fruit flesh color of melon (Cucumis melo). Plant J. 2015;82:267–79.
Li L, Yuan H. Chromoplast biogenesis and carotenoid accumulation.
Arch Biochem Biophys. 2013;539:102–9.
Lu S, Van EJ, Zhou XJ, Lopez AB, O’Halloran DM, Cosman KM, et al. The
cauliflower or gene encodes a DnaJ cysteine-rich domain-containing
protein that mediates high levels of b-carotene accumulation. Plant Cell.
2006;18:3594–605.
Michelmore RW, Paran I, Kesseli RV. Identification of markers linked to
disease-resistance genes by bulked segregant analysis: a rapid method to
detect markers in specific genomic regions by using segregating
populations. Proc Natl Acad Sci. 1991;88:9828–32.
Liu S, Yeh C-T, Tang HM, Nettleton D, Schnable PS. Gene mapping via
bulked segregant RNA-Seq (BSR-Seq). PLoS One. 2012;7:e36406.
Li L, Li D, Liu S, Ma X, Dietrich CR, Hu H-C, et al. The maize glossy13 gene,
cloned via BSR-Seq and Seq-walking encodes a putative ABC transporter
required for the normal accumulation of epicuticular waxes. PLoS One.
2013;8:e82333.
Pitrat M. 2006 gene list for melon. Cucurbit Genet Coop Rep. 2006;28:142–63.
Pike S, Gao F, Kim MJ, Kim SH, Schachtman DP, Gassmann W. Members
of the NPF3 transporter subfamily encode pathogen-inducible nitrate/
nitrite transporters in grapevine and Arabidopsis. Plant Cell Physiol.
2014;55:162–70.
Thimm O, Bläsing O, Gibon Y, Nagel A, Meyer S, Krüger P, et al. Mapman: a
user-driven tool to display genomics data sets onto diagrams of metabolic
pathways and other biological processes. Plant J. 2004;37(6):914–39.
Sharoni AM, Nuruzzaman M, Satoh K, Shimizu T, Kondoh H, Sasaya T, et
al. Gene structures, classification and expression models of the
AP2/EREBP transcription factor family in rice. Plant Cell Physiol.
2011;52:344–60.
Men X, Sun T, Dong K, Yang Y. Or mutation leads to photo-oxidative stress
responses in cauliflower (Brassica oleracea) seedlings during de-etiolation.
J Plant Res. 2013;126:823–32.
Goo Y-M, Han E-H, Jeong JC, Kwak S-S, Yu J, Kim Y-H, et al. Overexpression
of the sweet potato IbOr gene results in the increased accumulation of
carotenoid and confers tolerance to environmental stresses in transgenic
potato. C R Biol. 2015;338:12–20.
Page 17 of 18
27. Seo M. Complex regulation of ABA biosynthesis in plants. Trends Plant Sci.
2002;7:41–8.
28. Zhu J-K. Salt and drought stress signal transduction in plants. Annu Rev Plant
Biol. 2002;53:247–73.
29. Cazzonelli CI, Pogson BJ. Source to sink: regulation of carotenoid biosynthesis
in plants. Trends Plant Sci. 2010;15:266–74.
30. Joung J-G, Corbett AM, Fellman SM, Tieman DM, Klee HJ, Giovannoni JJ, et
al. Plant MetGenMAP: an integrative analysis system for plant systems
biology. Plant Physiol. 2009;151:1758–68.
31. Dai N, Cohen S, Portnoy V, Tzuri G, Harel-Beja R, Pompan-Lotan M, et
al. Metabolism of soluble sugars in developing melon fruit: a global
transcriptional view of the metabolic transition to sucrose accumulation.
Plant Mol Biol. 2011;76:1–18.
32. Burger Y, Schaffer AA. The contribution of sucrose metabolism enzymes
to sucrose accumulation in Cucumis melo. J Amer Soc Hort Sci.
2007;132:704–12.
33. Schaffer AA, Aloni B, Fogelman E. Sucrose metabolism and accumulation in
developing fruit of Cucumis melo. Phytochemistry. 1987;26:1883–7.
34. Harel-Beja R, Tzuri G, Portnoy V, Lotan-Pompan M, Lev S, Cohen S, et al. A
genetic map of melon highly enriched with fruit quality QTLs and EST
markers, including sugar and carotenoid metabolism genes. Theor Appl
Genet. 2010;121:511–33.
35. Burger Y, Sa’ar U, Distelfeld A, Katzir N, Yeselson Y, Shen S, et al.
Development of sweet melon (Cucumis melo) Genotypes combining
high sucrose and organic acid content. J Amer Soc Hort Sci.
2003;128(4):537–40.
36. Burger Y, Sa’ar U, Paris HS, Lewinsohn E, Katzir N, Tadmor Y, et al. Genetic
variability for valuable fruit quality traits in Cucumis melo. Israel J of Plant
Sci. 2006;54:233–42.
37. Crisp P, Walkey DGA, Bellman E. Roberts. A mutation affecting curd
colour in cauliflower (Brassica oleracea L. var. botrytis DC). Euphytica.
1975;24:173–6.
38. Zhou X, Welsch R, Yang Y, Álvarez D, Riediger M, Yuan H, et al. Arabidopsis
OR proteins are the major posttranscriptional regulators of phytoene
synthase in controlling carotenoid biosynthesis. Proc Natl Acad Sci U S A.
2015;112:3558–63.
39. Li L, Lu S, Cosman KM, Earle ED, Garvin DF, O’Neill J. β-Carotene
accumulation induced by the cauliflower Or gene is not due to an
increased capacity of biosynthesis. Phytochemistry. 2006;67:1177–84.
40. Klee HJ, Giovannoni JJ. Genetics and control of tomato fruit ripening and
quality attributes. Annu Rev Genet. 2001;45:41–59.
41. Welsch R, Maass D, Voegel T, Dellapenna D, Beyer P. Transcription
factor RAP2.2 and its interacting partner SINAT2: stable elements in
the carotenogenesis of Arabidopsis leaves. Plant Physiol.
2007;145:1073–85.
42. Lee J, Joung J, McQuinn R. Combined transcriptome, genetic diversity and
metabolite profiling in tomato fruit reveals that the ethylene response
factor SlERF6 plays an important role in ripening and carotenoid
accumulation. Plant J. 2012;70:191–204.
43. Chung MY, Vrebalov J, Alba R, Lee J, McQuinn R, Chung JD, et al. A tomato
(Solanum lycopersicum) APETALA2/ERF gene, SlAP2a, is a negative regulator
of fruit ripening. Plant J. 2010;64:936–47.
44. Toledo-Ortiz G, Huq E, Rodríguez-Concepción M. Direct regulation of phytoene
synthase gene expression and carotenoid biosynthesis by phytochromeinteracting factors. Proc Natl Acad Sci U S A. 2010;107:11626–31.
45. Martel C, Vrebalov J, Tafelmeyer P, Giovannoni JJ. The tomato MADS-box
transcription factor RIPENING INHIBITOR interacts with promoters involved
in numerous ripening processes in a COLORLESS NONRIPENING-dependent
manner. Plant Physiol. 2011;157:1568–79.
46. Bouvier F, Isner J-C, Dogbo O, Camara B. Oxidative tailoring of
carotenoids: a prospect towards novel functions in plants. Trends
Plant Sci. 2005;10:187–94.
47. Van Ha C, Leyva-González MA, Osakabe Y, Tran UT, Nishiyama R, Watanabe
Y, et al. Positive regulatory role of strigolactone in plant responses to
drought and salt stress. Proc Natl Acad Sci U S A. 2014;111:851–6.
48. Zhang A, Jiang M, Zhang J, Tan M, Hu X. Mitogen-activated protein kinase
is involved in abscisic acid-induced antioxidant defense and acts
downstream of reactive oxygen species production in leaves of maize
plants. Plant Physiol. 2006;141:475–87.
49. Kobe B. The leucine-rich repeat as a protein recognition motif. Curr Opin
Struct Biol. 2001;11:725–32.
Chayut et al. BMC Plant Biology (2015) 15:274
50. Fu X, Kong W, Peng G, Zhou J, Azam M, Xu C, et al. Plastid structure and
carotenogenic gene expression in red- and white-fleshed loquat
(Eriobotrya japonica) fruits. J Exp Bot. 2012;63:341–54.
51. Moehs CP, Tian L, Osteryoung KW, Dellapenna D. Analysis of carotenoid
biosynthetic gene expression during marigold petal development.
Plant Mol Biol. 2001;45:281–93.
52. Fray RG, Grierson D. Identification and genetic analysis of normal and
mutant phytoene synthase genes of tomato by sequencing,
complementation and co-suppression. Plant Mol Biol. 1993;22:589–602.
53. Brandi F, Bar E, Mourgues F, Horváth G, Turcsi E, Giuliano G, et al. Study of
“Redhaven” peach and its white-fleshed mutant suggests a key role of
CCD4 carotenoid dioxygenase in carotenoid and norisoprenoid volatile
metabolism. BMC Plant Biol. 2011;11:24.
54. Li L, Van Eck J. Metabolic engineering of carotenoid accumulation by
creating a metabolic sink. Transgenic Res. 2007;16:581–5.
55. Li L, Paolillo DJ, Parthasarathy MV, Dimuzio EM, Garvin DF, Plant US, et al.
A novel gene mutation that confers abnormal patterns of b-carotene
accumulation in cauliflower (Brassica oleracea var. botrytis). Plant J.
2001;26:59–67.
56. Lopez AB, Van Eck J, Conlin BJ, Paolillo DJ, O’Neill J, Li L. Effect of the
cauliflower or transgene on carotenoid accumulation and chromoplast
formation in transgenic potato tubers. J Exp Bot. 2008;59:213–23.
57. Freilich S, Lev S, Gonda I, Reuveni E, Portnoy V, Oren E, et al. Systems
approach for exploring the intricate associations between sweetness, color
and aroma in melon fruits. BMC Plant Biol. 2015;15:71.
58. Télef N, Stammitti-Bert L, Mortain-Bertrand A, Maucourt M, Carde JP, Rolin D,
et al. Sucrose deficiency delays lycopene accumulation in tomato fruit
pericarp discs. Plant Mol Biol. 2006;62:453–69.
59. Huff A. Sugar regulation of plastid interconversions in epicarp of citrus fruit.
Plant Physiol. 1984;76:307–12.
60. Decourcelle M, Perez-Fons L, Baulande S, Steiger S, Couvelard L, Hem S, et al.
Combined transcript, proteome, and metabolite analysis of transgenic maize
seeds engineered for enhanced carotenoid synthesis reveals pleotropic effects
in core metabolism. J Exp Bot. 2015; doi:10.1093/jxb/erv120
61. Portnoy V, Benyamini Y, Bar E, Harel-Beja R, Gepstein S, Giovannoni JJ, et al.
The molecular and biochemical basis for varietal variation in sesquiterpene
content in melon (Cucumis melo L.) rinds. Plant Mol Biol. 2008;66:647–61.
62. Zhong S, Joung J-G, Zheng Y, Chen Y, Liu B, Shao Y, et al. High-throughput
illumina strand-specific RNA sequencing library preparation. Cold Spring
Harb Protoc. 2011;2011:940–9.
63. Quast C, Pruesse E, Yilmaz P, Gerken J, Schweer T, Yarza P, et al. The SILVA
ribosomal RNA gene database project: improved data processing and
web-based tools. Nucleic Acids Res. 2013;41:590–6.
64. Langmead B, Trapnell C, Pop M, Salzberg S. Ultrafast and memory-efficient
alignment of short DNA sequences to the human genome. Genome Biol.
2009;10:25.
65. Trapnell C, Pachter L, Salzberg S. TopHat: discovering splice junctions with
RNA-Seq. Bioinformatics. 2009;25:1105–11.
66. Robinson MD, McCarthy DJ, Smyth GK. edgeR: a Bioconductor package for
differential expression analysis of digital gene expression data. Bioinformatics.
2010;26(1):139–40.
67. Li H, Durbin R. Fast and accurate short read alignment with Burrows–Wheeler
transform. Bioinformatics. 2009;25:1754–60.
68. Li H, Handsaker B, Wysoker A, Fennell T. The sequence alignment/map
format and SAMtools. Bioinformatics. 2009;25:2078–9.
69. Pfaffl MW. A new mathematical model for relative quantification in real-time
RT-PCR. Nucleic Acids Res. 2001;29:e45.
70. Tadmor Y, King S, Levi A, Davis A, Meir A, Wasserman B, et al. Comparative
fruit colouration in watermelon and tomato. Food Res Int. 2005;38:837–41.
71. Tadmor Y, Larkov O, Meir A, Minkoff M, Lastochkin E, Edelstein M, et al.
Reversed-phase high performance liquid chromatographic determination of
vitamin E components in maize kernels. Phytochem Anal. 2000;11:370–4.
72. Lichtenthaler H. Chlorophylls and carotenoids: Pigments of photosynthetic
biomembranes. Methods Enzymol. 1987;148:350–82.
73. Petreikov M, Shen S, Yeselson Y, Levin I, Bar M, Schaffer AA. Temporally
extended gene expression of the ADP-Glc pyrophosphorylase large subunit
(AgpL1) leads to increased enzyme activity in developing tomato fruit.
Planta. 2006;224:1465–79.
Page 18 of 18
Submit your next manuscript to BioMed Central
and take full advantage of:
• Convenient online submission
• Thorough peer review
• No space constraints or color figure charges
• Immediate publication on acceptance
• Inclusion in PubMed, CAS, Scopus and Google Scholar
• Research which is freely available for redistribution
Submit your manuscript at
www.biomedcentral.com/submit