Metabolomics of dates (Phoenix dactylifera) reveals a highly dynamic ripening process accounting for major variation in fruit composition
Bạn đang xem bản rút gọn của tài liệu. Xem và tải ngay bản đầy đủ của tài liệu tại đây (3.46 MB, 22 trang )
Diboun et al. BMC Plant Biology (2015) 15:291
DOI 10.1186/s12870-015-0672-5
RESEARCH ARTICLE
Open Access
Metabolomics of dates (Phoenix dactylifera)
reveals a highly dynamic ripening process
accounting for major variation in fruit
composition
Ilhame Diboun1*, Sweety Mathew1, Maryam Al-Rayyashi2, Mohamed Elrayess3, Maria Torres2, Anna Halama1,
Michaël Méret5, Robert P. Mohney6, Edward D. Karoly6, Joel Malek2,4 and Karsten Suhre1
Abstract
Background: Dates are tropical fruits with appreciable nutritional value. Previous attempts at global metabolic
characterization of the date metabolome were constrained by small sample size and limited geographical sampling.
In this study, two independent large cohorts of mature dates exhibiting substantial diversity in origin, varieties and
fruit processing conditions were measured by metabolomics techniques in order to identify major determinants of
the fruit metabolome.
Results: Multivariate analysis revealed a first principal component (PC1) significantly associated with the dates’
countries of production. The availability of a smaller dataset featuring immature dates from different development
stages served to build a model of the ripening process in dates, which helped reveal a strong ripening signature in
PC1. Analysis revealed enrichment in the dry type of dates amongst fruits with early ripening profiles at one end of
PC1 as oppose to an overrepresentation of the soft type of dates with late ripening profiles at the other end of
PC1. Dry dates are typical to the North African region whilst soft dates are more popular in the Gulf region, which
partly explains the observed association between PC1 and geography. Analysis of the loading values, expressing
metabolite correlation levels with PC1, revealed enrichment patterns of a comprehensive range of metabolite
classes along PC1. Three distinct metabolic phases corresponding to known stages of date ripening were observed:
An early phase enriched in regulatory hormones, amines and polyamines, energy production, tannins, sucrose and
anti-oxidant activity, a second phase with on-going phenylpropanoid secondary metabolism, gene expression and
phospholipid metabolism and a late phase with marked sugar dehydration activity and degradation reactions
leading to increased volatile synthesis.
Conclusions: These data indicate the importance of date ripening as a main driver of variation in the date
metabolome responsible for their diverse nutritional and economical values. The biochemistry of the ripening
process in dates is consistent with other fruits but natural dryness may prevent degenerative senescence in dates
following ripening. Based on the finding that mature dates present varying extents of ripening, our survey of the
date metabolome essentially revealed snapshots of interchanging metabolic states during ripening empowering an
in-depth characterization of underlying biology.
Keywords: Date fruit, Ripening, Metabolomics, Date palm, Soft dates varieties, Dry dates varieties, SIMCA, OPLS,
PCA, Multivariate
* Correspondence:
1
Department of Physiology and Biophysics, Weill Cornell Medical College,
Qatar Foundation – Education City, PO Box 24144, Doha, Qatar
Full list of author information is available at the end of the article
© 2015 Diboun et al. Open Access This article is distributed under the terms of the Creative Commons Attribution 4.0
International License ( which permits unrestricted use, distribution, and
reproduction in any medium, provided you give appropriate credit to the original author(s) and the source, provide a link to
the Creative Commons license, and indicate if changes were made. The Creative Commons Public Domain Dedication waiver
( applies to the data made available in this article, unless otherwise stated.
Diboun et al. BMC Plant Biology (2015) 15:291
Background
Date fruits from the date palm tree (Phoenix dactylifera)
constitute an iconic and economical asset in the Arab
world. Date palm cultivation plays an important role in
sustaining the ecological system in the region and is also
practiced in many other areas in the world notably
Southern Eastern Asia, Southern Europe, Latin America
and the USA. Unlike palm trees that can tolerate various
types of climates, the quality of the fruit is dependent on
the climatic and agricultural conditions [1]. Date composition varies amongst different varieties [2] and within
the same variety owing to pre and post-harvest conditions [3]. The ripening and maturation process, in particular, accounts for major variation in date composition
[4]. The development of the date fruit occurs in four
stages known by their Arabic names as Kimri, Khalal,
Rutab and Tamr [1, 5]. In the Kimri stage, the date fruit
has a hard green texture and shows a rapid gain in size
and moisture as well as elevated levels of acidic substances and astringent tannins [4]. Dates show the highest protein and free amino acid content at the Kimri
green stage, which continues to decrease throughout the
ripening process [6, 7]. A change in color from green to
yellow (or pink in some varieties) caused by the degradation of chlorophyll, marks the transition to the Khalal
stage that corresponds to the breaker stage in other
fruits including tomato and strawberry [8]. The Khalal
stage is also characterized by a steady loss of moisture
and a sudden rise in the level of non-reducing sugars,
mainly sucrose [9]. Softening of the fruit begins at this
stage and reaches its optimum level at the advanced
Rutab stage. The latter is characterized by increased
aroma [10] and fruit browning [4]. Rutab dates are sold
as fresh fruits and are perishable. Only after further loss
of moisture to less than 25 % and concurrent buildup of
reducing sugars at the Tamr stage does the fruit become
dry and storable [11]. The drying process can cause a reduction in the level of certain metabolites such as anthocyanins [11] and vitamin C [1] whilst promoting others
including reducing sugars [1], unsaturated fatty acids
[12] and Maillard substances [13].
Three main types of date fruits are known as soft,
semi-dry and dry. Soft dates present a moisture level as
high as 30 % at the end of the ripening process. They
are highly susceptible to pathogens and often fail to dry
on the trees. Sun drying of soft dates at the Rutab stage
is common; however, the delicacy of the fruit at this
stage with some cultivars may result in harvesting early
Khalal followed by artificial ripening [4]. Importantly,
soft dates maintain their soft texture after artificial drying. The semi-dry varieties of dates, of which Deglet
Noor is most famous, are more firm, present less moisture and tend to dry naturally [1]. The dry varieties
present even firmer texture, are most dry amongst all
Page 2 of 22
types featuring less than 20 % moisture content and can
be discolored [1]. The dry and semi-dry varieties are
sometimes rehydrated following harvest to meet quality
standards [4]. At the biochemical level, the semi-dry and
dry varieties are characterized by a higher ratio of sucrose to reducing sugars unlike the soft types which contain mostly reducing sugars [14]. Differences between
the soft, semi dry and dry types of dates extend beyond
composition, phenotype and post-harvest treatment to
climatic requirements. Dry dates require hot dry environment for optimal growth and maturation whereas soft
dates can tolerate some humidity and necessitate less
heat units [15, 16]. Genetic analysis of Tunisian cultivars
representative of the soft and dry types revealed a significant between-population genetic separation and a
significant association between type and genetic markers
[17, 18]. Importantly, date palms producing soft date
varieties show different tree phenotypes to those producing dry varieties [18, 19].
Metabolomics techniques have offered a promising approach for bridging the gap between genotype and phenotype [20] and have been successfully deployed to study
various aspects of fruit and seed biology [13, 21, 22]. Previous metabolomics measurements of dates were limited
by a small number of date varieties and confined geographical sampling [10, 12, 13]. In total, eight varieties of
dates, all local to Southern Tunisia, featuring three different development stages were measured by HPLC and GCMC techniques by El Arem and colleagues [10, 12]. The
measured volatile and non-volatile metabolites were found
to significantly vary between development stages and cultivars. More recently, Farag et al. used sugars and flavonols
to classify twenty one Egyptian date varieties into distinct
clusters, using a combined UPLC/GC-MS approach [13].
In this study, a comprehensive UPLC-MS and GC-MS
metabolomics measurement of two large cohorts of
mature date fruits exhibiting substantial variation in
origin, variety and post-harvest treatment was performed. The aim was to assess the factor(s) likely to
contribute to variation in the date metabolome; in
particular the development effect, which was modelled
from a separate dataset of immature dates. We predict that our findings are applicable to the larger date
population given the sample size and heterogeneity of
fruit conditions.
Methods
Collection and phenotypic characterization of date fruits
Mature fruits
In the present study, 109 unique date varieties (Phoenix
dactylifera) from 14 countries were collected in two separate occasions: A first collection took part in 2012 and
a second one in 2013. The term variety is used here to
describe a distinct phenotypic class of dates and if the
Diboun et al. BMC Plant Biology (2015) 15:291
same variety was collected from different countries, a
different sample ID was assigned to each collected sample per country. Photos of fruits from 14 date samples
collected each from a different country can be found in
Fig. 1a. With each date sample, a handful of fruits were
selected for pre-processing. Each fruit was weighed and
the average weight was recorded for each date sample.
Two fruits were halved to get a longitudinal and cross
sectional view of the pericarp and seed. An international
ColorChecker Color-Rendition Chart (ColorChecker
Page 3 of 22
Classic, X-Rite, USA) and a 20 cm ruler were positioned
along the fruits on a white background under artificial
light and a photograph was taken using a Canon Power
Shot S100 USA camera loaded on a pre-set tripod. An example photo can be found in Additional file 1: Figure S1.
RGB color values were extracted from all fruits showing
on a given photo using Matlab libraries and the results
were averaged for each color range separately. Readings
from color charts from all processed photos were used to
calibrate color measurement across the photos. Further
A
B
C
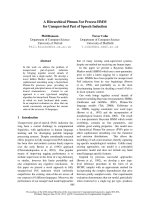
Fig. 1 Images of dates. a A subset of 14 mature dates representing the 14 countries sampled in this study and reflecting diversity in phenotype.
b Immature dates from two date samples 93-BSDN-MA and 91-BLZ-MA from the second sample collection. Each fruit is labeled with an ID featuring
a letter that indicates its rank by extent of ripening relative to the remaining fruits within the sample (refer to methods). c Summary of the date
metabolomics datasets measured by Metabolon: 10 fruits from the first sample collection were measured again with fruits from the second sample
collection to account for batch measurement effect. All fruits from the first collection were considered mature (shown in green) whilst some fruits
from the second sample collection displayed a phenotype indicative of ongoing ripening (refer to methods) and were therefore considered immature
(shown in yellow). DS1 has the suffix ‘-bolon’ attached to distinguish it from the MetaSysX measurement of the same fruits from the first sample
collection. The second sample collection was only measured by Metabolon
Diboun et al. BMC Plant Biology (2015) 15:291
phenotype characterization of the date samples consisted
of classification into soft, semi-dry and dry types by reference to the literature as well as moisture content measurement of one representative fruit per date sample. Moisture
measurement was performed for a random third of the
date samples and was based on calculating the percentage
of fruit weight-loss following a 116-h incubation in a
105 °C oven. A full listing of all varieties included in
this study together with information on their country
of production, collection point and type can be found
in Additional file 2. Summary statistics for each sample collection including the count of varieties, samples and the frequency of samples per country of
production are shown in Table 1-A. Overall, dates
from the first sample collection were mostly from the
Gulf region obtained in a fairly dried condition from
Page 4 of 22
shops and festivals whilst the second sample collection was dominated by North African dates obtained
mostly fresh from the palm trees. For the second collection of dates, field work permissions were obtained
verbally from owners of visited oases. The marketed
versus fresh nature of dates between the two sample
collections implies varying post-harvest conditions. All
collected dates with homogenous brown color were
further dried by exposing them to open air for two
weeks before further processing. In general, dates
were considered mature if the low moisture prevented
any further change in their appearance. Notably, maturity is attained naturally with the dry class of dates
but often artificially with the soft class of dates owing
to intrinsically higher moisture levels (refer to background for further details).
Table 1 Summary statistics from collected dates and their measured metabolomics data
A
B
A) Overview of the date cohorts from the first and second sample collection. Countries are denoted by their international ISO Alpha-2 code as follows: MA
(Morocco), DZ (Algeria), TN (Tunisia), LY (Libya), EG (Egypt), SD (Sudan), JO (Jordan), SA (Saudi Arabia), IQ (Iraq), IR (Iran), AE (United Arab Emirates), QA (Qatar),
PK (Pakistan), US (United States). Dates from the first sample collection contained largely mature dates. In contrast, 37 immature date fruits corresponding to 10
varieties were included in the second sample collection. B) Summary statistics of the metabolomics data measured from the first and second sample collection. To
account for batch effect, 10 samples from the first sample collection were measured again along dates from the second sample collection. Dates from the second
sample collection were only measured by Metabolon unlike dates from the first sample collection which were measured by MetaSysX and Metabolon. The median
RSD (RSD = sdandard deviation/mean) from biological replicates is a combination of technical and biological variation whilst that from technical replicates only
expresses technical variation
Diboun et al. BMC Plant Biology (2015) 15:291
Immature fruits
With the second sample collection, while harvesting ripened fruits from the palm trees, immature fruits still
undergoing ripening activity and occasionally late green
Kimri fruits from the pre-ripening stage were collected
when available. In total, 37 immature date fruits, corresponding to 10 date samples, were collected. With each
of the 10 samples, the immature fruits were ranked by
their extent of ripening based on visual assessment of
color change and skin wrinkling. Each fruit was given an
ID based on a combination of the sample number and a
letter reflecting the fruit rank within the sample. A full
listing of all immature fruit IDs and corresponding sample IDs is given in Table 2. Photos of immature fruits
from two date samples are shown in Fig. 1b.
Metabolite measurement of the date samples
Dates preprocessing and measurement protocols
The metabolic content of the date fruits from the second
sample collection was measured separately a year after
samples from the first collection were measured. The
first collection of dates was preprocessed by MetaSysX
GmbH. and measured by both MetaSysX GmbH. and
Metabolon Inc., USA. Dates from the second collection
were preprocessed and measured by Metabolon Inc.,
USA alone. The protocols for sample processing and
metabolomics measurement by both MetaSysX and
Metabolon are described in details in Additional file 3.
Briefly, with MetaSysX, 50 mg of the peel and flesh of
the date fruits were flash frozen in liquid nitrogen and
extracted according to standardized procedures [23].
The dried metabolite extracts were measured with a
Waters ACQUITY Reversed Phase Ultra Performance
Liquid Chromatography (RP-UPLC) coupled to a
Table 2 Listing of immature date fruits from the second sample
collection
Date sample number
Date sample ID
85
85-AZGHZ-MA
Immature fruit ID
85A,85B,85C
87
87-TZGRT-MA
87A,87B,87C
89
89-KLMR-MA
89A,89B,89C,89D,89E
90
90-MJL-MA
90A,90B,90C,90D
91
91-BLZT-MA
91A,91B,91C
92
92-SHTW-MA
92A,92B,92C,92D,92E,92 F
93
93-BSDN-MA
93A,93B,93C
97
97-THMT-MA
97A,97B,97C
99
99-MJN-MA
99A,99B,99C,99D
103
103- TZW-MA
103A,103B,103C
Overall, 37 immature fruits were collected from 10 date samples. Each fruit
was assigned an ID based on a combination of the date sample number and
a letter expressing the fruit’s extent of ripening, as judged by eye, relative
to the remaining fruits within the sample. It is important to note that these
letters are only meaningful within a sample and are not comparable
between samples
Page 5 of 22
Thermo-Fisher Exactive mass spectrometer which consists of an ElectroSpray Ionization source (ESI) and an
Orbitrap mass analyzer. C8 and C18 columns were used
for the lipophilic and the hydrophilic measurements,
respectively. Chromatograms were recorded in Full Scan
MS mode (Mass Range [100–1500]) [23]. Chromatograms from the UPLC-FT-MS runs were analyzed and
processed using the software REFINER MS® 7.5 (Genedata, Switzerland). The data were further filtered and analyzed using in-house software tools (refer to Additional
file 3). The samples were also measured using the Agilent Technologies GC coupled to a Leco Pegasus HT
mass spectrometer which consists of an EI ionization
source and a TOF mass analyzer. Column: 30 meters
DB35; Starting temp: 85 °C for 2 min; Gradient: 15 °C
per min up to 360 °C. NetCDF files exported from the
Leco Pegasus software were imported into “R”. The Bioconductor package TargetSearch was used to transform
retention time to retention index (RI), to align the chromatograms, to extract the peaks and to annotate them
by comparing the spectra and the RI to the GMD
[24, 25]. Obtained data from both platforms were normalized according to sample weight and to the measurement day to minimize process error over the course of
many days of measurement.
With Metabolon, date samples were prepared and extracted according to the standard solvent extraction
method by Metabolon Inc. [26]. The UPLC/MS/MS analysis was based on the Waters ACUITY ultra performance liquid chromatography (Waters Corporation, USA)
and the ThermoFischer Scientific Orbitrap Elite highresolution accurate mass spectrometer (Thermo Fischer
Scientific Inc., USA) equipped with a heated electrospray
ionization (HESI) source and an Orbitrap mass analyzer.
The dried sample extracts for the LC positive and LC
negative mode were reconstituted in acidic and basic
LC- compatible solvents. Two independent injections
were performed on each sample using separate dedicated columns. The mass spectra analysis alternated
between MS and data dependent MS2 scans using dynamic exclusion. With GC/MS, the samples were further dried under vacuum desiccation for an entire
day and derivatized under dried nitrogen using
bistrimethyl-silyl-trifluoroacetamide (BSTFA). The GS/
MS analysis was based on a Thermo Finnigan™
TRACE™ DSQ™ (ThermoFinnigan, USA) fast-scanning
single –quadrupole mass spectrophotometer using
electron impact ionization source. The GC column
was 5 % phenyl and the temperature ramp range was
from 40 to 300 °C in a time span of 16 min. The raw
data files from both platforms were extracted using
the in-house informatics system (refer to Additional
file 3). A reference library maintained by Metabolon
Inc. [27], consisting of chemical standards with
Diboun et al. BMC Plant Biology (2015) 15:291
retention time, retention index, mass to charge ratio
(m/z) and chromatographic data including MS/MS
spectral data was used to identify metabolites in experimental samples as detailed in [28]. In this study,
the samples were analyzed over a span of two or
three days, and therefore data normalization step was
performed to correct variation from instrument interday tuning differences.
Measurement experimental design
With the first collection of dates containing 62 date samples, the MetaSysX measurement was done in triplicates
yielding a total of 186 measured metabolic profiles
(Table 1-B). With Metabolon, 34 samples were measured
in duplicates whilst the 28 remaining as singletons,
amounting to 96 measured metabolic profiles (Table 1-B,
Fig. 1c). For the rest of this article, we will refer to the latter as ‘DS1-bolon’ whilst the former metabolomics dataset
will be referred to as ‘DS1-sysX’. Dates from the second
sample collection were measured by Metabolon only and
therefore the derived metabolomics data will be referred
to in short as ‘DS2’. DS1-bolon and DS2 metabolomics
data can be found in Additional file 4 & Additional file 5
respectively. The experimental design consisted of a
singleton measurement of each of the 51 mature date
samples (Table 1-B, Fig. 1c) and similarly the 37 immature
fruits were each measured once. To account for batch
measurement effect, 10 fruits from the first sample collection were measured again along the 88 fruits from the second collection, resulting in 98 measured metabolic
profiles (Table 1-B). We distinguish between metabolomics data from the 37 immature and 61 mature date samples (inclusive of the 10 samples from the first collection)
using the terms ‘DS2-immature’ and ‘DS2-mature’ respectively (Fig. 1c). The sample characteristics of DS1sysX, DS1-bolon and DS2 as discussed here are summarized in Table 1-B. Since Metabolon measured datasets
were extensively used in this paper, they are further illustrated in Fig. 1c.
Statistical analysis of metabolomics data
Data preprocessing and platform comparison
Metabolomics data, were log-transformed and scaled so
that the median measurement value from each measured
metabolic profile was equal to the overall median from
the whole dataset. This normalization was done separately for DS1-sysX, DS1-bolon and DS2. By default, biological replicates (when available) were not combined
and measurement from each replicate was treated as a
separate metabolic profile. However, with few analyses, a
single measurement from each date sample was required
and the replicates were averaged. This will be clearly indicated where applicable. Comparison of platforms was
based on average metabolite missingness level across
Page 6 of 22
samples and the median relative standard deviation
(RSD) across biological replicates. RSD was expressed as
metabolite-wise standard deviation from replicates divided by the mean. With Metabolon measurement of
samples from the first collection (or DS1-bolon), data
from technical replicates were available from repeated
measurement of a homogenous mixture of pooled samples (refer to Additional file 3). The median RSD from
these technical replicates was calculated for assessment
of data quality by Metabolon.
Non-supervised PCA analysis of mature dates and quality
control
The multivariate statistical analysis package SIMCA
v13.0.3 was used to perform PCA on DS1-bolon, DS1sysX and DS2-mature separately to characterize collective
metabolic variation underlying significant proportions of
the variance from the respective datasets. Simca default
metabolite missingness threshold of 50 % was used [29].
The significance of the extracted principal components
was derived from SIMCA via built-in cross validation
where for each component consecutively, parts of the data
are alternatingly kept out of the model then predicted
[29]. Based on the PC1/PC2 two dimensional space, date
samples 78-BZGZ-MA and 105-ZGHL-EG from DS2mature located outside the Hotelling’s 95 % confidence ellipse interval were considered outliers and excluded from
further analysis of the dataset [29].
SIMCA OPLS-DA and O2PLS-DA models of the dates
ripening process
Metabolic signature of date ripening was modeled from
analysis of the development stage dataset, or DS2immature, a subset of the second date sample collection
as follows: Initially, PCA analysis was run on measured
metabolomics data to confirm the within-sample ranking
of individual fruits previously set by visual assessment of
the fruits’ extent of ripening (refer to the previous section). The PCA analysis revealed clusters of fruits with
comparable ripening profiles across samples (more details in the results section). These clusters were used to
define development stage classes that served as a training set for an OPLS-DA classifier [29, 30]. Applying the
classifier on the rest of the samples in DS2 led to the
calculation of class prediction scores indicative of the
samples’ ripening metabolic states. For DS1-bolon, the
OPLS-DA model trained on DS2-immature data was not
suitable owing to likely differences between batch measurements. Also, unlike the second collection of dates,
no development stage dataset was included in the first
collection. Instead, we developed a strategy based on the
10 fruits from the first sample collection which were
measured again along the samples from the second collection. Because the samples in question were included
Diboun et al. BMC Plant Biology (2015) 15:291
in both batch measurements, they will be referred to as
batch 1&2 samples for the remaining parts of this article.
Our strategy for predicting the ripening states of dates
from the first sample collection is here described: First,
we used the OPLS-DA model previously trained on the
DS2-immature samples to predict the development classes of batch 1&2 samples based on their DS2 data from
the same batch measurement as the training set. This
class information was used to train an O2PLS-DA classifier on the same samples (batch 1&2 samples) based on
their batch 1 and 2 metabolomics measured data. The
O2PLS-DA procedure [29, 30] is able to identify metabolites consistently differentiating between the different
classes in the training set based on multiple measurements of the training set (here from different batch reading). The integrative nature of the O2PLS-DA model
meant that it could be used to calculate class prediction
scores for dates from the first and second sample collection. The scores from the first sample collection served
to indicate the ripening states of these date samples
whilst the scores from the second collection served to
optimize and validate the O2PLS-DA model by drawing
a comparison to the class prediction scores for the same
samples by the original OPLS-DA model (more details
in Additional file 1: Figure S2). The O2PLS-DA model
was only defined on Metabolon measured data.
Association analysis of PCs from mature dates with date
(soft/dry) type, country of production, ripening state and
color
The lm function from the statistical analysis R software
version 3.1.1 was used to run the regression model ‘PC
~ date_variable’ where date_variable consisted of one of
four variables: date_type, a categorical variable with two
levels: Soft and dry, with semi-dry varieties assigned to
the dry class (Additional file 2); date_country, an ordinal
variable from ranking the sampled countries West to
East; date_ripening_state corresponding to the class prediction scores calculated by the OPLS-DA and O2PLSDA models for samples from the first and the second
collection respectively and date_color, a continuous variable based on the average of the red/green/blue (RGB)
color measurements. The R package maps was used to
generate the geographical map in Fig. 2 depicting the
dates countries’ of production.
Analysis of the distribution of classes of metabolites on the
loading space underlying PCs from mature dates
In order to further characterize PC1, the distribution of
metabolites classified into broad metabolic categories including amino acid metabolism, sugar metabolism, energy metabolism, lipid metabolism, purine and
pyrimidine metabolism, secondary metabolism and vitamin metabolism was manually examined on the
Page 7 of 22
underlying loading value space. The latter refers to the
set of loading values assigned to the metabolites by PCA
analysis where each loading value expresses the correlation between the corresponding metabolite abundance
profile and the PC scores. Within a broad metabolic
class, sets of metabolites sharing a functional or structural feature and having comparable loading values were
identified. The common feature consisted mostly of
pathway co-membership, a common catalytic activity or
a unifying structural theme. These sets of metabolites
were mapped to subclasses within the original broad categories as follows:
Amino acid metabolism Refined into 1) subclass amino
acids that includes proteinogenic and non-proteinogenic
amino acids, 2) subclass primary amines deriving from
direct decarboxylation of amino acids, 3) subclass dipeptides from pairs of amino acid conjugates, 4) subclass
glutathione cycle and glutathione metabolism featuring
both oxidized and reduced forms of glutathione, metabolites analogous to glutathione and gamma-glutamyl
amino acid intermediates in the glutathione synthesis
and degradation pathway, 5) subclass N-acetylated
amino acids, 6) subclass polyamines and polyamine
degradation.
Sugar metabolism Refined into the following subclasses: 1) subclass non-reducing sugars featuring sucrose
and sucrose like sugars, 2) subclass reducing sugars and
derivative alcohols, lactones and acids, 3) subclass TCA
cycle encapsulating di and tri carboxylic acid intermediates, 4) subclass glycolysis capturing phosphorylated
sugars as well as key product pyruvate and derivative
lactate, 5) subclass sugar dehydration encompassing
products from dehydration of fructose and glucose.
Lipid metabolism Within which the following subclasses were recognized: 1) subclass lysophospholipids, 2)
subclass lysophospholipid degradation featuring free
head groups and remaining lysophosphatidic acids or alternatively phosphorylated head groups and remaining
monoacylglycerols in addition to N-acylethanolamine
derivatives of lysophospholipids [31], 3) subclass unsaturated fatty acid and oxylipins, 4) subclass sphingoid
bases.
Purine and pyrimidine metabolism Was split into two
subclasses spanning each a different range of loading
values: 1) subclass nucleic acid and tRNA nucleosides
encapsulating simple forms of nucleobases and DNA/
mRNA nucleosides as well as nucleosides carrying more
complex tRNA specific modifications. Products from nucleoside modifications known to occur in mature
eukaryotic rRNA [32] displayed a disparate range of
Diboun et al. BMC Plant Biology (2015) 15:291
Page 8 of 22
A
B
C
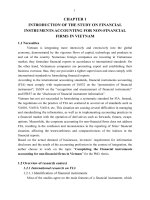
Fig. 2 PCA analysis of metabolomics data from mature dates. a PC1 scores from DS1-bolon and DS1-sysX are highly concordant. b & c PC1 scores
plotted against PC2 scores for DS1-bolon and DS2-mature respectively. The color of the circular symbols indicates the corresponding date sample
country of production and follows the country-color code on the geographical map shown on the top of the figure. The square symbols were
added to indicate the median PC1/PC2 coordinates per country and follow the same color code. Countries are denoted by their ISO Alpha-2
international code. The US unique date sample from the first collection has been omitted to keep the geographical map simple. PC1 scores
have been negated so that the order of the countries follows that on the map (West/East left/right respectively). With both datasets, a significant
association between PC1 scores and the country of production, expressed as an ordinal variable (refer to methods), was found. PC2 from both
datasets showed no significant association
loading values and were captured under 2) subclass
rRNA nucleosides.
Secondary metabolism Three clusters of metabolites
were observed on the loading space consisting of: 1) subclass tannins, 2) subclass general phenylpropanoid
pathway featuring a range of chalcone derivative flavonoids, excluding tannins, as well as precursor hydroxycinnamates and other derivatives, 3) subclass polymethoxycinnamates, hydroxybenzoates and volatiles
(VOCs) comprising di and tri-methoxycinnamates, hydroxybenzoates potential derivatives of methoxycinnamates
Diboun et al. BMC Plant Biology (2015) 15:291
[33] and volatiles deriving from both precursor and product molecules.
Vitamin metabolism, hormone metabolism and
energy metabolism These were small classes that did
not require further refinement.
Finally, a general category degradation activity and
amino acid volatiles (VOC) was formulated to capture
metabolites from degradation of purines, vitamins and
amino acids leading to synthesis of short chain volatiles
(VOCs) [8]. For the rest of the article, all afore mentioned subclasses of metabolites as well as unrefined categories vitamin metabolism, hormone metabolism,
energy metabolism and degradation activity and amino
acid VOC will be collectively referred to as ‘metabolite
classes’. It is important to note that the analysis was restricted to Metabolon measured data.
Results
Date fruit metabolomics datasets and platform
comparison
In this study, mature date fruits were collected in two
separate occasions from 14 different countries including:
Morocco, Algeria, Tunisia, Libya, Egypt, Sudan, Jordan,
Saudi Arabia, Iraq, Qatar, United Arab Emirates, Iran,
Pakistan and the United States. Unlike dates from the
second sample collection, date fruits from the first sample collection were measured by both MetaSysX and
Metabolon, which led to two metabolomics datasets
DS1-sysX and DS1-bolon, respectively. Overall, MetaSysX showed a relatively higher median RSD (refer to
methods for details on RSD calculation) over biological
replicates: 0.35 as opposed to 0.26 from Metabolon
(Table 1-B). A parallel analysis based on calculating the
average Euclidean distances ‘AVED’ between all metabolite measurements in a given sample ‘s’ and their corresponding counterparts in every other sample in the
dataset revealed that the AVED between s and its biological duplicate has often the lowest value with both
datasets (Additional file 1: Figure S3). This implies that
even though the MetaSysX measurement was slightly
noisier than the Metabolon measurement, as revealed by
the RSD values from above, with both platforms variation between the date samples was still higher than the
intrinsic variation between individual fruits from the
same sample. The median RSD from technical replicate
measurements of pooled batch 1 samples by Metabolon
was as low as 0.12 (Table 1-B). Further to data reproducibility, it was noted that DS1-sysX is characterized by a
higher level of metabolite missingness across samples, in
particular with the lipid platform (Table 1-B). On the
other hand, DS1-sysX featured a much higher number
of detected signals in comparison to DS1-bolon (3143 as
opposed to 282, Table 1-B) since MetaSysX performed
Page 9 of 22
an untargeted peak extraction. Also, complex lipids
could only be obtained from MetaSysX measurement.
Comparison of Metabolon-measured data from dates
from the first and the second sample collection (DS1bolon and DS2) revealed a higher number of metabolites
detected in the latter than the former dataset (Table 1-B).
This could be primarily caused by the fact that the first
sample set was initially processed by MetaSysX whereas
the second sample set was processed solely by Metabolon and was matched against an updated library (refer
to Additional file 3). Also the inclusion of dates from
pre-ripening stages in the second set could have led to
the detection of new metabolites. A range of secondary
metabolites was detected in both datasets, in particular
members of the general phenylpropanoid pathway including flavonoid species tannins, flavones, flavanonols,
flavonols, flavanones, glycosylated flavanones and glycosylated flavonols as well as hydroxycinnamates,
methoxycinnamates, lignans, monolignols and stilbenes
(Table 3); though, the vast majority of detected metabolites were primary metabolites. These ranged from
amino acids, lipids, sugars, vitamins, alcohols, acids,
amines, purines and pyrimidines and will be covered in
more details in the discussion section. The number of
metabolites exclusive to DS1-bolon is 53 whilst 173
metabolites were only detected in DS2; 229 metabolites
were measured in both datasets making the total number of unique metabolites detected over both datasets
by Metabolon equal to 455.
PCA analysis of metabolomics data from mature dates
reveals a first principal component associated with the
geography of the region
In order to study the intrinsic variation in the composition of collected mature dates, PCA analysis was performed on measured metabolomics data using SIMCA
(for details on QC preprocessing, the reader is referred
to the methods section). With DS1-bolon, the top four
components were found to be significant and together
accounted for 41.1 % of the total variation in the dataset
(PC1 accounted alone for 17.7 % followed by PC2 9.7 %,
PC3 7.8 % and PC4 5.7 %). To validate these results,
PCA was performed separately on the DS1-sysX metabolomics data measured from the same date samples.
PC1 scores from DS1-bolon and DS1-sysX were highly
correlated (abs Pearson R = 0.90, pvalue < 2.2e-16,
Fig. 2a), confirming that the effect from PC1 is platform
independent. Regressing PC1 scores from DS1-bolon
against the date_country variable (defined in the
methods section) revealed a significant pvalue = 4.80e-08
and an adjusted R-squared of 0.34. There was no significant association between the date_country variable and
PC2, 3 and 4 from DS1-bolon.
Diboun et al. BMC Plant Biology (2015) 15:291
Page 10 of 22
Table 3 Count of different species of secondary metabolites in
DS1-bolon and DS2
Secondary metabolite class
DS1-bolon
DS2
Fatty acid esters
1
1
Branched-chain amino acid volatiles
11
10
Flavonoids
Other phenyl propanoids
Secondary metabolite
subclass
Flavan-3-ols
1
1
Flavanones
1
1
Flavanonals
1
0
Flavones
2
2
Flavonols
1
1
Glycosylated flavanones
1
1
Glycosylated flavones
2
2
Glycosylated flavonols
4
4
Proanthocyanidins
1
2
Cinnamic acids
8
8
Lignans
1
2
Monolignols
2
2
Stilbenes
Other benzenoids
1
0
7
7
Terpenoids
2
6
Total
49
50
In turn, PCA analysis of DS2-mature revealed 4 significant components accounting for 44.2 % of the total
variation where 16.7 % was captured by PC1 alone and
11.4 %, 10 % and 6.06 % by PC2, PC3 and PC4 respectively. Similar to DS1-bolon, scores from PC1 alone were
significantly associated with the ordinal date_country
variable (pvalue = 3.14e-05, adjusted R-squared = 0.45).
Taken together, these results suggest that PC1, explaining the largest systematic variation in mature dates from
the first and second sample collection, is significantly
associated with the fruit’s country of production. An increased density of the North African dates over the positive range of the PC1 scale opposed by an enrichment of
the Gulf dates at the negative range can be observed
with DS1-bolon and DS2-mature metabolomics datasets
on Fig. 2b & c respectively.
PC1 from mature dates captures varying extents of fruit
ripening
The inclusion of a subset of date fruits with on-going
ripening activity in the second sample collection (also
referred to as DS2-immature, Fig. 1b & c) was aimed at
identifying the metabolic signature of the ripening
process. The objective was to assess possible contribution of the development effect to observed variance in
DS1-bolon and DS2-mature as although the corresponding date samples were considered mature, fruits still
undergoing ripening changes may have been incidentally
present. An overview of the analysis used to assess this
possible effect can be found in the methods section;
here, we present the results. PCA analysis of the immature fruits revealed a high concordance between PC1
scores and fruit ranking previously defined based on visual assessment of the fruits’ ripening extent (refer to
methods) (Fig. 3a). Occasional discrepancies were observed only when the fruits featured similar PC1 score
values, which would suggest comparable ripening states.
A density analysis of PC1 scores revealed three broad
clusters of samples which were denoted by class 1, 2 and
3 by increasing extent of ripening (Fig. 3a). An OPLSDA model trained on class 2 versus 3 revealed one
significant predictive component explaining 87 % of the
variation in the class variable (R-squared-Y = 0.87, Qsquared = 0.69). This classifier essentially learns the
metabolites best differentiating between the classes. Applying this classifier to all samples in DS2 excluding the
training set led to class prediction scores that reflect the
original levels of such differentiating metabolites in these
samples. It follows that these scores are indicative of the
extent of ripening in these samples. Examination of
these prediction scores revealed two main observations:
First, DS2-immature samples from class 1 were laid correctly closest to class 2 and furthest from class 3; second,
DS2-mature date samples were positioned expectedly in
between class 2 and 3 (Fig. 3b). A significant Pearson R
value (R = 0.80, pvalue = 4.48e-14) was obtained from
comparison of the OPLS-DA class prediction scores and
their PC1 counterparts from DS2-mature samples
(Fig. 3c). This implies that further to the geography
effect, PC1 from DS2-mature also carries a ripening
signature. No significant association was found with
PC2, 3 and 4.
The procedure for mapping the ripening effect onto
DS1-bolon was outlined in the methods section. Briefly,
it followed from examination of the class prediction
scores by the OPLS-DA classifier (Fig. 3b) that the 10
samples measured in both batch measurements (or
batch 1&2 samples) are spread over class 2 and 3 (the
word batch here referring to a sample collection set).
These samples served to construct seed classes 2 and 3
for a new classifier. The latter was based on the O2PLSDA procedure which is able to dissect the common signal from multiple measurements of the same samples
that consistently distinguishes between the samples’ classes. In this work, the multiple measurements of the
training set samples consisted of their batch1 and 2
metabolomics measurements. The class segregation of
this training set was guided by the results on Fig. 3b and
tuned to maximize the concordance level between derived class prediction scores for a subset of batch 2 samples and their counterparts by the OPLS-DA classifier
(more details in the methods and Additional file 1:
Figure S2). The O2PLS-DA model with the best
Diboun et al. BMC Plant Biology (2015) 15:291
A
Page 11 of 22
C
B
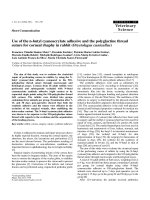
Fig. 3 PC1 from DS2-mature is associated with the ripening process. a PC1 scores from DS2-immature. Fruits from varying stages of ripening from
the same sample are shown on the same line. Each fruit is labelled with an identifier featuring a letter indicative of its extent of ripening relative
to the other fruits within the sample as judged by eye. The ordering of the letters is well captured by the PC1 scores and occasional discrepancies
occur when the fruits featured very similar PC1 scores. Density analysis of the PC1 scores, showing on top of (a) indicates that the fruits can be
assigned to three developmental classes, denoted as class 1 (light green), class 2 (light pink) and class 3 (light blue) by increasing ripening maturity.
b An OPLS-DA classifier trained on class 2 versus 3 was used to calculate class prediction scores for all DS2 samples including the batch1&2 samples
which were measured in separate batches once with dates from the first sample collection and again with dates from the second sample collection.
c A scatter plot of PC1 scores and OPLS-DA class prediction scores from the DS2-mature samples indicates a significant correlation
Diboun et al. BMC Plant Biology (2015) 15:291
concordance level was found to consist of batch 1&2
samples 61, 30, 60, 27, 10/24, 50, 22, 44 affiliated to seed
class 2/seed class 3 respectively whilst leaving out sample 11 (Additional file 1: Figure S2). The O2PLS-DA
class prediction scores for DS1-bolon were found to correlate strongly with their PC1 score counterparts (abs
Pearson R = 0.8, pvalue < 2.2e-16, Fig. 4a). This implies
that PC1 from the first collection of dates is also associated with a ripening effect further to the geography of
the region, in a similar way to PC1 from the second collection samples. No significant association was found
with PC2, 3 and 4 from the same dataset.
Importantly, the O2PLS-DA class prediction scores for
the first and second collection of date samples are comparable and can be projected along the same axis as
shown in Fig. 4b. This led to the following interesting
observations: First, sample 11 from batch 1&2 samples
was predicted in between class 2 and 3, in accordance
with the original OPLS-DA classifier in Fig. 3b. Second,
the ranking of the fruits from DS2-immature was well
maintained by the O2PLS-DA classifier and occasional
errors are similar to those observed with the OPLS-DA
classifier in Fig. 3b. These two observations further confirm the validity of the O2PLS-DA model. Third, samples from the second collection of dates appeared more
spread out than the samples from the first collection,
which show some density in the middle area between
class 2 and 3, also reflected by the density plot in Fig. 4c.
This could be due to the more controlled post-harvest
conditions with marketed dates which were dominant in
the first date collection. Last, with both DS1-bolon and
DS2-mature, date samples closer to class 2 appeared to
contain a relatively high level of sucrose. Apart from
141-SEED-LY annotated as a soft type (Additional file 2),
all other varieties with high sucrose levels and known
type belonged to the dry or semi-dry type. High sucrose
levels were also observed with the DS2-immature fruits
from classes 1 and 2 (Fig. 4b).
The metabolic space underlying PC1 from mature dates is
consistent with the biology of fruit ripening
Twenty three classes of metabolites having a common
structural or functional theme and comparable PC1
loading values were defined as described in the methods
section. This grouping is rationalized by the fact that
metabolites with strongly positive and strongly negative
loading values are highly correlated ‘within’ but anticorrelated ‘in between’. Strong correlation at either end
of the loading values range justifies the enrichment of
biological classes of metabolites at both ends of the
range. In parallel, there exists an intimate relationship
between loading values and PC scores in that a metabolite loading value expresses the extent of correlation between the metabolite abundance profile and PC scores
Page 12 of 22
across the samples. The relationship between metabolite
levels, PC1 loading values and scores in DS2-mature is
captured in the heatmap on Fig. 5 and a similar figure for
DS1-bolon can be found in Additional file 1: Figure S4.
The x-axis features date samples ordered by increasing
PC1 score values whilst the y-axis features metabolites
ordered by two criteria: First metabolite classes were
ordered by their median loading value then the metabolites were ordered by their loading values within each
class.
Inspection of the heatmap on Fig. 5 shows a clear signature of the biochemistry of date ripening as previously
outlined in the introduction section and additional details
are consistent with the general fruit ripening process as
shall be discussed later. Briefly, date samples with the
most positive PC1 scores featured the highest levels of
amines and regulatory polyamines, glutathione-mediated
antioxidant activity, energy production, lysophospholipids,
amino acids, tannins, non-reducing sugars and hormones.
The enrichment patterns of the last three classes of metabolites further to a similar pattern by pheophorbide A
(Fig. 6a), a degradation product of chlorophyll, are consistent with the biochemical profile of the Khalal early ripening stage in dates during which fruits ungreen and acquire
color (refer to background for more details). The abundance level of all previously mentioned metabolites declined in date samples with middle range PC1 scores. This
is unlike metabolites from the general phenylpropanoid
pathway, nucleic acid nucleosides, vitamins, TCA intermediates, sphingoid bases and lysophospholipid degradation
products which maintained a steady abundance level. The
enrichment in keto-octulosonic acid from the degradation
of cell wall pectin with middle range PC1 scores (Fig. 6b)
may indicate increased fruit softening which is typical of
the Rutab advanced ripening phase in dates (refer to background). Dates with very negative PC1 scores showed enrichment in unsaturated fatty acids, aroma volatiles from
degradation of amino acids and phenylpropanoids, reducing sugars and sugar dehydration products. The latter
can also derive from the Maillard reaction [34]; consistent
with the advanced ripening stage in dates (refer to background). Accumulation of glycolysis sugars and products
from degradation of ribosomal structure could be indicative of a slowing down in metabolic activity in fruits at this
stage. Similar enrichment/depletion patterns of metabolite
classes along PC1 were observed with DS1-bolon data
(Additional file 1: Figure S4), with a marginal discrepancy
in phospholipid metabolism.
Interestingly, date varieties obtained from different
countries showed similar PC1 values and hence comparable ripening-related biochemical profiles. Examples are
Deglet Nour date samples 117-DGNR-DZ and 64DGTNR-TN from Algeria and Tunisia, respectively, at the
positive end of PC1; Sufri date samples 41-SFR-SA and
Diboun et al. BMC Plant Biology (2015) 15:291
A
Page 13 of 22
B
C
Fig. 4 (See legend on next page.)
Diboun et al. BMC Plant Biology (2015) 15:291
Page 14 of 22
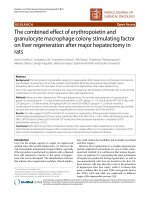
(See figure on previous page.)
Fig. 4 The O2PLS-DA model for predicting the ripening states of DS1-bolon samples. a A scatter plot of the O2PLS-DA predicted scores versus
the PC1 scores from DS1-bolon indicating a significant correlation level. b The O2PLS-DA class prediction scores (x-axis) for all 186 measured
metabolic profiles listed sequentially on the y-axis within their respective datasets. The batch1&2 samples served (excluding sample 11) as the
training set for the O2PLS-DA classifier. The DS2-immature samples are predicted correctly within their predefined development classes as
initially revealed by the PCA analysis: class1 (light green), class2 (light pink), class3 (light blue). The symbols color code reflects the level of
the dates endogenous sucrose level expressed in standard deviation units from the mean, calculated for each batch separately. Only samples
with high sucrose level are labelled with their IDs for clarity. c Density plot of the O2PLS-DA class prediction scores for the DS1-bolon and
DS2-mature datasets
52-SFR-QA from Saudi Arabia and Qatar, both with middle range PC1 values and Mabroom date samples 44MBRM-SA and 48-MBRM-QA from Saudi Arabia and
Qatar at the negative end of PC1 (Fig. 5 and Additional
file 1: Figure S4).
Close examination of the range of measured moisture
values from a handful of samples from the second sample collection (refer to methods) suggested the presence
of moist Rutab dates (25 % < moisture level <30 %)
amongst the cohort (Fig. 5). These may have been
undergoing active ripening related changes and may not
be considered mature dates, since their phenotype may
have changed have they been allowed more time to
complete their ripening (refer to methods for definition
of date maturity). Their inclusion in the cohort was
therefore incidental. Interestingly, dates where low moisture content (from the range [18–25 %] can be taken to
suggest a stationary metabolic activity and hence maturity were also observed at the positive range of PC1
(Fig. 5) that captures early ripening metabolic activity.
This indicates that the mature population of dates is
characterized by a varying extent of ripening metabolic
turnover. Further analysis suggested an enrichment of
the dry and semi-dry types of dates as well as increased fruit discoloration amongst the mature dates
at the positive range of PC1 whilst the soft type is
over-represented at the negative range (Fig. 5 and
Additional file 1: Figure S4) (based on association
analysis between PC1 scores and the date_type and
date_color variables that revealed significant pvalues
6.063e-09/0.05 and 0.018/0.002 for DS1-bolon/DS2mature respectively).
The same classes of metabolites were re-evaluated in
light of the loading values from PC2, 3 and 4 from analysis of DS1-bolon and DS2-mature. For each component and dataset, box plots of the loading values
arranged by metabolite class can be found in Fig. 7 and
Additional file 1: Figure S5. Interestingly, PC2 from the
two datasets appeared to carry the same metabolic signature with the sphingoids and lysophospholipids classes
observed at opposite ends of the loading values range
(Fig. 7). Moreover, the absolute correlation in the permetabolic class median of the PC2 loading values
between the two datasets was found equal to 0.68. No
concordance was found between the PC3 and PC4 perclass median loading values across the two datasets implying that PC3 and PC4 capture metabolic effects that
are intrinsic to each dataset. For DS1-bolon, PC3 captured an opposing effect between the metabolic class
TCA and two other classes: non-reducing sugars and Nacetylated amino acids whilst PC4 highlighted a contrast
between class TCA and class unsaturated fatty acids
and oxylipins (Additional file 1: Figure S5). As for DS2mature, an opposing trend was noted between metabolic
classes unsaturated fatty acid and oxylipins and rRNA
nucleosides for PC3 and between phenylpropanoids and
glycolysis for PC4.
Discussion
The ripening process may be completed to varying
extents in mature soft and dry types of dates causing
major variation in fruit composition
In this study, two collections of date fruits were measured
with metabolomics techniques and multivariate statistical
analysis applied to both extract and characterize the principal components that explain most variability in their
metabolomics data. The two date collections present fundamental differences: Dates from the first sample collection originated mostly from the Gulf region and the
subset that was obtained from shops is likely to have been
through a grading and drying process to meet market criteria. In contrast, dates from the second collection were
mostly North African varieties collected fresh from the
trees and local markets. Despite these differences, PC1
separately derived for each dataset was found in both
cases significantly associated with the fruit country of production with dates from the East Gulf region and the
West North African side being observed, in broad terms,
at opposite ends of the PC1 scale. Another factor that
proved to be strongly associated with PC1 is the extent of
metabolic conversion during the ripening process. The
moisture analysis indicated that this is partly explained by
the incidental occurrence of immature moist fruits which
possibly had not yet completed their ripening. This was
rather anticipated and was the reason for the inclusion of
a development stage dataset as part of the second cohort.
However, low moisture dates which should not incur any
further changes in their phenotype and are by definition
Diboun et al. BMC Plant Biology (2015) 15:291
Fig. 5 (See legend on next page.)
Page 15 of 22
Diboun et al. BMC Plant Biology (2015) 15:291
Page 16 of 22
(See figure on previous page.)
Fig. 5 Heatmap analysis based on DS2-mature data. Showing the abundance level of metabolites arranged in biological classes by increasing PC1
loading values (y-axis) along date samples arranged by increasing PC1 scores (x-axis). Metabolite classes are shown to the left in different colours to
reflect various biochemical phases of the ripening process in dates: (brown) early ripening Khalal, (green) ripening underway corresponding to Rutab
and (red) over-ripening. The positive range of PC1 shows increased discolouration amongst dates many of which belong to the dry type (black framed
rectangles). The soft type (highlighted in purple rectangles) is enriched at the negative range. Information on the dry/soft phenotype is variety specific
and was collected from the literature where possible. Low moisture fruits and relatively moist fruits appear randomly scattered along PC1
A
B
Fig. 6 Standardized abundance levels of selected metabolites in
DS2-bolon date samples ordered by PC1 scores. a Pheophorbide A,
a marker of chlorophyll degradation. b 3-deoxyoctulosonate, a
structural component of rhamnogalacturonan II species of pectin
and a marker of cell wall hydrolysis. Samples with missing values
were assigned a minimum value indicated by a red dashed line
mature, were found to span the entire range of PC1 displaying varying extents of ripening metabolic turnover. In
other words, some date samples reach maturity after a
rigorous ripening activity (negative range of PC1) whilst
others become mature and dry out having carried out a
lower extent of metabolic turnover (positive range of
PC1). Further analysis suggested that the former dates are
generally from the soft type whilst the latter are mostly
from the dry type. The soft/dry phenotype is variety specific and was, in this study, collected from the literature. It
is important to note that the phenotype in question does
not refer to a development or maturity stage per-se but to
a collection of physiochemical properties that distinguish
the fresh naturally ripened fruit from the two types: Dates
from the soft class are characterized by higher moisture,
softer texture and higher levels of sucrose to reducing
sugars in the ripe fruit (refer to background for more details). Due to their high moisture level, dates from the soft
class often necessitate additional drying to become mature
unlike the dry type which matures naturally on the trees.
Importantly, the observed variation in metabolic turnover in dates from the soft and dry types can explain
their known phenotypic differences. Low metabolic turnover in the dry type may limit the synthesis of color substances and efficient degradation of fibrous structures.
This could explain fruit discoloration and the hard texture typical to this type of date [4]. On the other hand
the high metabolic turnover with the soft type is likely
to be accompanied by optimal degradation of fibers and
accumulation of color molecules, which justifies the soft
texture and intensified color typical to this type of dates.
Also, the high sucrose versus high reducing sugar levels
in dry versus soft types of dates can be attributed to the
development effect since early accumulating sucrose is
readily broken down into reducing sugars as ripening
progresses. Interestingly, hydrolysis of sucrose by invertase during ripening was found to display faster kinetics
in soft than in the dry type of dates [35]. Slower degradation of sucrose could be a limiting factor for the ripening process in dry varieties as it would impact a
significant proportion of downstream ripening reactions.
Whether the activity of invertase is alone causative of
the soft/dry classification of dates remains to be investigated. Also, underlying factors whether of genetic nature
or simply consisting of low water activity or both need
Diboun et al. BMC Plant Biology (2015) 15:291
Page 17 of 22
A
B
Fig. 7 Boxplots of PC2 loading values arranged by metabolic class. a DS1-bolon, b DS2-mature. The classification of metabolites follows
that developed for PC1 (refer to methods). For both datasets, metabolite classes sphingoids and lysophospholipids (pointed at with a red
arrow) appeared to underlie the effect captured by PC2. Classes with less than three metabolites were not considered; these consisted of
tannins and dipeptides for DS1-bolon and polyamines, methoxycinnamates and benzenoid VOCs, energy and amines for DS2-bolon. The
star in each box indicates the median loading value per metabolic class
to be addressed; as although evidence in the literature
suggests genetic diversity between the soft and dry types
[17], a direct link to the fruit ripening process remains
to be established. One venue for investigating the role of
water activity is via experimental modification of water
content in developing soft and dry dates through altering
irrigation amount and frequency [36, 37]. This combined
with global metabolome characterization of a larger
cohort of dry and soft dates may provide important
clues on the relevance of water activity to the soft
and dry phenotypes in dates. In summary, the ripening effect captured in PC1 in this study is not exclusive to fresh immature dates with ongoing ripening
activity but also mature dates from the dry/soft classes that display varying extent of metabolic turnover
during ripening.
Importantly, the enrichment of dry and soft type of
dates at opposite ends of PC1 provides an explanation
for observed association between PC1 scores and geography. In the Arab world, different types of date palm
cultivation areas with varying climates tend to be more
suitable for either type of dates: Oasis sites typical to
North African countries including Tunisia, Morocco,
Algeria, Libya and Egypt are famous for the semi-dry
and dry types of dates whilst offshore dry areas found in
Egypt, Sudan, Libya, Saudi Arabia and Oman are mainly
suitable for dry varieties. Finally, the humid nature of
coastal areas typical to Bahrain, United Arab Emirates
and Qatar are more suitable for soft varieties of dates
[15, 16]. Importantly, the established genetic variation in
dates between the North African and Arabian Gulf regions [38] could be linked to varying climatic conditions
imparting a bias in the type of cultivar between the two
regions.
In comparison to PC2, 3 and 4, PC1 captures a
higher proportion of the variance in the data. Also, in
this work, unlike PC2, 3 and 4, PC1 is significantly
associated with available phenotypic characteristics of
the dates including the country of production, soft/
dry type and color intensity. This justifies its being at
the focus of this study. Nevertheless, the metabolic
signatures of PC2, 3 and 4 will be later discussed in
some details.
Multivariate techniques are useful exploratory and
integrative tools of single and multi-measured
metabolomics datasets
In this study, a range of multivariate techniques were
used to reach a comprehensive understanding of determinants of metabolic variation in date samples. Initially,
non-supervised PCA was used to extract this variation.
In order to assess the relationship with the ripening
process, an OPLS-DA classifier was trained on the DS2immature dataset to model the ripening process in dates.
However, a prerequisite for the OPLS-DA model is class
segregation of samples, which was clearly missing with
this dataset. This is because the fruits in DS2-immature
were not collected at pre-set time intervals during the
Diboun et al. BMC Plant Biology (2015) 15:291
ripening process and therefore could not be aligned
across samples to create the required classes. Instead, a
PCA analysis revealed a dominant PC1 that essentially
captured the ripening process in DS2-immature and organized the constituent fruits accordingly into three
broad clusters. Clusters 2 and 3 served as the training
set for the OPLS-DA model leaving out cluster 1. This is
rationalized by the anticipation that the prediction set,
consisting of DS2-mature, would lay between clusters 2
and 3 as cluster 1 featured green dates from the early
phase of ripening that was not represented in the prediction set. Mapping the development effect onto DS1bolon from the first date collection was important for
the sake of replicating the association between PC1 and
the biochemistry of fruit ripening in a yet independent
dataset. The model used was based on the O2PLS-DA
procedure which is able to extract systematic variation
from batch 1 and 2 measurements of the training set that
consistently differentiate the designated sample classes. It
follows that the O2PLS-DA procedure was used in this
study to consolidate separate batch measurements of the
same samples as although the measuring technique was
essentially the same, slight operational changes may
have been introduced between the two batch measurements which were well separated in time. This is,
in principal, similar to the way the technique has
been traditionally applied to bring together measurements of the same biological samples by different
analytical methods [30].
Comprehensive characterization of temporal aspects of
ripening metabolism in dates
At the metabolic level, PC1 has a ripening signature and
is the reason why it is able to differentiate between the
dry and soft phenotypes that undergo varying ripening
kinetics. Soft and dry types of dates have different climatic requirements which could explain the association
between PC1 and geography. We now focus on the
metabolic signature of PC1 and dedicate the remaining
part of the discussion section to contrasting observed
enrichment in classes of metabolites along PC1 with the
known biochemistry of fruit ripening (though, we will
occasionally refer to other PCs when discussing metabolic classes that are relevant to them). We would implicitly refer to the positive and negative ends of PC1 by
their corresponding ripening profiles as early ripening
and late ripening based on the results on Fig. 5. We will
frequently refer to Additional file 6 which shows scatter
plots of all metabolite abundance profiles along PC1 organized within their respective biological classes.
Amino acids and related metabolites
Enrichment in free amino acids was observed in this
study in dates with an early ripening profile similar to
Page 18 of 22
other fruit [8, 39] (Fig. 5). Amongst all detected amino
acids, the levels of alanine, glutamate and aspartate declined least in dates with late ripening profile (Additional
file 6), consistent with previous work looking at ripening
in tomato [39]. In general, amino acids serve as building
blocks for synthesis of key intermediates and endproducts of the ripening process in fruits [8]. In particular the aromatic amino acids, also measured in this
study, give rise to a myriad of secondary metabolites,
notably color and flavor-conferring phenylpropanoids.
The observed enrichment in dipeptides in date fruits
with an early ripening profile in this study (Fig. 5) may
be linked to protein degradation activity recruited by
hormones to eliminate pre-ripening enzymes at the onset of ripening [8]. Another potential source for the dipeptides is the targeting peptide sequence, attached to
pre-folded nuclear proteins, which is digested upon protein entry into organelle structures including chromoplast [40]. Chromoplasts, which are differentiated forms
of chloroplasts lacking chlorophyll, act as metabolic
hubbs at early ripening, necessicating constant in-flow of
effector proteins from the nucleus [41]. Targeting peptide sequences contain mostly hydrophobic amino acid
residues [40], consistent with the high proportion (70 %)
of hydrophobic valine, leucine, isoleucine and phenylalanine amongst amino acid constituents of the dipeptides observed in this study. Interestingly, N-acetylation
of chromoplast-targeted pre-folded proteins was suggested as a mechanism of organelle specificity [42]. This
may account for the enrichment of N-acetylated amino
acids in date samples with an early ripening profile in
this study (Fig. 5); although acetylation can sometimes
be a necessary intermediate reaction during metabolism
of amino acids. Finally, enrichment in glutathione activity in dates with an early ripening profile (Fig. 5) is consistent with increased antioxidant activity in fruits at
early ripening [43].
Primary amines and polyamines
In this study, ethanolamine, GABA, serotonin, tyramine,
tryptamine and phenethylamine from the decarboxylation of serine, glutamate, 5-hydroxy tryptamine, tyrosine, tryptophan and phenylalanine were all found
enriched in dates with early ripening profiles (Additional
file 6). This is consistent with early ripening expression
of amino acid decarboxylases leading to amine synthesis
in a number of fruits [44, 45]. Tyramine and tryptamine
serve as precursors for the synthesis of defensemediating alkaloids previously detected in dates [46] and
a turnover of phenethylamine into antipathogen volatiles
phenylacetaldehyde and phenylethanol serves the same
purpose [8, 45]. The role of serotonin in fruit ripening
has not been fully investigated; however, melatonin that
derives from N-acetylserotonin (a derivative of serotonin
Diboun et al. BMC Plant Biology (2015) 15:291
also observed in our data), has recently been found to
promote various physiological aspects of ripening when
given exogenously to green tomato [47]. Recently, the
decrease in GABA with ripening was linked to maintaining high levels of essential glutamate and aspartate during tomato ripening [48]. Enrichment in the polyamine
putrescine in dates with an early ripening profile (at the
positive end of PC1) is consistent with previously reported expression of a mouse ornithine decarboxylase
conjugated to a ripening specific promotor at the onset
of ripening in transgenic tomato [49]. Previous work
suggested a synergy between the ripening hormone
ethylene and the polyamines spermine and spermidine,
derivatives of putrescine [39, 50]. The potential regulatory role of putrescine may justify its co-occurrence with
products from its degradation pathway in dates with an
early ripening profile (Additional file 6).
Secondary metabolism
The earliest sign of secondary metabolites from the phenylpropanoid pathway in our data consisted of tannins
procyanidin B1 and procyanidin B2 and catechin monomers all showing maximal level in dates with an early
ripening profile (Additional file 6), in accordance with
the literature [8, 51]. Astringent tannin oligomers are
abundant in green fruit and only lose their astringency
when undergoing structural changes as ripening progresses [52]. In addition to tannins, a wide range of color
and flavor flavonoids and hydroxycinnamates were observed to peak at different ranges of PC1 and some
showed no correlation with PC1. In general, variance
from these metabolites was poorly explained by PC1
(Additional file 6). This could be due to a much stronger
influence by genetic background [8], which may contribute to unique taste and color characteristics of individual
varieties. Interestingly, PC4 from DS2-mature revealed
an opposing trend between classes phenylpropanoids
and TCA on one hand and the accumulation of phosphorylated sugars, captured under the class glycolysis, on
the other hand. This effect can be explained by energy
requirement for the synthesis of phenylpropanoids
through initial degradation of phosphorylated sugars
during glycolysis and downstream TCA activity. A third
class of secondary metabolites consisted of volatiles,
major contributors to aroma in fruits. In this study, an
increase in branched chain amino acid derived volatiles
and hydroxycinnamate derived volatiles was observed in
dates with a late ripening profile (Fig. 5 and Additional
file 6), consistent with the literature [8]. Volatiles are
strong attractants of seed dispersers and their sharp increase in overripe fruit could constitute a mechanism to
maximize the chance of consumption before onset of
senescence.
Page 19 of 22
Changes to cell wall and cell membrane
Alterations in cell membrane composition have long
been known to occur during ripening [53–55], but have
been given little attention by the more recent literature.
Key changes to membrane phospholipids during ripening include an increased desaturation level of fatty acyl
chains facilitating their peroxidation. Induction of expression of a handful of desaturase isomers was found to
be strongly associated with a continuous flux of linoleate
and linolenate substrates of the lipoxygenase (LOX)
pathway during peach ripening [56]. This pathway is
known for being the mechanism of synthesis of a myriad
of C6 volatile aldehydes and alcohols that contribute significantly to fruit aroma [8]. In this study, a range of
mono and poly-unsaturated fatty acids including the
LOX substrates and their oxidized derivative oxylipins
were observed to generally plummet in dates with a late
ripening profile at the negative range of PC1.
Initial excision of fatty acyl chains resulted in accumulation of lysophospholipids in dates with an early ripening
profile and late accumulation of lysophospholipid degradation products in dates with a late ripening profile (Fig. 5).
These included monoacylglycerols and phosphorylated
head groups, free head groups and remaining lysophosphatidic acids [57] as well N-acylethanolamines, derivatives of
lysophospholipids via N-acylphosphatidylethanolamine intermediates [31] (Additional file 6). These degradation
products, in addition to sphingoid bases, are likely to
have a signaling role in fruits and some are already
known to be downstream mediators of abscisate signaling in other plant organs [58–60]. The opposing trend
in lysophospholipids versus sphingoids by PC2 in both
datasets is interesting and may suggest a change in signaling patterns during ripening of certain date varieties
or as a response to certain external stimuli. For instance, sphingolipid signaling is known to be induced
under drought conditions in plants [59].
Fruit softening during ripening is known to be associated with an increased activity of fiber degrading enzymes,
many of which targeting cell wall structures [8]. Pectin is a
major constituent of the plant cell wall and its hydrolysis
seems to make way for synergistic disassembly of cellulose
and hemicellulose polysaccharide matrices [8]. In this
study, the abundance of keto-deoxyoctulosonic acid, an
acidic monosaccharide located in the side chain of the
rhamnogalacturonan II class of pectin peaked in dates
with middle range PC1 (Fig. 6b). This served to establish a
link to the Rutab phase which is characterized by maximal
fruit softness (refer to results).
Sugar metabolism, energy and gene expression activity
In this study, sucrose and related non-reducing sugars
kestose and melezitose (from DS1-bolon) were most
abundant in fruits with an early ripening profile at the
Diboun et al. BMC Plant Biology (2015) 15:291
positive range of PC1 (Fig. 5, Additional file 6). In fruits,
an increase in sucrose levels is observed at the late mature green stage and sucrose is broken down by the
enzyme invertase following the onset of ripening [8].
Metabolism of released sugar monomers proceeds via
the early pentose phosphate pathway, which serves to
provide carbon precursor molecules for the synthesis of
aromatic amino acids, secondary metabolites, vitamins
and purine/pyrimidines. In parallel, flux through glycolysis and the downstream TCA cycle serves to sustain energy levels required for gene expression and anabolic
reactions during ripening. The relationship between precursor non-reducing sugars and product TCA intermediates is captured by PC3 from DS1-bolon and may
reflect varying glycolysis/TCA kinetics across the date
cohort.
In this study, the abundance levels of energy molecules
NAD+ and AMP were lowest in dates with a late ripening profile (Fig. 5, Additional file 6). This together with
accumulation of the TCA cycle intermediate fumarate,
members of the glycolysis pathway and ribosomal nucleosides possibly originating from ribosome degradation
(Additional file 6) may indicate a diminished metabolic
activity at this late stage of ripening. Interestingly, metabolites from the TCA/rRNA nucleosides classes appeared to contrast the unsaturated fatty acids and
oxylipins in PC4/PC3 from DS1-bolon/DS2-mature respectively. Late synthesis of oxylipins in some species of
dates may require residual TCA activity and late synthesis of key enzymes.
The accumulation of reducing sugars in dates with a
late ripening profile in this study (Fig. 5) confirmed similar reports in dates at the late Tamr stage [10]. Amongst
the sugars observed (also shown in Additional file 6) xylose, fucose, arabinose and glucose may derive from cell
wall hydrolysis activity during ripening. Ribulose and
xylulose could derive from their phosphorylated forms
from the pentose phosphate pathway whilst sugar alcohols, sugar lactones and derivative acids may result from
upregulation of aldose/ketose oxidoreductases in ripe
dates, previously shown using a proteomics approach
[61]. It is important to note that besides contributing to
fruit flavor, sugar alcohols are a type of polyol osmoprotectant that may act to alleviate the impact of fruit
dryness at this stage.
Vitamins and hormones
In this study, a range of vitamins has been detected including riboflavin, niacin, pyridoxine and nicotinate
(Additional file 6). The enrichment in pyridoxine in
dates with an early ripening profile may be attributed to
its essential role in amino acid synthesis and metabolism
by amino acid decarboxylases at the early phase of
ripening. In contrast, the accumulation of threonate
Page 20 of 22
(Additional file 6), a degradation product of vitamin C,
in dates with a late ripening profile is consistent with the
previously described decrease in vitamin C at the Tamr
stage [1].
Dates behave like climacteric fruits implying a leading
regulatory role by ethylene although interplay with
abscisate may be operating on certain ripening events
[8]. In this study, the ripening hormone ethylene was
not measured (below the mass cut-off imposed on the
instrumentation) but two related metabolites were observed (Additional file 6). One is cyanoalanine, which is
a conjugate of cysteine and cyanide (cyanide being a
toxic byproduct of ethylene synthesis [62]) and 5methylthioadenosine, an intermediate in the Yang cycle
that replenishes the ethylene precursor SAM. Both molecules showed maximum levels in dates with an early
ripening profile at the positive range of PC1 (Additional
file 6). This range was previously mapped to the Khalal
stage (refer to results), which follows the climacteric
ethylene peak in dates [63]. A similar pattern by isopentenyl adenosine, the precursor of the cytokinin hormone
zeatin, is concordant with the reported abundance profile of zeatin during tomato ripening [64]. Abscisate is
an early regulator that precedes ethylene in the climacteric fruit model tomato [65, 66]. Following the peak in
ethylene, abscisate was shown to increase in abundance
slightly [67], which could explain the small peak in
abscisate observed in this study in dates with middle
range PC1 values. In summary, key hormones and related metabolites were measured as part of this work
motivating future analysis of partial correlations with
other measured metabolites in order to uncover regulatory mechanisms operating on distinct aspects of the
ripening process in date fruit.
Conclusions
This study has shed light on important aspects of date
fruit biology. It was shown that mature dates may significantly vary in their composition depending on the
extent of metabolic conversion during the ripening
process in line with the dry/soft classification of dates. It
follows that the dry and soft types of dates present varying nutritional value and whilst the dry type is richer in
amino acids, amines, phospholipids, energy molecules
and sucrose sugar, the soft type contains more aroma
volatiles, reducing sugars, sugar alcohols and acids, simpler lipids and may carry traces of dehydration products
as a consequence of artificial drying. In addition to the
ripening effect, the geography aspect was found to be associated with the main component of variation (PC1) in
both cohorts. This was also linked to the dry and soft
phenotypes based on the fact that the two types have
varying climatic requirements. Our analysis of metabolite classes in dates with early versus advanced ripening
Diboun et al. BMC Plant Biology (2015) 15:291
metabolic profiles revealed similarity to ripening in other
fruits and served to emphasize the changes in phospholipids that are not described in sufficient details in the
current literature. The findings from this study were
confirmed in two separate datasets and one dataset was
measured by two independent metabolomics platforms
to reveal identical effects. The reliability and reasonable
cost of metabolomics technique may motivate further
research on non-model fruits contributing to a broader
understanding of various aspects of fruit biology.
Availability of supporting data
Metabolomics datasets measured by Metabolon in this
study are available in Additional file 4 & Additional
file 5.
Additional files
Additional file 1: Figure S1. Phenotyping the date samples. Figure S2.
Iterative optimization of the O2PLS-DA classifier. Figure S3. Quality control
based on Metabolon/MetaSysX replicate measurements. Figure S4.
Heatmap analysis based on DS1-bolon data. Figure S5. Boxplots of
PC3&4 loading values arranged by metabolic class. (PPTX 567 kb)
Additional file 2: Variety, origin, and characteristics of date
samples. (DOCX 60 kb)
Additional file 3: Sample processing and metabolomics
measurement. (DOCX 31 kb)
Additional file 4: Metabolomics data from the first sample
collection, measured by Metabolon (DS1-bolon). (XLSX 322 kb)
Additional file 5: Metabolomics data from the second sample
collection, measured by Metabolon (DS2). (XLSX 379 kb)
Additional file 6: Abundance profiles of standardized metabolite
levels along DS2-mature samples arranged by increasing PC1
scores. (PDF 1578 kb)
Abbreviations
VOCs: Volatile organic compounds; DS1-bolon: Metabolomics dataset from
the first date collection measured by Metabolon; DS1-sysX: Metabolomics
dataset from the first date collection measured by MetaSysX;
DS2: Metabolomics data from the second date collection measured by
Metabolon; DS2-immature: Metabolomics data from the development stage
samples, a subset of the second date collection measured by Metabolon or
DS2; DS2-mature: Metabolomics data from the second date collection
measured by Metabolon (or DS2) excluding the development stage samples;
Batch 1&2 samples: 10 samples from the first sample collection measured
again along the samples from the second date collection.
Competing interests
The authors declare that they have no competing interests.
Authors’ contributions
Study design: JM, KS. Sample collection: SM, ID, JM, MT, ME, MA, AH. Data
analysis: ID. Metabolomics analysis: RM, EK from Metabolon Inc., MM from
MetaSysX, GmbH. Paper writing: all authors. All authors have read and
approved the final version of the manuscript.
Acknowledgements
Funding for this research was provided by Qatar National Research Fund, a
member of Qatar Foundation under the National Priorities Research Program
– Exceptional Award (NPRP-EP) NPRPX-014-4-001. This work is also supported
by ‘Biomedical Research Program’ funds at Weill Cornell Medical College in
Qatar, a program funded by the Qatar Foundation. All statements are solely
the responsibility of the authors.
Page 21 of 22
Author details
1
Department of Physiology and Biophysics, Weill Cornell Medical College,
Qatar Foundation – Education City, PO Box 24144, Doha, Qatar. 2Genomics
Laboratory, Weill Cornell Medical College, Doha, Qatar. 3Life sciences
research division, ADLQ, Doha, Qatar. 4Department of Genetic Medicine,
Weill Cornell Medical College, Doha, Qatar. 5MetaSysX GmbH, Potsdam,
Germany. 6Metabolon, Inc., Durham, USA.
Received: 8 July 2015 Accepted: 3 December 2015
References
1. Gasmi A. Le Palmier-Dattier: Elaourassia editions; 2012.
2. Eid NMS, Al-Awadi B, Vauzour D, Oruna-Concha MJ, Spencer JPE. Effect of
cultivar type and ripening on the polyphenol content of date palm fruit.
J Agr Food Chem. 2013;61(10):2453–60.
3. Hasnaoui L, Elhoumaizi M, Hakkou A, Wathlet B, Sindic M. Physico-chemical
characterization, Classification and Quality Evaluation of Date Palm Fruits of
some Moroccan Cultivars. J Sci Res. 2011;3(1):11.
4. Barreveld WH. Date palm products. In: Repository FCD, editor. Whole dates,
vol. 101. Rome: Viale delle Terme di Caracalla; 1993.
5. El Hadrami AA-K, Jameel M. Socioeconomic and traditional importance of
date palm. Emirates J Food Agric. 2012;24(5):15.
6. Ishurd O, Zahid M, Xiao P, Pan YJ. Protein and amino acids contents of Libyan
dates at three stages of development. J Sci Food Agr. 2004;84(5):481–4.
7. Auda H, Alwandawi H, Aladhami L. Protein and Amino-Acid Composition of
3 Varieties of Iraqi Dates at Different Stages of Development. J Agr Food
Chem. 1976;24(2):365–7.
8. Seymour BG, Poole M, Giovannoni J, Tucker GA. The molecular biology and
biochemistry of fruit ripening. UK: Wiley-Blackwell; 2013.
9. Haider MS, Khan IA, Naqvi SA, Jaskani MJ, Khan RW, Nafees M, et al. Fruit
Developmental Stages Effects on Biochemical Attributes in Date Palm.
Pak J Agr Sci. 2013;50(4):577–83.
10. El Arem A, Saafi EB, Flamini G, Issaoui M, Ferchichi A, Hammami M, et al.
Volatile and nonvolatile chemical composition of some date fruits (Phoenix
dactylifera L.) harvested at different stages of maturity. Int J Food Sci Tech.
2012;47(3):549–55.
11. Ahmed IA, Ahmed AWK, Robinson RK. Chemical-Composition of
Date Varieties as Influenced by the Stage of Ripening. Food Chem.
1995;54(3):305–9.
12. Amira E, Flamini G, Behija SE, Manel I, Nesrine Z, Ali F, et al. Chemical and
aroma volatile compositions of date palm (Phoenix dactylifera L.) fruits at
three maturation stages. Food Chem. 2011;127(4):1744–54.
13. Farag MA, Mohsen M, Heinke R, Wessjohann LA. Metabolomic fingerprints
of 21 date palm fruit varieties from Egypt using UPLC/PDA/ESI-qTOF-MS
and GC-MS analyzed by chemometrics. Food Res Int. 2014;64:218–26.
14. Mrabet A, Ferchichi A, Chaira N, BenSalah M, Baazi M, Threadgill Mrabet P.
Physico-chemical characteristics and total quality of date palm varieties
grown in the Southern of Tunisia. Pak J Biol Sci. 2008;11(7):5.
15. Johnson DV, Al-khayri JM, Jain SM. Date palm genetic resources and
utilization, vol. 1. Africa and the Americas: Springer Science + Business
Media Dordrecht; 2015.
16. Al-Khayri JM, Jain SM, Johnson DV. Date Palm Genetic Resources and
utilization, vol. 2. Asia and Europe: Springer Science + Business Media
Dordrecht; 2015.
17. Hamza H, Benabderrahim MA, Elbekkay M, Ferdaous G, Triki T, Ferchichi A.
Investigation of genetic variation in Tunisian date palm (Phoenix dactylifera L.)
cultivars using ISSR marker systems and their relation with fruit characteristics.
Turk J Biol. 2012;36(4):449–58.
18. Hamza H, Vendramin GG, Ali F. Microsatellite Diversity among Tunisian Date
Palm (Phoenix Dactylifera L.) Subpopulations. Pak J Bot. 2011;43(2):1257–64.
19. Hamza H, Rejeli M, Elbekkay M, Ferchichi A. New Approach for the
morphological identification of date palm (Phoenix Dactylifera L.) cultivars
in Tunisia. Pak J Bot. 2009;41(6):10.
20. Suhre K, Gieger C. Genetic variation in metabolic phenotypes: study designs
and applications. Nat Rev Genet. 2012;13(11):759–69.
21. Steingass CB, Carle R, Schmarr HG. Ripening-dependent metabolic changes
in the volatiles of pineapple (Ananas comosus (L.) Merr.) fruit: I.
Characterization of pineapple aroma compounds by comprehensive
two-dimensional gas chromatography–mass spectrometry. Anal Bioanal
Chem. 2015;407(9):2591–608.
Diboun et al. BMC Plant Biology (2015) 15:291
22. Cagliani LR, Pellegrino G, Giugno G, Consonni R. Quantification of Coffea
arabica and Coffea canephora var. robusta in roasted and ground coffee
blends. Talanta. 2013;106:169–73.
23. Giavalisco P, Li Y, Matthes A, Eckhardt A, Hubberten HM, Hesse H, et al.
Elemental formula annotation of polar and lipophilic metabolites using
C-13, N-15 and S-34 isotope labelling, in combination with high- resolution
mass spectrometry. Plant J. 2011;68(2):364–76.
24. Cuadros-Inostroza A, Caldana C, Redestig H, Kusano M, Lisec J, Pena-Cortes
H, et al. TargetSearch - a Bioconductor package for the efficient
preprocessing of GC-MS metabolite profiling data. BMC Bioinformatics.
2009;10:428.
25. Kopka J, Schauer N, Krueger S, Birkemeyer C, Usadel B, Bergmuller E,
et al. : the Golm Metabolome Database. Bioinformatics.
2005;21(8):1635–8.
26. Evans AM, DeHaven CD, Barrett T, Mitchell M, Milgram E. Integrated,
Nontargeted Ultrahigh Performance Liquid Chromatography/Electrospray
Ionization Tandem Mass Spectrometry Platform for the Identification and
Relative Quantification of the Small-Molecule Complement of Biological
Systems. Anal Chem. 2009;81(16):6656–67.
27. DeHaven CD, Evans AM, Dai HP, Lawton KA. Organization of GC/MS and
LC/MS metabolomics data into chemical libraries. J Cheminform. 2010;2:9.
28. DeHaven CD, Evans AM, Dai H, Lawton KA. Software Techniques for
Enabling High-Throughput Analysis of Metabolomic Datasets,
Metabolomics. 2012.
29. Eriksson L, Byrne T, Johansson E, Trugg J, Vikstrom C. Multi- and Megavariate
Data Analysis. Basic principals and applications: MKS Umetrics AB.
30. Bylesjo M, Eriksson D, Kusano M, Moritz T, Trygg J. Data integration in plant
biology: the O2PLS method for combined modeling of transcript and
metabolite data. Plant J. 2007;52(6):1181–91.
31. Coulon D, Faure L, Salmon M, Wattelet V, Bessoule JJ. Occurrence,
biosynthesis and functions of N-acylphosphatidylethanolamines (NAPE): not
just precursors of N-acylethanolamines (NAE). Biochimie. 2012;94(1):75–85.
32. Khan MS, Maden BE. Conformation of methylated sequences in HeLa
cell 18-S ribosomal RNA: nuclease S1 as a probe. Eur J Biochem.
1978;84(1):241–50.
33. Funk C, Brodelius PE. Phenylpropanoid Metabolism in Suspension Cultures
of Vanilla planifolia Andr. : III. Conversion of 4-Methoxycinnamic Acids into
4-Hydroxybenzoic Acids. Plant Physiol. 1990;94(1):102–8.
34. Murkovic M, Pichler N. Analysis of 5-hydroxymethylfurfual in coffee, dried
fruits and urine. Mol Nutr Food Res. 2006;50(9):842–6.
35. Hasegawa S, Smolensk D. Date Invertase - Properties and Activity
Associated with Maturation and Quality. J Agr Food Chem. 1970;18(5):902.
36. Hussein F, Hussein MA. Effect of irrigation on growth, yield and fruit quality
of dry dates grown at Asswan. In: Proceedings of the First Symposium on
the Date Palm in Saudi Arabia: 1983; Al-Hassa, Saudi Arabia.
37. Al-Yahyai R, Al-Kharusi L. Sub-optimal irrigation affects chemical
quality attributes of dates during fruit development. Afr J Agric Res.
2012;7(10):6.
38. Mathew LS, Seidel MA, George B, Mathew S, Spannagl M, Haberer G, et al.
A Genome-Wide Survey of Date Palm Cultivars Supports Two Major
Subpopulations in Phoenix dactylifera. G3. 2015;5(7):1429–38.
39. Kausch KD, Sobolev AP, Goyal RK, Fatima T, Laila-Beevi R, Saftner RA,
et al. Methyl jasmonate deficiency alters cellular metabolome, including
the aminome of tomato (Solanum lycopersicum L.) fruit. Amino Acids.
2012;42(2–3):843–56.
40. Teixeira PF, Glaser E. Processing peptidases in mitochondria and
chloroplasts. Biochim Biophys Acta. 2013;1833(2):360–70.
41. Li L, Yuan H. Chromoplast biogenesis and carotenoid accumulation. Arch
Biochem Biophys. 2013;539(2):102–9.
42. Bischof S, Baerenfaller K, Wildhaber T, Troesch R, Vidi PA, Roschitzki B, et al.
Plastid proteome assembly without Toc159: photosynthetic protein import
and accumulation of N-acetylated plastid precursor proteins. Plant Cell.
2011;23(11):3911–28.
43. Resende ECO, Fabiane Martins P, Antunes De Azevedo R, Jacomino AP,
Urbano Bron I. Oxidative processes during ‘Golden’ papaya fruit ripening.
Brazilian Soc Plant Physiol. 2012;24(2):9.
44. Gallego PP, Whotton L, Picton S, Grierson D, Gray JE. A role for glutamate
decarboxylase during tomato ripening: the characterisation of a cDNA
encoding a putative glutamate decarboxylase with a calmodulin-binding
site. Plant Mol Biol. 1995;27(6):1143–51.
Page 22 of 22
45. Tieman D, Taylor M, Schauer N, Fernie AR, Hanson AD, Klee HJ. Tomato
aromatic amino acid decarboxylases participate in synthesis of the flavor
volatiles 2-phenylethanol and 2-phenylacetaldehyde. Proc Natl Acad Sci
U S A. 2006;103(21):8287–92.
46. Al-daihan S, Shafi Bhat R. Antibacterial activities of extracts of leaf, fruit, seed
and bark of Phoenix Dactylifera. Afr J Biotechnol. 2012;11(42):10021–5.
47. Sun Q, Zhang N, Wang J, Zhang H, Li D, Shi J, et al. Melatonin promotes
ripening and improves quality of tomato fruit during postharvest life.
J Exp Bot. 2015;66(3):657–68.
48. Snowden CJ, Thomas B, Baxter CJ, Smith JA, Sweetlove LJ. A tonoplast
Glu/Asp/GABA exchanger that affects tomato fruit amino acid composition.
Plant J. 2015;81(5):651–60.
49. Pandey R, Gupta A, Chowdhary A, Pal RK, Rajam MV. Over-expression of mouse
ornithine decarboxylase gene under the control of fruit-specific promoter
enhances fruit quality in tomato. Plant Mol Biol. 2015;87(3):249–60.
50. Sobolev AP, Neelam A, Fatima T, Shukla V, Handa AK, Mattoo AK. Genetic
introgression of ethylene-suppressed transgenic tomatoes with higherpolyamines trait overcomes many unintended effects due to reduced
ethylene on the primary rnetabolome. Front Plant Sci. 2014;5:632.
51. Amira E, Behija SE, Beligh M, Lamia L, Manel I, Mohamed H, et al.
Effects of the Ripening Stage on Phenolic Profile, Phytochemical
Composition and Antioxidant Activity of Date Palm Fruit. J Agr Food
Chem. 2012;60(44):10896–902.
52. Joslyn MA, Goldstein JL. Astringency of Fruits and Fruit Products in Relation
to Phenolic Content. Adv Food Res. 1964;13:179–217.
53. Wade NL, Bishop DG. Changes in the lipid composition of ripening banana
fruits and evidence for an associated increase in cell membrane
permeability. Biochim Biophys Acta. 1978;529(3):454–60.
54. Lurie S, Ben-Arie R. Microsomal Membrane Changes during the Ripening of
Apple Fruit. Plant Physiol. 1983;73(3):636–8.
55. Rouet-Mayer MA, Valentova O, Simond-Cote E, Daussant J, Thevenot C.
Critical analysis of phospholipid hydrolyzing activities in ripening tomato
fruits. Study by spectrofluorimetry and high-performance liquid
chromatography. Lipids. 1995;30(8):739–46.
56. Zhang B, Shen JY, Wei WW, Xi WP, Xu CJ, Ferguson I, et al. Expression of genes
associated with aroma formation derived from the fatty acid pathway during
peach fruit ripening. J Agric Food Chem. 2010;58(10):6157–65.
57. Whitaker BD, Smith DL, Green KC. Cloning, characterization and functional
expression of a phospholipase Dalpha cDNA from tomato fruit. Physiol
Plant. 2001;112(1):87–94.
58. Wang X. The role of phospholipase D in signaling cascades. Plant Physiol.
1999;120(3):645–52.
59. Okazaki Y, Saito K. Roles of lipids as signaling molecules and mitigators
during stress response in plants. Plant J. 2014;79(4):584–96.
60. Zhang W, QIN C, Ahao J, Wang X. Phospholipase D alpha1-derived
phosphatidic acid interacts with ABI1 phosphatase 2C and regulates abscisic
acid signalling. Proc Natl Acad Sci. 2004;101:5.
61. Marondedze C, Gehring C, Thomas L. Dynamic changes in the date
palm fruit proteome during development and ripening. Hortic Res.
2014;1(1):14039.
62. Wirtz M, Hell R. Functional analysis of the cysteine synthase protein
complex from plants: structural, biochemical and regulatory properties.
J Plant Physiol. 2006;163(3):273–86.
63. Abbas MF, Ibrahim MA. The role of ethylene in the regulation of fruit
ripening in the hillawi date palm (Phoenix dactylifera L). J Sci Food Agr.
1996;72(3):306–8.
64. Desai N, Chism GW. Changes in Cytokinin Activity in Ripening Tomato Fruit.
J Food Sci. 1978;43(4):1324–6.
65. Wu J, Xu Z, Zhang Y, Chai L, Yi H, Deng X. An integrative analysis of the
transcriptome and proteome of the pulp of a spontaneous late-ripening
sweet orange mutant and its wild type improves our understanding of fruit
ripening in citrus. J Exp Bot. 2014;65(6):1651–71.
66. Sun L, Sun Y, Zhang M, Wang L, Ren J, Cui M, et al. Suppression of
9-cis-epoxycarotenoid dioxygenase, which encodes a key enzyme in
abscisic acid biosynthesis, alters fruit texture in transgenic tomato.
Plant Physiol. 2012;158(1):283–98.
67. Leng P, Yuan B, Guo Y. The role of abscisic acid in fruit ripening and
responses to abiotic stress. J Exp Bot. 2014;65(16):4577–88.