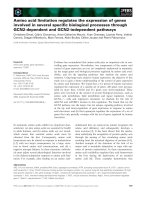
Expression profiling of genes involved in drought stress and leaf senescence in juvenile barley
Bạn đang xem bản rút gọn của tài liệu. Xem và tải ngay bản đầy đủ của tài liệu tại đây (675.85 KB, 12 trang )
Wehner et al. BMC Plant Biology (2016) 16:3
DOI 10.1186/s12870-015-0701-4
RESEARCH ARTICLE
Open Access
Expression profiling of genes involved in
drought stress and leaf senescence in
juvenile barley
Gwendolin Wehner1,2, Christiane Balko1, Klaus Humbeck2,3, Eva Zyprian4 and Frank Ordon2,5*
Abstract
Background: Drought stress in juvenile stages of crop development and premature leaf senescence induced by
drought stress have an impact on biomass production and yield formation of barley (Hordeum vulgare L.). Therefore,
in order to get information of regulatory processes involved in the adaptation to drought stress and leaf senescence
expression analyses of candidate genes were conducted on a set of 156 barley genotypes in early developmental
stages, and expression quantitative trait loci (eQTL) were identified by a genome wide association study.
Results: Significant effects of genotype and treatment were detected for leaf colour measured at BBCH 25 as an
indicator of leaf senescence and for the expression level of the genes analysed. Furthermore, significant correlations
were detected within the group of genes involved in drought stress (r = 0.84) and those acting in leaf senescence
(r = 0.64), as well as between leaf senescence genes and the leaf colour (r = 0.34). Based on these expression data
and 3,212 polymorphic single nucleotide polymorphisms (SNP) with a minor allele frequency >5 % derived from the
Illumina 9 k iSelect SNP Chip, eight cis eQTL and seven trans eQTL were found. Out of these an eQTL located on
chromosome 3H at 142.1 cM is of special interest harbouring two drought stress genes (GAD3 and P5CS2) and one
leaf senescence gene (Contig7437), as well as an eQTL on chromosome 5H at 44.5 cM in which two genes (TRIUR3
and AVP1) were identified to be associated to drought stress tolerance in a previous study.
Conclusion: With respect to the expression of genes involved in drought stress and early leaf senescence, genotypic
differences exist in barley. Major eQTL for the expression of these genes are located on barley chromosome 3H and
5H. Respective markers may be used in future barley breeding programmes for improving tolerance to drought
stress and leaf senescence.
Keywords: Barley, Leaf senescence, Drought stress, High-throughput qPCR, Gene expression, eQTL
Background
In order to analyse genetic networks and stress response,
real time polymerase chain reaction (PCR) is an important
tool [1]. For several years high-throughput instruments e.g.
the BioMark System from Fluidigm have enabled large
scale quantitative PCR studies [2]. Because of this and the
possibility to analyse a large number of genotypes easily on
expression chips [2] a range of genome wide association
* Correspondence:
2
Interdisciplinary Center for Crop Plant Research (IZN), Hoher Weg 8, 06120
Halle, Germany
5
Julius Kühn-Institut (JKI), Federal Research Centre for Cultivated Plants,
Institute for Resistance Research and Stress Tolerance, Erwin-Baur-Str. 27,
06484 Quedlinburg, Germany
Full list of author information is available at the end of the article
studies (GWAS) using expression data were conducted
in the last years [3–5]. Expression quantitative trait
loci (eQTL) were detected first in medicinal studies in
humans and later also in plants [6–10]. In plants most
eQTL studies were performed for complex pathways
and aimed at a better understanding of the molecular
networks [11]. Whereas in biotic stress the resistance
is often controlled by a single gene, responses to abiotic
stresses such as drought stress are controlled by many
genes [12–14] and so these processes are particularly suitable for high throughput expression analyses and genetical
genomics approaches [15]. Even in early developmental
stages drought stress and drought stress induced premature leaf senescence have major influences on yield
formation [16]. Therefore, it is of prime importance
© 2016 Wehner et al. Open Access This article is distributed under the terms of the Creative Commons Attribution 4.0
International License ( which permits unrestricted use, distribution, and
reproduction in any medium, provided you give appropriate credit to the original author(s) and the source, provide a link to
the Creative Commons license, and indicate if changes were made. The Creative Commons Public Domain Dedication waiver
( applies to the data made available in this article, unless otherwise stated.
Wehner et al. BMC Plant Biology (2016) 16:3
to understand regulatory processes of drought stress
[17] and leaf senescence [18].
In plants drought stress is initiated by water deficit in
soil resulting in osmotic and oxidative stress and cellular
damage [19]. This leads to defined drought stress responses for instance regarding the maintenance of turgor
by an increase of osmoprotective molecules as soluble
sugars [20–22], as well as measurable lower water content
and decreased growth in the stressed plants compared to
a control [23, 24]. Stress perception is assigned by special
receptors, such as abscisic acid (ABA) receptors, hexokinases, or ion channel linked receptors [25]. The stress signal is then transducted for example via serine-threonine
kinases, serin-threonine phosphatases, calcium dependent
protein kinases, or phospholipases [25]. Finally, the gene
expression is regulated by effector genes coding for late
embryo abundant (LEA) proteins, dehydrin, or reactive
oxygen species (ROS) and transcription factors, such as
MYB, WRKY, NAC, AP2/ERF, DREB2, or bZIP to activate
stress responsive mechanisms, re-establish homeostasis
and protect and repair damaged proteins and membranes
[13, 19, 25, 26]. Besides the above mentioned genes,
drought stress associated metabolites such as osmoprotectants, polyamines and proteins involved in carbon metabolism and apoptosis are part of drought stress tolerance
[12, 27]. Disturbing the regulatory processes in drought
stress response results in irreversible changes of cellular
homeostasis and the destruction of functional and structural proteins and membranes, leading to cell death [19]
and decreased yield formation [28]. A huge transcriptome
analysis for drought stress associated genes was done for
example in barley [29] and wheat [30] showing differential
response of genes involved in drought stress tolerance.
Initiated by external signals e.g. various stresses such
as drought, as well as by internal factors for example
phytohormones leaf senescence often occurs as a natural
degradation process at the final stage of plant development [31]. Drought stress induced leaf senescence proceeds in three steps. Perception of drought stress is the
initiation phase in which senescence signals are transferred via senescence associated genes (SAG) [32]. These
are regulatory genes which often encode transcription
factors regulating gene expression by binding to distinct
cis-elements of target genes [33]. In the following reorganisation phase resources are transported from source
(e.g. roots, leaves) to sink (e.g. fruits, seed) organs being
important for yield formation [34]. With this translocation chlorophyll, proteins, lipids and other macromolecules are degraded and the content of antioxidants, ABA
and ROS increases induced by a change in gene expression [35, 36]. Differentially expressed genes and their
regulation during leaf senescence were identified by transcriptome analysis using microarrays in Arabidopsis thaliana [37, 38]. While the genes for photosynthesis and
Page 2 of 12
chloroplast development are down-regulated, the genes
for the degradation of macromolecules and recycling of
resources are up-regulated [39]. For example, expressed
genes for chlorophyll degradation are PA42, Lhcb4 and
psbA [40] and genes for N mobilization and transport are
transcription factors WRKY [41] and NAC [42] as well as
glutamine synthetase [38]. Genes differentially expressed
can be grouped to those accelerating leaf senescence and
genes delaying leaf senescence [43]. The latter possibly
resulting in a “stay green” effect and improved drought
tolerance [34, 44]. The reorganisation phase is the crucial
step for reversibility, after which senescence is irreversible
and leads to the final step where leaves and cells often
die [45].
In barley (Hordeum vulgare L.), a crop plant of worldwide importance, most mechanisms for leaf senescence
are still not well understood [18, 34]. The response to
drought in juvenile stages is less well documented, as
only few studies are focused on early developmental stages
[20, 24, 46, 47] whereas a lot of studies were conducted
for drought stress in the generative stage [48]. Nevertheless, barley is to some extent a model organism for research at a genome wide level. The barley gene space has
been published [49] and with this information gene
positions can be compared to these data. Comparing
the position of the analysed genes in the Morex genome with positions of the detected eQTL, resulted in
the co-localization of eQTL and genes involved in drought
stress [11, 50]. Therefore, the present study aimed at the
identification of eQTL in barley for genes involved in
drought stress in the juvenile phase and early leaf senescence (Table 1) based on a genome wide association
study.
Results
Leaf senescence
Leaf colour (SPAD, soil plant analysis development) measured at 20 days after drought stress induction (BBCH 25,
according to Stauss [51]) being indicative for leaf senescence revealed significant differences between treatments
and genotypes but no significant interaction of genotype
and treatment was observed at this stage (Fig. 1 and
Table 2) giving hint to physiological changes and changes
in gene expression.
Relative expression of candidate genes
At the same developmental stage (BBCH 25) expression
analyses were conducted for the whole set of 156 genotypes analysing 14 genes (Table 1). The relative expression
(-ΔΔCt) ranges from −8.5 to 14.9 (Fig. 2, Additional file
1). In most genotypes all five drought stress related genes
(A1, Dhn1, GAD3, NADP_ME and P5CS2) showed a
higher expression under stress treatment relative to the
control whereas for genes involved in leaf senescence
Wehner et al. BMC Plant Biology (2016) 16:3
Page 3 of 12
Table 1 Primer pairs for the selected genes and the reference gene
Drought stress
genes
Gene
Functional
annotation
Acc. No.
Primer (FOR and REV)
Ampl.
A1
ABA inducible
gene
GenBank:X78205.1
ACACGGCGCAGTACACCAAGGAGTCCCACCACGGCGTTCACCAC
100 bp
Dhn1
Dehydrin 1
GenBank:AF181451
GCAACAGATCAGCACACTTCCAGCTGACCCTGGTACTCCATTGT
141 bp
GAD3
Glutamate
decarboxylase 3
GenBank:AY187941
ATGGAGAACTGCCACGAGAAGGAGATCTCGAACTCGTCGT
147 bp
NADP_ME
NADP-dependent GenBank:XM_003569737 ATGGCGGGAAGATCAGGGATCCCTCAGCAGGGAATGC
malic enzyme-like
165 bp
P5CS2
Delta 1-pyrroline- GenBank:AK249154.1
5-carboxylate
synthase 2
GTATACATGCACGTGGACCCCAGAGGGTTTTCGCCGAATC
164 bp
GenBank:KF190467.1
GCTGAACGGCTGCCACTCCCGAAACCATCGCGCCTGTGGTG
78 bp
Leaf senescence Contig7437 SAG senescence
genes
associated gene
Genes out
of GWASa
GSII
Glutamine
synthetase 2
GenBank:X53580.1
ACGAGCGGAGGTTGACAGCGCCCCACACGAATAGAG
94 bp
hv_36467
SAG senescence
associated gene
GenBank:AK367894.1
CAGTCCTTTTGCGCAGTTTTCCCAAGCGAGAATGCCTTGTAA
152 bp
LHC1b20
Light-harvesting
complex I
GenBank:S68729.1
CTGACCAAGGCGGGGCTGATGAACTCGTGGGGCGGGAGGCTGTAG
200 bp
pHvNF-Y5α SAG senescence
associated gene
GenBank:AK370570
CATGAAGCGAGCTCGTGGAACAGGTGCGAAGGTGGGACTACTCTGA 126 bp
AVP1
Vacuolar
proton-inorganic
pyrophosphatase
GenBank:AY255181.1
GACCCTCTCAAGGACACCTCTCCCAACCGGCAAAACTAGA
160 bp
ETFQO
Electron transfer
flavoproteinubiquinone
oxidoreductase
GenBank:BT000373.1
CCACAACCCTTTCTTGAATCCGGATCTAAGGGCGTGGTGAATTT
160 bp
SAPK9
Serine/threonine
protein
GenBank:AB125310.1
TCATGCAAGACTGTTTCTTGGGTTTCTTCTTGGCACAAAGCATATT
149 bp
TRIUR3
Protein kinase
GenBank:M94726
ACATTGACGTTGAGAGCAGCGCTACAGAGAATTTGTGACCCA
151 bp
GenBank:DQ196027.1
CAATGCTAGCTGCACCACCAACTGCTAGCAGCCCTTCCACCTCTCCA 165 bp
HvGAPDH
Glyceraldehyde3-phosphate
dehydrogenase
a
Genes coding for proteins identified by BlastX of significant marker sequences out of a previous genome wide association study (GWAS) by Wehner et al. [20]
opposite effects were detected for all genes (GSII,
hv_36467, LHC1b20 and pHvNF-Y5α) except Contig7437.
The genes out of the GWAS [20], i.e. AVP1 and TRIUR3
which are drought stress related genes, were up-regulated,
whereas SAPK9 and ETFQO showed a lower expression
relative to the control. In total, eight genes were up
and six genes were down-regulated relative to the control but not all genotypes responded in the same way.
The mean quality score for all amplifications was 0.954.
Because ΔCt and ΔΔCt values were not normally distributed (data not shown) further statistical analysis was
done with logarithmic values (log2). Analysis of variance (ANOVA) revealed significant (p <0.001) effects
for genotype and treatment for the 14 genes except
Contig7437 (Table 2).
Highest significant correlations for differences in gene
expression were identified within groups, i.e. within the
group of drought stress genes, leaf senescence genes and
genes out of GWAS (Table 3). The highest correlation
was observed for the group of drought stress genes between relative expression of GAD3 and P5CS2 (r = 0.84),
for the group of leaf senescence genes for GSII and
pHvNF-Y5a (r = 0.64), and for the genes out of GWAS
between AVP1 and TRIUR3 (r = 0.54). For no gene the
differential expression was significantly correlated to the
expression differences of all other genes, but ETFQO was
correlated to all except Dhn1, and GAD3 and Contig7437
were correlated to all except GSII and AVP1, and SAPK9
and NADP_ME, respectively. Significant correlations were
also detected between the relative SPAD values for change
in leaf colour and all leaf senescence genes except
hv_36467 with the highest coefficients of correlation for
GSII (r = 0.24) and pHvNF-Y5a (r = 0.34). Moreover, significant correlations were observed for relative SPAD
Wehner et al. BMC Plant Biology (2016) 16:3
Page 4 of 12
Table 2 Analysis of variance for leaf colour (SPAD) and the
expression of the selected genes
Trait/Gene
Drought stress
genes
Effect of treatment
Effect of genotype
F value
p value
F value
p value
SPAD
11.2
0.0009
6.6
<2E-16
A1
50.1
4.88E-12
8.8
<2E-16
Dhn1
138.4
<2E-16
23.5
<2E-16
GAD3
81.8
<2E-16
96.7
<2E-16
NADP_ME
315.5
<2E-16
4.1
4.63E-09
P5CS2
229.6
<2E-16
335.4
<2E-16
0.342
128.7
<2E-16
<2E-16
65.1
<2E-16
Leaf senescence Contig7437 0.9
genes
GSII
175.4
Genes out of
GWASa
hv_36467
160.2
<2E-16
46.9
<2E-16
LHC1b20
102.4
<2E-16
156.7
<2E-16
pHvNF-Y5α
76.5
<2E-16
196.4
<2E-16
AVP1
51.4
2.06E-12
37.9
<2E-16
ETFQO
16.3
5.98E-05
41.3
<2E-16
SAPK9
9.0
0.00312
5.8
2.88E-07
TRIUR3
96.5
<2E-16
38.1
<2E-16
a
Genes coding for proteins identified by BlastX of significant marker
sequences out of a previous genome wide association study (GWAS) by
Wehner et al. [20]
Fig. 1 Box whisker plots for status of leaf senescence. Leaf colour
(SPAD) for control and drought stress treatment at 27 days after
sowing (das) including all 156 analysed barley genotypes
values to two genes out of GWAS (r = 0.16 for AVP1 and
r = 0.15 for TRIUR3).
Genome wide association study
Significant (p <0.001) marker gene expression associations were detected on all barley chromosomes except
4H with the highest number on chromosome 5H (8
single nucleotide polymorphisms, SNP) (Table 4). The
largest transcriptional variance was explained by the
marker SCRI_RS_181376 associated to the expression
of ETFQO (R2 = 11.55 %) and the highest likelihood of
odds (LOD) was observed for the marker SCRI_RS_161614
associated to the expression of TRIUR3 (LOD = 3.82) on
barley chromosome 5H. Five SNP were significantly associated to the relative expression of the genes for drought
stress, six to those for leaf senescence and seven to the
genes out of the previous GWAS. Within the group of
drought stress genes, expression differences of three genes
(A1, GAD3 and P5CS2) and within the group of leaf senescence genes expression differences of four genes (Contig7437, GSII, hv_36467 and pHvNF-Y5α) were associated
to markers. Out of these, three were located on chromosome 3H at 142.1 cM. This eQTL was detected for the
relative expression of two drought stress genes (GAD3 and
P5CS2) and one leaf senescence gene (Contig7437) which
were also highly and significantly correlated (Table 3). Furthermore, an eQTL was observed for the relative expression of A1 on chromosome 5H at 149.9 cM associated to
two markers. Associations for the relative expression of
three genes (AVP1, ETFQO and TRIUR3) out of the four
GWAS genes were detected on barley chromosomes 3H
and 5H. For the expression of TRIUR3 three markers were
found on 5H at 44.5 cM, and the expression of AVP1 was
associated to a marker on chromosome 5H at 62.5 cM.
The five SNP significantly associated to the relative
expression of drought stress genes and the seven markers
associated to genes out of GWAS all marked cis eQTL,
while two trans eQTL were detected for P5CS2 and AVP1
(Table 5). In contrast, for the six markers significantly
associated to leaf senescence genes only one cis eQTL was
observed for pHvNF-Y5α. In summary, seven trans eQTL
were detected and eight cis eQTL for which the Morex
contigs showed a high identity to the gene analysed.
Furthermore, cis eQTL explained a higher transcriptional
variance (R2) than those in trans (Table 4 and Table 5).
Discussion
Drought stress and leaf senescence genes
As shown by the significantly decreased SPAD values at
27 days after sowing (das, BBCH 25), drought stress had
Wehner et al. BMC Plant Biology (2016) 16:3
Page 5 of 12
Fig. 2 Expression profile for drought stress and leaf senescence genes. Relative Expression (-ΔΔCt) for the selected genes at 26 days after sowing
(das) shown in box whisker plots including all 156 analysed barley genotypes
an accelerating influence on natural leaf senescence in
barley (Fig. 1 and Table 2). Furthermore, the drought
stress answer in this juvenile stage was observed by
differential expression of 14 genes induced by drought
stress or leaf senescence (Table 1, Fig. 2).
A1 is a gene which is induced by ABA or abiotic
stresses like drought, cold and heat [19, 52, 53]. In the
present study expression under drought stress was higher
than in the well watered treatment (Fig. 2). This was also
shown by several studies first in barley [53] and other
species including transgenics [54–57]. Dehydrins (Dhn)
are well known to be expressed under dehydration stress
[58]. For instance Dhn1 is described to be up-regulated
under drought stress in barley [59, 60] which was also
found in this study (Fig. 2). The glutamate decarboxylase
gene (GAD3) is regulated by calcium and the protein
encoded by this gene catalyzes the reaction of glutamate
to γ-aminobutyric acid (GABA) [61, 62]. GABA may be
involved in drought stress [63] by up-regulation of genes
encoding a GABA receptor [29] which was also shown in
the present study (Fig. 2). The NADP-dependent malic
enzyme-like (NADP_ME) is involved in lignin biosynthesis, and regulates cytosolic pH through balancing the
synthesis and degradation of malate [64]. As described
in a drought stress study on barley, this effect is used
for control of stomatal closure during the day under
water-deficit conditions [29]. Comparable to the present
study (Fig. 2) the gene for NADP_ME turned out to be
higher expressed under drought stress [29]. The delta 1pyrroline-5-carboxylate synthase 2 gene (P5CS2) is included in proline synthesis [65]. Content of proline is still
controversially discussed as an indicator for drought tolerance [66], but it was shown in a previous study that the
proline content increased under drought stress [20]. For
approving its role, this gene was selected and showed upregulation under drought stress (Fig. 2). Up-regulation
under drought stress was also observed in tobacco [67]
and transgenic rice [68].
The Contig7437 is a senescence associated gene (SAG)
which is up-regulated under drought stress, as also shown
by Guo et al. [29] in barley for drought stress during the
reproductive stage. Other analysed SAGs are hv_36467
and pHvNF-Y5α, which were down-regulated in most
genotypes under drought stress in our study (Fig. 2)
whereas in literature reverse effects are described. The
gene hv_36467 is a SAG12 like gene which is a senescence
associated cystein protease and turned out to be upregulated during natural leaf senescence in barley [69] and
during dark induced senescence in tobacco [70]. In Arabidopsis thaliana the gene NFYA5 similar to pHvNF-Y5α
was analysed by microarrays showing that the expression
of this gene was induced by drought stress and ABA treatments [71], as well as under nitrogen stress [72]. Our data
indicate a specific regulation of these two genes under
different conditions. The protein encoded by the glutamine synthetase 2 (GSII) gene was found in photosynthetic
tissues where its main role is the re-assimilation of photorespiratory ammonia [73, 74]. During senescence, the
activity of GSII decreased representing down-regulation of
associated genes in rice [73], barley and wheat [75] which
was confirmed in the present study (Fig. 2). With chlorophyll degradation during leaf senescence the light harvesting complexes (LHC) of PSI and PSII remain stable, but
synthesis rates of apoproteins of LHC decrease early in
senescence [76]. In the present study LHC1b20 was
down-regulated for most genotypes during drought stress
Rel. SPAD
Drought stress genes
A1
Dhn1
GAD3
NADP_ME
P5CS2
Leaf senescence genes
Contig7437
GSII
hv_36467
LHC1b20
A1
Dhn1
GAD3
NADP_ME
P5CS2
Contig7437
GSII
hv_36467
0.09
0.02
−0.10
0.01
0
−0.16*
0.24**
−0.13
0.19*
0.34***
0.68***
0.68***
0.44***
0.76***
0.38***
0.15
0.10
−0.16
−0.12
0.73***
0.35**
0.72***
0.64***
0.08
0.26**
−0.17*
−0.11
0.43***
0.84***
0.65***
0
0.17*
−0.31***
−0.28***
0.49***
LHC1b20
pHvNF-Y5α
ETFQO
SAPK9
TRIUR3
0.16*
0.09
−0.15
0.15*
0.14
0.18*
0.37**
−0.11
0.12
0.15
0.30*
−0.18*
0.09
0.20*
0.34**
−0.34***
0.15
0.29*
0.15
−0.01
0.10
0.27*
0.24*
0.22
0.25*
0.50***
0.17*
0.13
−0.19*
−0.09
0.10
0.18*
0.40**
−0.18*
−0.17*
0.45***
−0.24**
−0.35***
0.18*
0.16*
0.21
−0.25**
0.09
0.55***
0.64***
0.47***
0.53***
0.18
0.44***
0.19*
−0.09
0.15
0.30***
0.03
0.01
0.49***
0.38***
0.39***
0.10
0.39*
pHvNF-Y5α
Genes out of GWASa
AVP1
AVP1
ETFQO
SAPK9
0.42***
0.28***
−0.26*
0.41***
0.46***
0.22
0.54***
0.17*
Wehner et al. BMC Plant Biology (2016) 16:3
Table 3 Coefficients of correlation for relative expression of the selected genes and the relative SPAD values
0.35*
0.06
r is significant with *p <0.05, **p <0.01 and ***p <0.001
a
Genes coding for proteins identified by BlastX of significant marker sequences out of a previous genome wide association study (GWAS) by Wehner et al. [20]
Page 6 of 12
Wehner et al. BMC Plant Biology (2016) 16:3
Page 7 of 12
Table 4 Significant marker gene expression associations (p <0.001) with positions of eQTL
Drought stress genes
Leaf senescence genes
Genes out of GWASa
Gene (log ΔΔCt)
Markerb
Chr.b
Pos. in cMb
F value
p value
-log p (LOD)
R2 in %
A1
SCRI_RS_134358
5H
149.9
7.45
8.86E-04
3.05
9.5
A1
SCRI_RS_165400
5H
150.1
7.45
8.86E-04
3.05
9.5
GAD3
BOPA2_12_31177
1H
38.0
7.81
6.03E-04
3.22
8.9
GAD3
BOPA1_4403-885
3H
142.1
12.09
6.67E-04
3.18
6.9
P5CS2
BOPA1_4403-885
3H
142.1
11.31
9.84E-04
3.40
7.5
Contig7437
BOPA1_4403-885
3H
142.1
7.36
9.05E-04
3.01
7.1
GSII
BOPA2_12_30065
7H
40.4
11.36
9.60E-04
3.04
9.5
hv_36467
BOPA1_6547-1363
1H
111.8
8.11
4.58E-04
3.02
7.9
hv_36467
BOPA2_12_31461
2H
131.9
13.14
4.00E-04
3.34
11.2
pHvNF-Y5a
SCRI_RS_152393
6H
64.4
11.48
9.09E-04
3.04
7.8
pHvNF-Y5a
SCRI_RS_194841
7H
81.5
12.91
4.49E-04
3.35
8.7
AVP1
SCRI_RS_140294
5H
62.5
13.46
3.42E-04
3.47
9.1
ETFQO
BOPA1_10126-999
3H
53.3
7.44
8.37E-04
3.08
10.1
ETFQO
SCRI_RS_181376
5H
143.1
8.34
3.86E-04
3.41
11.5
TRIUR3
BOPA1_4392-450
5H
44.5
7.64
7.07E-04
3.15
9.9
TRIUR3
BOPA2_12_30717
5H
44.5
7.64
7.07E-04
3.15
9.9
TRIUR3
SCRI_RS_41519
5H
44.5
7.64
7.07E-04
3.15
9.9
TRIUR3
SCRI_RS_161614
5H
139.7
15.17
1.51E-04
3.82
9.8
a
Genes coding for proteins identified by BlastX of significant marker sequences out of a previous genome wide association study (GWAS) by Wehner et al. [20]
Marker positions are based on Comadran et al. [101]
b
Table 5 Positions of the selected genes based on the barley Morex-contigs and their mode of action
Gene
Drought stress genes
Leaf senescence genes
a
Genes out of GWAS
a
POPSEQb,c
Chr.b
cMb
Identity in %c
eQTLd
A1
morex_contig_38178
5H
156.9
76
cis
GAD3
morex_contig_790741
1H
42.0
81
cis
GAD3
morex_contig_135241
3H
147.0
75
cis
P5CS2
morex_contig_2549060
3H
30.2
76
trans
Contig7437
morex_contig_47765
4H
54.3
94
trans
GSII
morex_contig_274546
7H
70.8
92
trans
hv_36467
morex_contig_138818
1H
132.4
91
trans
hv_36467
morex_contig_458133
2H
58.0
81
trans
pHvNF-Y5a
morex_contig_244610
6H
76.0
100
trans
pHvNF-Y5a
morex_contig_60611
7H
70.8
95
cis
AVP1
morex_contig_80803
5H
44.1
75
trans
ETFQO
morex_contig_6218
3H
51.8
95
cis
ETFQO
morex_contig_1570014
5H
152.4
100
cis
TRIUR3
morex_contig_81592
5H
42.0
88
cis
TRIUR3
morex_contig_160473
5H
129.9
71
cis
Genes coding for proteins identified by BlastX of significant marker sequences out of a previous genome wide association study (GWAS) by Wehner et al. [20]
b
Gene positions are based on POPSEQ map (ibsc 2012)
c
Morex contigs and identity comes out Blastn of the gene sequences against the Morex genome (ibsc 2012)
d
cis eQTL coincide with the location of the underlying gene (position <10 cM), whereas trans eQTL are located in other regions of the genome Druka et al. [11]
Wehner et al. BMC Plant Biology (2016) 16:3
induced leaf senescence in juvenile barley (Fig. 2) which
was also shown in rice [77] and barley [78, 79] for natural
leaf senescence in the generative stage.
In this study, all five selected drought stress genes
were up-regulated under drought stress (Fig. 2) according
to literature which demonstrates a clear drought stress
answer and a good experimental setup for detecting and
analysing drought stress response. In contrast, four out of
the five selected genes for leaf senescence were downregulated (Fig. 2) because a few of these genes are involved
in photosynthesis and chloroplast development. Results
for three of these genes (Contig7437, GSII and LHC1b20)
were in accordance with results known from literature,
while this was not the case for two of them (hv_36467 and
pHvNF-Y5α). However, for all of these genes the adverse
effect was detected for some genotypes (Fig. 2). Results
revealed that drought stress in early developmental stages
of barley leads to premature induced leaf senescence as
already observed by physiological parameters [20] and by
expression analysis of drought stress and leaf senescence
related genes in this study.
Expression differences in three genes (GAD3, P5CS2
and Contig7437) were significantly associated to barley
chromosome 3H at 142.1 cM (Table 4). At this position
also quantitative trait loci (QTL) were found for drought
stress [20, 80] as well as for leaf senescence [81]. These
facts and the high correlation of these genes (Table 3)
make this eQTL very interesting for marker assisted
breeding in barley.
Genes out of GWAS
To verify the QTL identified for drought stress and
drought stress induced leaf senescence by Wehner et al.
[20] an expression profile and eQTL analysis was conducted with genes coding for proteins identified within
respective QTL. The genes ETFQO, SAPK9, TRIUR3 and
AVP1 were differentially expressed (Fig. 2).
The protein encoded by the electron transfer flavoproteinubiquinone oxidoreductase gene (ETFQO) is located in
the mitochondria where it accepts electrons from ETF,
transfers them to ubiquinone and acts downstream in the
degradation of chlorophyll during leaf senescence [82, 83].
Expression studies showed that ETFQO is up-regulated
under darkness induced leaf senescence [83, 84] whereas
in this study on drought stress induced leaf senescence
no clear direction was observed (Fig. 2). A gene coding
for a serine/threonine-protein kinase (SAPK9) was analysed which can be activated by hyperosmotic stress and
ABA in rice [85]. In the present study SAPK9 was downregulated in most genotypes (Fig. 2). Furthermore, the
abscisic acid-inducible protein kinase gene (TRIUR3)
which is also involved in dehydration stress response [86]
was differentially expressed. Until now, no relative expression analysis has been conducted for this gene, but a huge
Page 8 of 12
amount of ABA inducible genes are up-regulated under
drought stress in rice [87]. In the present study TRIUR3
was also up-regulated under drought stress (Fig. 2). The nucleotide pyrophosphatase/phosphodiesterase gene (AVP1)
is a gene which is up-regulated under drought stress [88]
which was confirmed in the current study (Fig. 2). Expression of this gene was also observed in transgenics showing
a higher drought stress tolerance [89–92].
Three of these genes (SAPK9, TRIUR3 and AVP1) were
located within the QTL on barley chromosome 5H at
45 cM [20]. Furthermore, expression differences of two of
them (TRIUR3 and AVP1) were again associated to
markers on chromosome 5H around 45 cM (Table 4) and
this position was also validated in the Morex genome
(Table 5). A high and significant correlation between the
relative expression data of both genes as well as to the
relative SPAD values (Table 3) promotes this finding. At
the same position on chromosome 5H two markers which
turned out to be significantly associated to SPAD and
biomass yield under drought stress treatment were identified [20]. So, these results [20] and those of this study give
hint that the two SNP markers, i.e. BOPA1_9766-787 and
SCRI_RS_102075 may be used in marker based selection
procedures in barley breeding programmes aiming at the
improvement of drought stress tolerance.
For the understanding of complex mechanisms, such as
the process of drought stress tolerance and drought stress
induced leaf senescence as a basis for future breeding activities it is of prime importance to understand how and when
regulatory genes are activated and where they are located in
the barley genome. Results of this study contribute to
elucidate the regulation of drought stress induced leaf
senescence during early developmental stages in barley.
The present genetical genomics approach helps to localize
and understand transcriptional regulation and gene interaction, both from cis-acting elements and trans-acting factors (Table 5). When analysing the expression regulation of
the barley genome, cis eQTL were found for the genes A1,
GAD3, pHvNF-Y5α, ETFQO and TRIUR3. Markers which
were significantly associated to cis eQTL explained up to
11.55 % of the transcriptional variance (Table 4 and Table 5).
Therefore, most of the strongest eQTL acted in cis which
was also observed in previous eQTL studies [8, 93, 94].
Factors that act in trans regulating the expression
levels of the genes of interest were mainly found for the
group of leaf senescence genes. Some of these genes are
described as SAGs (Contig7437, hv_36467 and pHvNFY5α), because up to now little is known about their
function. Results of the present study give hint that these
SAGs are regulated in trans.
Conclusion
With respect to the expression of genes involved in
drought stress response and early leaf senescence
Wehner et al. BMC Plant Biology (2016) 16:3
genotypic differences exist in barley. Major eQTL for the
expression of these genes are located on barley chromosome 3H and 5H. The eQTL on chromosome 5H coincides
with the QTL for drought stress induced leaf senescence
identified in a previous GWAS [43]. Respective markers,
i.e. BOPA1_9766-787 and SCRI_RS_102075 may be used in
future barley breeding programmes for improving tolerance
to drought stress and early leaf senescence, respectively.
Page 9 of 12
solution RP and following the manufacturer’s instructions. After incubation for 15 min at room temperature,
an additional incubation for 3 min at 55 °C was conducted to get a higher RNA yield. Total RNA yield was
measured by Qubit fluorometric quantification (Life technologies) and concentration was adjusted to 50 ng. RNA
was used for cDNA synthesis with the QuantiTect Reverse
Transcription Kit (Qiagen) following the manufacturer’s
instructions. cDNA was stored at −20 °C.
Methods
Plant material and phenotypic characterisation
Phenotyping, genotyping and QTL analysis were conducted as described in Wehner et al. [20] on a set of 156
winter barley genotypes consisting of 113 German winter
barley cultivars (49 two-rowed and 64 six-rowed, [95])
and 43 accessions of the spanish barley core collection
(SBCC) [96]. The same set of genotypes as well as the
same experimental design was used for expression- and
eQTL analysis in the present study. In brief, trials were
conducted in greenhouses of the Julius Kühn-Institut in
Groß Lüsewitz, Germany and drought stress was applied
in a split plot design with three replications per genotype
and treatment (control, drought stress). In each pot four
plants were sown and all leaves were tied up, except the
primary leaf per plant. Drought stress was induced by a
termination of watering at the primary leaf stage (BBCH
10, according to Stauss [51]) seven days after sowing (das).
From this time drought stress developed slowly till 20 das
when the final drought stress level was reached. The
drought stress variant was kept at 20 % of the maximal
soil water capacity and the control variant at 70 % by
weighing the pots resulting in a relative water content (36
das) ranging between 88.8 % and 91.5 % in the control
variant and 80.9 % and 86.1 % in the drought stress treatment. The experimental setup and growth conditions for
these pot experiment are described in detail as design B in
Wehner et al. [20].
At 26 das (BBCH 25) leaf material for RNA extraction
was sampled by harvesting one primary leaf per pot taking
the middle part for further analyses. Mixed samples out of
the three leaf pieces (circa 100 mg) per genotype and
treatment (312 samples) each were immediately frozen in
liquid nitrogen and stored at −80 °C. Furthermore, to get
information on the influence of drought stress on leaf
senescence leaf colour (SPAD, Konica Minolta Chlorophyll Meter SPAD-502 Plus, Osaka Japan) was measured
27 das on three primary leaves per pot at five positions
each.
RNA isolation and cDNA synthesis
The frozen primary leaves were homogenized with a
tube pestle (Biozym) in liquid nitrogen. Total RNA from
the primary leaves was isolated with the InviTrap Spin
Plant RNA Mini Kit (STRATEC Molecular), using lysis
Expression analysis using quantitative real-time PCR
(qPCR)
A high throughput system (BioMark) was used for expression analysis in which four Fluidigm chips (96.96) were
analysed for the 312 samples. Default space on these chips
allows to analyse 48 genes in two technical replications.
Out of these 48 analysed genes (23 genes involved in
drought stress, 12 leaf senescence genes, 11 genes coding
for proteins out of a previous GWAS [20] and two reference genes), 14 differentially expressed genes revealing
clear differences between genotypes and showing a low
number of missing values were selected for the present
study. Five of these genes were involved in leaf senescence,
five in drought stress response and four genes coding for
proteins related to leaf senescence or drought stress out of
the previous genome wide association study [20] were
chosen. In addition, as a reference gene GAPDH was
included (Table 1). To identify the gene for those proteins
identified in the GWAS studies by Wehner et al. [20] the
significant associated marker sequences were compared
to the plant nucleotide collection by Blastn (Basic Local
Alignment Search Tool, ncbi [www.ncbi.nlm.nih.gov]
accessed June 2014) and the gene with the best hit was
chosen for primer design.
Primers (Eurofins HPSF purified) were constructed
using the primer designing tool of NCBI ([www.ncbi.nlm.
nih.gov/tools/primer-blast] accessed June 2014) with a
length of 20 bp, annealing temperature of 59 °C and product size of 100–200 bp (Table 1).
qPCR was performed using the high throughput platform BioMark HD System and the 96.96 Dynamic Array
IFC (Fluidigm) following the manufacturer’s instructions.
5 μl Fluidigm sample premix consisted of 1.25 μl preamplified cDNA, 0.25 μl of 20x DNA binding dye sample
loading reagent (Fluidigm), 2.5 μl of SsoFast EvaGreen
Supermix with low ROX (BioRad) and 1 μl of RNase/
DNase-free water. Each 5 μl assay premix consisted of 2 μl
of 100 μM primers, 2.5 μl assay loading reagent (Fluidigm)
and 0.5 μl RNase/DNase-free water. Thermal conditions
for qPCR were: 95 °C for 60 s, 30 cycles of 96 °C for 5 s,
60 °C for 20 s plus melting curve analysis. Data were processed using BioMark Real-Time PCR Analysis Software
3.0.2 (Fluidigm). The quality threshold was set at the
Wehner et al. BMC Plant Biology (2016) 16:3
default setting of 0.65 and linear baseline correction and
automatic cycle threshold method were used.
Data analysis
The analysis software (Fluidigm Real- Time PCR Analysis
Software) gave cycle threshold (Ct) values and calculated
ΔCt values, as well as a quality score for each amplification. Out of these ΔCt values calculated out of the Ct
value of the gene of interest minus the Ct value of the
housekeeping gene (GAPDH) for each genotype, treatment and replication, the relative expression (ΔΔCt) was
calculated out of the ΔCt values for stress treatment
minus the ΔCt values for control treatment for each genotype and replication [97]. ΔΔCt values without correction
of PCR efficiency were used for calculation, because genes
were tested and selected by their efficiency in preliminary
experiments. A mean PCR efficiency (Quality Score of
Fluidigm) was calculated for all amplifications.
Shapiro-Wilk test for normal distribution and analysis
of variance (ANOVA) using a linear model were carried
out using R 2.15.1 [98] to test effects of genotype (using
ΔΔCt values) and treatment (using ΔCt values). Furthermore, coefficients of correlation (Spearman) were calculated in R between relative expression of the genes and
the relative SPAD values [20, 99]. Moreover, for the SPAD
values an ANOVA mixed linear model (MLM) was
calculated (replication as random) in R to test effects
of genotype, treatment and interaction of genotype
and treatment. For relative expression as well as for the
SPAD values box whisker plots were calculated in R.
Expression quantitative trait loci (eQTL) analysis
For the 14 selected genes a genome wide association study
(GWAS) for eQTL detection was conducted on the 156
genotypes applying a mixed linear model (MLM) using
TASSEL 3.0 [100]. For this purpose a genetic map with
3,212 polymorphic SNP markers with minor allele frequencies larger than 5 % [101], a population structure
calculated with STRUCTURE 2.3.4 [102] based on 51 simple sequence repeat (SSR) markers covering the whole
genome, a kinship calculated with SPAGeDi 1.3d [103]
based on 51 SSRs and the relative expression data (means
for replications) were used. For comparability the methods
were the same as used for GWAS in Wehner et al. [20].
All results with p values <0.001 (likelihood of odds,
LOD = 3) were considered as significant marker gene
expression associations.
To compare genomic positions of the eQTL with
those of the analysed genes, sequences of the genes were
compared against high confidential genes (CDS sequences) of the barley Morex genome by Blastn (Basic
Local Alignment Search Tool, IPK Barley Blast server
[ />accessed May 2015) and the Morex contig with the
Page 10 of 12
highest identity on the associated linkage group (chromosome) was chosen. With this information eQTL were
divided in cis and trans eQTL. cis eQTL coincide with the
location of the underlying gene (position <10 cM),
whereas trans eQTL are located in other regions of the
genome [11].
Additional file
Additional file 1: Relative expression of the 14 genes with mean
quality scores for each amplification. aSBCC: spanish barley core
collection. bGWAS: genome wide association study. (XLSX 111 kb)
Abbreviations
ΔΔCt: relative expression; ABA: abscisic acid; Blast: Basic Local Alignment
Search Tool; Ct: cycle threshold; das: days after sowing; e.g: for example;
eQTL: expression quantitative trait locus/loci; GWAS: genome wide
association study; i.e: id est; LEA: late embryogenesis abundant protein;
LOD: likelihood of odds; MLM: mixed linear model; PCR: polymerase chain
reaction; qPCR: quantitative real-time polymerase chain reaction;
QTL: quantitative trait locus/loci; ROS: reactive oxygen species;
SAG: senescence associated genes; SBCC: Spanish Barley Core Collection;
SNP: single nucleotide polymorphism; SPAD: soil plant analysis development;
measurement of chlorophyll content by colour; SSR: single sequence repeat.
Competing interests
The authors declare that they have no competing interests.
Authors’ contributions
GW conducted all experiments, including expression, statistical and
bioinformatics analyses and mainly wrote the manuscript. EZ provided the
Fluidigm BioMark System and supervised the gene expression experiments.
CB, KH and FO designed the research, supervised the experimental design
and participated in writing the manuscript. All authors approved the final
manuscript.
Acknowledgements
The authors thank Dr. Brigitte Ruge-Wehling for the lab facilities for RNA
isolation, Dr. Ernesto Igartua CSIC, Spain for providing seeds of the SBCC, the
Interdisciplinary Center for Crop Plant Research (IZN) of the Martin-LutherUniversity of Halle-Wittenberg for funding this project and Prof. Dr. Klaus Pillen
for close collaboration.
Author details
1
Julius Kühn-Institut (JKI), Federal Research Centre for Cultivated Plants,
Institute for Resistance Research and Stress Tolerance, Rudolf-Schick-Platz 3,
18190 Sanitz, Germany. 2Interdisciplinary Center for Crop Plant Research
(IZN), Hoher Weg 8, 06120 Halle, Germany. 3Martin-Luther-University
Halle-Wittenberg, Institute of Biology, Weinbergweg 10, 06120 Halle,
Germany. 4Julius Kühn-Institut (JKI), Federal Research Centre for Cultivated
Plants, Institute for Grapevine Breeding, Geilweilerhof, 76833 Siebeldingen,
Germany. 5Julius Kühn-Institut (JKI), Federal Research Centre for Cultivated
Plants, Institute for Resistance Research and Stress Tolerance, Erwin-Baur-Str.
27, 06484 Quedlinburg, Germany.
Received: 28 July 2015 Accepted: 22 December 2015
References
1. Korenková V, Scott J, Novosadová V, Jindřichová M, Langerová L, Švec D,
et al. Pre-amplification in the context of high-throughput qPCR gene
expression experiment. BMC Mol Biol. 2015;16(1):5.
2. Spurgeon SL, Jones RC, Ramakrishnan R. High throughput gene expression
measurement with real time PCR in a microfluidic dynamic array. PLoS One.
2008;3(2), e1662.
3. Gilad Y, Rifkin SA, Pritchard JK. Revealing the architecture of gene
regulation: the promise of eQTL studies. Trends Genet. 2008;24(8):408–15.
Wehner et al. BMC Plant Biology (2016) 16:3
4.
5.
6.
7.
8.
9.
10.
11.
12.
13.
14.
15.
16.
17.
18.
19.
20.
21.
22.
23.
24.
25.
26.
27.
28.
29.
30.
Hansen BG, Halkier BA, Kliebenstein DJ. Identifying the molecular basis of
QTLs: eQTLs add a new dimension. Trends Plant Sci. 2008;13(2):72–7.
Westra H-J, Franke L. From genome to function by studying eQTLs. Biochim
Biophys Acta. 2014;1842(10):1896–902.
Gibson G, Weir B. The quantitative genetics of transcription. Trends Genet.
2005;21(11):616–23.
Potokina E, Prasad M, Malysheva L, Röder M, Graner A. Expression genetics
and haplotype analysis reveal cis regulation of serine carboxypeptidase I
(Cxp1), a candidate gene for malting quality in barley (Hordeum vulgare L.).
Funct Integr Genomics. 2006;6(1):25–35.
West MA, Kim K, Kliebenstein DJ, van Leeuwen H, Michelmore RW, Doerge
R, et al. Global eQTL mapping reveals the complex genetic architecture of
transcript-level variation in Arabidopsis. Genetics. 2007;175(3):1441–50.
Drost DR, Puranik S, Novaes E, Novaes CR, Dervinis C, Gailing O, et al.
Genetical genomics of Populus leaf shape variation. BMC Plant Biol.
2015;15(1):166.
Liu P, Wang CM, Li L, Sun F, Yue GH. Mapping QTLs for oil traits and eQTLs
for oleosin genes in jatropha. BMC Plant Biol. 2011;11(1):132.
Druka A, Potokina E, Luo Z, Jiang N, Chen X, Kearsey M, et al. Expression
quantitative trait loci analysis in plants. Plant Biotechnol J. 2010;8(1):10–27.
Vinocur B, Altman A. Recent advances in engineering plant tolerance to
abiotic stress: achievements and limitations. Curr Opin Biotechnol.
2005;16(2):123–32.
Beck EH, Fettig S, Knake C, Hartig K, Bhattarai T. Specific and unspecific
responses of plants to cold and drought stress. J Biosci. 2007;32(3):501–10.
Anjum SA, Xie X-y, Wang L-c, Saleem MF, Man C, Lei W. Morphological,
physiological and biochemical responses of plants to drought stress. African
J Agri Res. 2011;6(9):2026–32.
Sreenivasulu N, Sopory S, Kishor PK. Deciphering the regulatory mechanisms of
abiotic stress tolerance in plants by genomic approaches. Gene. 2007;388(1):1–13.
El Hafid R, Smith DH, Karrou M, Samir K. Physiological responses of spring
durum wheat cultivars to early-season drought in a Mediterranean
environment. Ann Bot-London. 1998;81(2):363–70.
Cattivelli L, Rizza F, Badeck F-W, Mazzucotelli E, Mastrangelo AM, Francia E,
et al. Drought tolerance improvement in crop plants: An integrated view
from breeding to genomics. Field Crop Res. 2008;105(1-2):1–14.
Buchanan-Wollaston V, Earl HJ, Harrison E, Mathas E, Navabpour S, Page T,
et al. The molecular analysis of leaf senescence – a genomics approach.
Plant Biotechnol J. 2003;1:3–22.
Wang W, Vinocur B, Altman A. Plant responses to drought, salinity and
extreme temperatures: towards genetic engineering for stress tolerance.
Planta. 2003;218(1):1–14.
Wehner G, Balko C, Enders M, Humbeck K, Ordon F. Identification of
genomic regions involved in tolerance to drought stress and drought stress
induced leaf senescence in juvenile barley. BMC Plant Biol. 2015;15(1):125.
Blum A. Osmotic adjustment and growth of barley genotypes under
drought stress. Crop Sci. 1989;29:230–3.
Teulat B, Borries C, This D. New QTLs identified for plant water status,
water-soluble carbohydrate and osmotic adjustment in a barley
population grown in a growth-chamber under two water regimes.
Theor Appl Genet. 2001;103(1):161–70.
Jamieson PD, Martin RJ, Francis GS, Wilson DR. Drought effects on
biomass production and radiation-use efficiency in barley. Field Crop
Res. 1995;43:77–86.
Honsdorf N, March TJ, Hecht A, Eglinton J, Pillen K. Evaluation of juvenile
drought stress tolerance and genotyping by sequencing with wild barley
introgression lines. Mol Breeding. 2014;34(3):1475–95.
Bhargava S, Sawant K. Drought stress adaptation: metabolic adjustment and
regulation of gene expression. Plant Breeding. 2013;132(1):21–32.
Ahuja I, de Vos RC, Bones AM, Hall RD. Plant molecular stress responses face
climate change. Trends Plant Sci. 2010;15(12):664–74.
Shinozaki K, Yamaguchi-Shinozaki K. Gene networks involved in drought
stress response and tolerance. J Exp Bot. 2007;58(2):221–7.
Farooq M, Wahid A, Kobayashi N, Fujita D, Basra SMA. Plant drought stress:
effects, mechanisms and management. Agron Sust Dev. 2009;29(1):185–212.
Guo P, Baum M, Grando S, Ceccarelli S, Bai G, Li R, et al. Differentially
expressed genes between drought-tolerant and drought-sensitive barley
genotypes in response to drought stress during the reproductive stage.
J Exp Bot. 2009;60(12):3531–44.
Aprile A, Mastrangelo AM, De Leonardis AM, Galiba G, Roncaglia E,
Ferrari F, et al. Transcriptional profiling in response to terminal drought
Page 11 of 12
31.
32.
33.
34.
35.
36.
37.
38.
39.
40.
41.
42.
43.
44.
45.
46.
47.
48.
49.
50.
51.
52.
53.
54.
55.
56.
stress reveals differential responses along the wheat genome. BMC
Genomics. 2009;10(1):279.
Lim PO, Kim HJ, Nam HG. Leaf senescence. Ann Rev Plant Biol. 2007;58:115–36.
Sarwat M, Naqvi AR, Ahmad P, Ashraf M, Akram NA. Phytohormones and
microRNAs as sensors and regulators of leaf senescence: assigning macro
roles to small molecules. Biotechnol Adv. 2013;31(8):1153–71.
Balazadeh S, Riaño-Pachón D, Mueller-oeber B. Transcription factors
regulating leaf senescence in Arabidopsis thaliana. Plant biology.
2008;10(s1):63–75.
Gregersen PL, Culetic A, Boschian L, Krupinska K. Plant senescence and crop
productivity. Plant Mol Biol. 2013;82(6):603–22.
Munne-Bosch S, Alegre L. Die and let live: leaf senescence contributes to
plant survival under drought stress. Funct Plant Biol. 2004;31:203–16.
Penfold CA, Buchanan-Wollaston V. Modelling transcriptional networks in
leaf senescence. J Exp Bot. 2014;65(14):3859–73.
Breeze E, Harrison E, McHattie S, Hughes L, Hickman R, Hill C, et al. Highresolution temporal profiling of transcripts during Arabidopsis leaf
senescence reveals a distinct chronology of processes and regulation. Plant
Cell. 2011;23(3):873–94.
Buchanan-Wollaston V, Page T, Harrison E, Breeze E, Lim PO, Nam HG, et al.
Comparative transcriptome analysis reveals significant differences in gene
expression and signalling pathways between developmental and dark/
starvation-induced senescence in Arabidopsis. Plant J. 2005;42(4):567–85.
Humbeck K. Epigenetic and small RNA regulation of senescence. Plant Mol
Biol. 2013;82(6):529–37.
Miersch I, Heise J, Zelmer I, Humbeck K. Differential degradation of the
photosynthetic apparatus during leaf senescence in barley (Hordeum
vulgare L.). Plant Biol. 2000;2:618–23.
Ay N, Irmler K, Fischer A, Uhlemann R, Reuter G, Humbeck K. Epigenetic
programming via histone methylation at WRKY53 controls leaf senescence
in Arabidopsis thaliana. Plant J. 2009;58(2):333–46.
Guo Y, Gan S. AtNAP, a NAC family transcription factor, has an important
role in leaf senescence. Plant J. 2006;46(4):601–12.
Li Z, Peng J, Wen X, Guo H. Gene network analysis and functional studies of
senescence-associated genes reveal novel regulators of Arabidopsis leaf
senescence. J Integr Plant Biol. 2012;54(8):526–39.
Borrell AK, Hammer GL, Henzell RG. Does maintaining green leaf area in
sorghum improve yield under drought? II. Dry matter production and yield.
Crop Sci. 2000;40(4):1037–48.
Fischer AM. The Complex Regulation of Senescence. Crit Rev Plant Sci.
2012;31(2):124–47.
Ay N, Clauss K, Barth O, Humbeck K. Identification and characterization of
novel senescence‐associated genes from barley (Hordeum vulgare) primary
leaves. Plant Biol. 2008;10(1):121–35.
Kleber-Janke T, Krupinska K. Isolation of cDNA clones for genes
showing enhanced expression in barley leaves during dark-induced
senescence as well as during senescence under field conditions. Planta.
1997;203(3):332–40.
Tyagi K, Park MR, Lee HJ, Lee CA, Rehman S, Steffenson B, et al. Fertile
crescent region as source of drought tolerance at early stage of plant
growth of wild barley (Hordeum vulgare L. ssp. spontaneum). Pak J Bot.
2011;43(1):475–86.
Consortium IBGS, Mayer KF, Waugh R, Brown JW, Schulman A, Langridge P,
et al. A physical, genetic and functional sequence assembly of the barley
genome. Nature. 2012;491(7426):711–6.
Kliebenstein D. Quantitative genomics: analyzing intraspecific variation using
global gene expression polymorphisms or eQTLs. Plant Biol. 2009;60(1):93.
Stauss R. Compendium of Growth Stage Identification Keys for Mono-and
Dicotyledonous Plants: Extended BBCH Scale, Autumn 1994: Ciba; 1994.
Marttila S, Tenhola T, Mikkonen A. A barley (Hordeum vulgare L.)
LEA3 protein, HVA1, is abundant in protein storage vacuoles. Planta.
1996;199(4):602–11.
Straub PF, Shen Q, Ho T-hD. Structure and promoter analysis of an ABA-and
stress-regulated barley gene, HVA1. Plant Mol Biol. 1994;26(2):617–30.
Checker VG, Chhibbar AK, Khurana P. Stress-inducible expression of barley
Hva1 gene in transgenic mulberry displays enhanced tolerance against
drought, salinity and cold stress. Transgenic Res. 2012;21(5):939–57.
Rohila JS, Jain RK, Wu R. Genetic improvement of Basmati rice for salt and
drought tolerance by regulated expression of a barley Hva1 cDNA. Plant Sci.
2002;163(3):525–32.
Bray EA. Plant responses to water deficit. Trends Plant Sci. 1997;2(2):48–54.
Wehner et al. BMC Plant Biology (2016) 16:3
57. Fu D, Huang B, Xiao Y, Muthukrishnan S, Liang GH. Overexpression of barley
hva1 gene in creeping bentgrass for improving drought tolerance. Plant
Cell Rep. 2007;26(4):467–77.
58. Marzin S, Mihaly R, Pauk J, Schweizer P. A transient assay system for the
assessment of cell-autonomous gene function in dehydration-stressed
barley. J Exp Bot. 2008;59(12):3359–69.
59. Suprunova T, Krugman T, Fahima T, Chen G, Shams I, Korol A, et al.
Differential expression of dehydrin genes in wild barley, Hordeum
spontaneum, associated with resistance to water deficit. Plant Cell Environ.
2004;27(10):1297–308.
60. Tommasini L, Svensson JT, Rodriguez EM, Wahid A, Malatrasi M, Kato K, et al.
Dehydrin gene expression provides an indicator of low temperature and
drought stress: transcriptome-based analysis of barley (Hordeum vulgare L.).
Funct Integr Genomics. 2008;8(4):387–405.
61. Serraj R, Shelp BJ, Sinclair TR. Accumulation of γ‐aminobutyric acid
in nodulated soybean in response to drought stress. Physiol Plant.
1998;102(1):79–86.
62. Ueno H. Enzymatic and structural aspects on glutamate decarboxylase.
J Mol Catal. 2000;10(1):67–79.
63. Rhodes D, Handa S, Bressan RA. Metabolic changes associated with
adaptation of plant cells to water stress. Plant Physiol. 1986;82(4):890–903.
64. Wheeler MCG, Tronconi MA, Drincovich MF, Andreo CS, Flügge U-I, Maurino
VG. A comprehensive analysis of the NADP-malic enzyme gene family of
Arabidopsis. Plant Physiol. 2005;139(1):39–51.
65. Szabados L, Savoure A. Proline: a multifunctional amino acid. Trends Plant
Sci. 2010;15(2):89–97.
66. Kishor P, Kavi B, Sreenivasulu N. Is proline accumulation per se correlated
with stress tolerance or is proline homeostasis a more critical issue? Plant
Cell Environ. 2014;37(2):300–11.
67. Dobrá J, Vanková R, Havlová M, Burman AJ, Libus J, Štorchová H. Tobacco
leaves and roots differ in the expression of proline metabolism-related
genes in the course of drought stress and subsequent recovery. J Plant
Physiol. 2011;168(13):1588–97.
68. Quan R, Hu S, Zhang Z, Zhang H, Zhang Z, Huang R. Overexpression of an
ERF transcription factor TSRF1 improves rice drought tolerance. Plant
Biotechnol J. 2010;8(4):476–88.
69. Hollmann J, Gregersen PL, Krupinska K. Identification of predominant genes
involved in regulation and execution of senescence-associated nitrogen
remobilization in flag leaves of field grown barley. J Exp Bot. 2014;65(14):3963–73.
70. Carrión CA, Costa ML, Martínez DE, Mohr C, Humbeck K, Guiamet JJ. In vivo
inhibition of cysteine proteases provides evidence for the involvement of
‘senescence-associated vacuoles’ in chloroplast protein degradation during
dark-induced senescence of tobacco leaves. J Exp Bot. 2013;64(16):4967–80.
71. Li W-X, Oono Y, Zhu J, He X-J, Wu J-M, Iida K, et al. The Arabidopsis NFYA5
transcription factor is regulated transcriptionally and posttranscriptionally to
promote drought resistance. Plant Cell. 2008;20(8):2238–51.
72. Zhao M, Ding H, Zhu JK, Zhang F, Li WX. Involvement of miR169 in the
nitrogen‐starvation responses in Arabidopsis. New Phytol. 2011;190(4):906–15.
73. Kamachi K, Yamaya T, Hayakawa T, Mae T, Ojima K. Changes in cytosolic
glutamine synthetase polypeptide and its mRNA in a leaf blade of rice
plants during natural senescence. Plant Physiol. 1992;98(4):1323–9.
74. Buchanan-Wollaston V. The molecular biology of leaf senescence. J Exp Bot.
1997;48(307):181–99.
75. Gregersen P, Holm P, Krupinska K. Leaf senescence and nutrient
remobilisation in barley and wheat. Plant Biol. 2008;10(1):37–49.
76. Humbeck K, Quast S, Krupinska K. Functional and molecular changes in the
photosynthetic apparatus during senescence of flag leaves from fieldgrown barley plants. Plant Cell Environ. 1996;19(3):337–44.
77. Wang Y, Zhang J, Yu J, Jiang X, Sun L, Wu M, et al. Photosynthetic changes
of flag leaves during senescence stage in super high-yield hybrid rice LYPJ
grown in field condition. Plant Physiol Biochem. 2014;82:194–201.
78. Krupinska K, Mulisch M, Hollmann J, Tokarz K, Zschiesche W, Kage H, et al.
An alternative strategy of dismantling of the chloroplasts during leaf
senescence observed in a high-yield variety of barley. Physiol Plant.
2012;144(2):189–200.
79. Humbeck K, Krupinska K. The abundance of minor chlorophyll a/b-binding
proteins CP29 and LHCI of barley (Hordeum vulgare L.) during leaf
senescence is controlled by light. J Exp Bot. 2003;54(381):375–83.
80. Varshney RK, Paulo MJ, Grando S, van Eeuwijk FA, Keizer LCP, Guo P, et al.
Genome wide association analyses for drought tolerance related traits in
barley (Hordeum vulgare L.). Field Crop Res. 2012;126:171–80.
Page 12 of 12
81. Li W-T, Liu C, Liu Y-X, Pu Z-E, Dai S-F, Wang J-R, et al. Meta-analysis of
QTL associated with tolerance to abiotic stresses in barley. Euphytica.
2013;189(1):31–49.
82. Araújo WL, Ishizaki K, Nunes-Nesi A, Larson TR, Tohge T, Krahnert I, et al.
Identification of the 2-hydroxyglutarate and isovaleryl-CoA dehydrogenases
as alternative electron donors linking lysine catabolism to the electron
transport chain of Arabidopsis mitochondria. Plant Cell. 2010;22(5):1549–63.
83. Ishizaki K, Larson TR, Schauer N, Fernie AR, Graham IA, Leaver CJ. The critical
role of Arabidopsis electron-transfer flavoprotein: ubiquinone oxidoreductase
during dark-induced starvation. Plant Cell. 2005;17(9):2587–600.
84. Engqvist MK, Kuhn A, Wienstroer J, Weber K, Jansen EE, Jakobs C, et al. Plant
D-2-hydroxyglutarate dehydrogenase participates in the catabolism of lysine
especially during senescence. J Biol Chem. 2011;286(13):11382–90.
85. Kobayashi Y, Yamamoto S, Minami H, Kagaya Y, Hattori T. Differential
activation of the rice sucrose nonfermenting1–related protein kinase2 family
by hyperosmotic stress and abscisic acid. Plant Cell. 2004;16(5):1163–77.
86. Anderberg RJ, Walker-Simmons M. Isolation of a wheat cDNA clone for an
abscisic acid-inducible transcript with homology to protein kinases. P Natl
Acad Sci USA. 1992;89(21):10183–7.
87. Rabbani MA, Maruyama K, Abe H, Khan MA, Katsura K, Ito Y, et al.
Monitoring expression profiles of rice genes under cold, drought, and
high-salinity stresses and abscisic acid application using cDNA microarray
and RNA gel-blot analyses. Plant Physiol. 2003;133(4):1755–67.
88. Gaxiola RA, Li J, Undurraga S, Dang LM, Allen GJ, Alper SL, et al. Droughtand salt-tolerant plants result from overexpression of the AVP1 H + -pump.
P Natl Acad Sci USA. 2001;98(20):11444–9.
89. Park S, Li J, Pittman JK, Berkowitz GA, Yang H, Undurraga S, et al. Up-regulation
of a H + -pyrophosphatase (H + -PPase) as a strategy to engineer
drought-resistant crop plants. P Natl Acad Sci USA. 2005;102(52):18830–5.
90. Pasapula V, Shen G, Kuppu S, Paez-Valencia J, Mendoza M, Hou P, et al.
Expression of an Arabidopsis vacuolar H + -pyrophosphatase gene (AVP1) in
cotton improves drought-and salt tolerance and increases fibre yield in the
field conditions. Plant Biotechnol J. 2011;9(1):88–99.
91. Bao A-K, Wang S-M, Wu G-Q, Xi J-J, Zhang J-L, Wang C-M. Overexpression
of the Arabidopsis H+-PPase enhanced resistance to salt and drought stress
in transgenic alfalfa (Medicago sativa L.). Plant Sci. 2009;176(2):232–40.
92. Kumar T, Khan MR, Abbas Z, Ali GM. Genetic improvement of sugarcane for
drought and salinity stress tolerance using Arabidopsis vacuolar
pyrophosphatase (AVP1) gene. Mol Biotechnol. 2014;56(3):199–209.
93. Holloway B, Li B. Expression QTLs: applications for crop improvement. Mol
Breeding. 2010;26(3):381–91.
94. Holloway B, Luck S, Beatty M, Rafalski J-A, Li B. Genome-wide expression
quantitative trait loci (eQTL) analysis in maize. BMC Genomics. 2011;12(1):336.
95. Rode J, Ahlemeyer J, Friedt W, Ordon F. Identification of marker-trait
associations in the German winter barley breeding gene pool (Hordeum
vulgare L.). Mol Breeding. 2012;30(2):831–43.
96. Igartua E, Gracia MP, Lasa JM, Medina B, Molina-Cano JL, Montoya JL, et al.
The Spanish barley core collection. Genet Resour Crop Ev. 1998;45:475–81.
97. Livak KJ, Schmittgen TD. Analysis of relative gene expression data using real-time
quantitative PCR and the 2− ΔΔCT method. Methods. 2001;25(4):402–8.
98. RCore. R: A language and environment for statistical computing. R Foundation
for Statistical Computing, Vienna, Austria. ; 2012.
99. Fischer RA, Maurer R. Drought Resistance in Spring Wheat Cultivars. I Grain
Yield Responses. Austral J Agr Res. 1978;29:897–912.
100. Bradbury PJ, Zhang Z, Kroon DE, Casstevens TM, Ramdoss Y, Buckler ES.
TASSEL: software for association mapping of complex traits in diverse
samples. Bioinformatics. 2007;23(19):2633–5.
101. Comadran J, Kilian B, Russell J, Ramsay L, Stein N, Ganal M, et al. Natural
variation in a homolog of Antirrhinum CENTRORADIALIS contributed to
spring growth habit and environmental adaptation in cultivated barley.
Nature Genet. 2012;44(12):1388–92.
102. Pritchard JK, Stephens M, Donnelly P. Inference of population structure
using multilocus genotype data. Genetics. 2000;155(2):945–59.
103. Hardy OJ, Vekemans X. SPAGeDi: a versatile computer program to analyse
spatial genetic structure at the individual or population levels. Mol Ecol
Notes. 2002;2(4):618–20.