Two key genomic regions harbour QTLs for salinity tolerance in ICCV 2 × JG 11 derived chickpea (Cicer arietinum L.) recombinant inbred lines
Bạn đang xem bản rút gọn của tài liệu. Xem và tải ngay bản đầy đủ của tài liệu tại đây (1.13 MB, 15 trang )
Pushpavalli et al. BMC Plant Biology (2015) 15:124
DOI 10.1186/s12870-015-0491-8
RESEARCH ARTICLE
Open Access
Two key genomic regions harbour QTLs for
salinity tolerance in ICCV 2 × JG 11 derived
chickpea (Cicer arietinum L.) recombinant inbred
lines
Raju Pushpavalli1,2, Laxmanan Krishnamurthy1, Mahendar Thudi1, Pooran M Gaur1, Mandali V Rao2,
Kadambot HM Siddique3, Timothy D Colmer4, Neil C Turner3,5, Rajeev K Varshney1,4 and Vincent Vadez1*
Abstract
Background: Although chickpea (Cicer arietinum L.), an important food legume crop, is sensitive to salinity,
considerable variation for salinity tolerance exists in the germplasm. To improve any existing cultivar, it is important
to understand the genetic and physiological mechanisms underlying this tolerance.
Results: In the present study, 188 recombinant inbred lines (RILs) derived from the cross ICCV 2 × JG 11 were used
to assess yield and related traits in a soil with 0 mM NaCl (control) and 80 mM NaCl (salinity) over two consecutive
years. Salinity significantly (P < 0.05) affected almost all traits across years and yield reduction was in large part
related to a reduction in seed number but also a reduction in above ground biomass. A genetic map was
constructed using 56 polymorphic markers (28 simple sequence repeats; SSRs and 28 single nucleotide
polymorphisms; SNPs). The QTL analysis revealed two key genomic regions on CaLG05 (28.6 cM) and on CaLG07
(19.4 cM), that harboured QTLs for six and five different salinity tolerance associated traits, respectively, and
imparting either higher plant vigour (on CaLG05) or higher reproductive success (on CaLG07). Two major QTLs for
yield in the salinity treatment (explaining 12 and 17% of the phenotypic variation) were identified within the two
key genomic regions. Comparison with already published chickpea genetic maps showed that these regions
conferred salinity tolerance across two other populations and the markers can be deployed for enhancing salinity
tolerance in chickpea. Based on the gene ontology annotation, forty eight putative candidate genes responsive to
salinity stress were found on CaLG05 (31 genes) and CaLG07 (17 genes) in a distance of 11.1 Mb and 8.2 Mb on
chickpea reference genome. Most of the genes were known to be involved in achieving osmoregulation under
stress conditions.
Conclusion: Identification of putative candidate genes further strengthens the idea of using CaLG05 and CaLG07
genomic regions for marker assisted breeding (MAB). Further fine mapping of these key genomic regions may lead
to novel gene identification for salinity stress tolerance in chickpea.
Keywords: Chickpea, Salinity treatment, Quantitative trait loci, Yield, Genomic region, Candidate genes
* Correspondence:
1
International Crops Research Institute for the Semi-Arid Tropics, Patancheru
502 234, Telangana State, India
Full list of author information is available at the end of the article
© 2015 Pushpavalli et al.; licensee BioMed Central. This is an Open Access article distributed under the terms of the Creative
Commons Attribution License ( which permits unrestricted use, distribution, and
reproduction in any medium, provided the original work is properly credited. The Creative Commons Public Domain
Dedication waiver ( applies to the data made available in this article,
unless otherwise stated.
Pushpavalli et al. BMC Plant Biology (2015) 15:124
Background
Chickpea (Cicer arietinum L.) ranks second after common bean among the pulses that are consumed [1], and
is subjected to various biotic and abiotic stresses during
its life cycle. The yield loss in chickpea due to salinity
has been estimated to be approximately 8-10% of total
global production [2]. Chickpea is known to be sensitive
to salinity at both the vegetative and reproductive stages
[3], which affects the productivity of the crop across the
chickpea growing areas [4]. Despite the sensitivity of the
crop to salinity, there is a large variation for salinity tolerance [5-7]. In order to harness the complex phenomenon
of salt tolerance, it is important to understand the genetic
and physiological basis of salinity tolerance in order to improve existing crop cultivars.
Several studies have been carried out to understand
the molecular basis of salt tolerance in other crops and
quantitative trait loci (QTLs) for traits associated to salinity tolerance have been identified in cereals like bread
wheat [8], barley [9], and in legumes such as Medicago
truncatula [10], and soybean [11]. In chickpea, the development of molecular markers in recent years has
paved the way to dissect the possible underlying tolerance mechanism for various stresses [12]. In chickpea,
although several mapping studies have been conducted
to identify loci for biotic tolerance [13] and drought tolerance [14] only two studies have reported the presence
of QTLs for salinity tolerance [15,16]. Till date very few
major QTLs were identified for yield components governing salinity tolerance. Also no major QTL was identified for yield under salinity. Thus it becomes important
to identify more number of additional QTLs governing
salinity stress tolerance for yield and yield components
that can be utilised effectively in marker-assisted genetic
improvement of chickpea. Till date there is no report on
putative candidate genes that would confer salinity tolerance in chickpea.
The present study reports the analysis of the agronomical traits contributing to increasing yield under salinity, the construction of a genetic map, the use of the
agronomical analysis to identify QTLs for yield’ and related traits’ salinity tolerance, and the identification of
putative candidate genes using an intra-specific mapping
population derived from ICCV 2 (sensitive) and JG 11
(tolerant).
Results
The detailed results obtained from the unbalanced analysis of variance (ANOVA) for the phenotyping data,
such as mean performance of parental lines, range of
trait values (i.e., maximum and minimum mean values
for each trait) across RILs, broad sense heritability values
(H2), F probability values and least significant difference
Page 2 of 15
(LSD) of traits across two years and treatments, are provided in Tables 1 and 2.
Variance analysis
In both years and treatments the RILs but not the parents showed significant variation for DF (days to first
flower) and DM (days to maturity). Parents showed variation for DM in the salinity treatment in both the years.
In 2010 with the control treatment, no significant variation was observed between the two parents for all the
yield and yield-related traits whereas in the salinity treatment they differed significantly except for the stem + leaf
dry weight and the harvest index (HI) (Table 1). In 2011,
both the control and salinity treatments did not differentiate the parents for any traits except for filled pod number and empty pod number in the control treatment
(Table 2).
The combined unbalanced ANOVA on two years data,
for both of the treatments revealed that the traits DF,
DM and 100-seed weight were significantly influenced
by both genotype and environment, but largely affected
by the genetic potential rather than the environment
(larger F statistic value for the genotype than for the
genotype × year component of the variance). All the
other traits were influenced significantly by the genotype, but not by the environment component (Additional
file 3: Table S3).
Heritability
Heritability estimates were categorized into low (5-10%),
medium (10-30%), high (30-60%) and very high (>60%)
according to a previous report [17]. In 2010 in the control treatment, the broad-sense heritability (H2) of DF,
DM, HI and 100-seed weight was high, whereas all other
yield and yield-related traits had medium heritability
(Table 2). In the salinity treatment, the heritability of DF,
DM, 100-seed weight, stem + leaf weight was high,
whereas heritability of ADM (above ground dry matter),
yield, pod number, seed number and HI had medium
heritability values. In 2011, in the control treatment, the
traits DF, DM and 100-seed weight had high heritability
values, whereas all other traits had medium heritability
values (Table 2). In salinity treatment, the traits ADM
and yield had medium heritability, whereas all other
traits had high to very high heritability values (Table 2).
In summary, the phenological traits had high, whereas
the yield and yield-related traits had moderate-to-high,
heritability values in the salinity treatment.
Relationships of yield and yield-related traits variables
The seed yield in the salinity treatment correlated significantly to control treatment in both the years (R2 = 0.23;
R2 = 0.21). Similarly, means of all other traits in the salinity
treatment significantly correlated with the control mean
Control, 2010
Trait
Days to flower
Days to maturity
Above ground dry
matter (g plant -1)
Yield (g plant -1)
Pod number
plant -1
Seed number
plant -1
Stem + leaf weight
(g plant -1)
Harvest Index
100-seed weight (g)
ICCV 2 (SS)
31
84
22.47
10.86
41.43
41.78
11.61
0.48
25.93
JG 11 (ST)
33
78
24.34
14.18
54.52
60.01
10.16
0.59
23.84
Variation in RILs
23-50
73-99
9.67- 37.35
3.14-18.55
13.97-77.84
27.17-85.21
3.47-19.04
0.18-0.88
14.40-41.58
F Probability
<.001
<.001
<.001
<.001
<.001
<.001
<.001
<.001
<.001
SE
4.63
5.66
5.84
2.89
12.63
13.82
3.35
0.07
2
LSD
9
11
11.49
5.29
24.83
27.17
6.58
0.14
3.94
Heritability (%)
78
61
33
44
43
44
38
71
92
Pushpavalli et al. BMC Plant Biology (2015) 15:124
Table 1 ANOVA results for the parameters evaluated under control and salinity treatments in 2010
Salinity, 2010
ICCV 2 (SS)
30
69
11.81
5.83
29.08
29.35
5.96
0.49
19.89
JG 11 (ST)
34
81
19.84
10.66
46.79
46.02
8.71
0.57
23.36
Variation in RILs
21-56
63-93
5.23-21.23
2.89-11.02
14.71-62.35
13.69-63.9
2.69-12.16
0.28-1.04
13.64-35.28
F Probability
<.001
<.001
<.001
<.001
<.001
<.001
<.001
<.001
<.001
SE
3.49
4.38
3.14
1.62
6.83
7.04
1.62
0.08
1.74
LSD
7
9
6.17
3.18
13.4
13.81
3.17
0.15
3.42
Heritability (%)
85
80
58
44
59
56
65
58
85
Mean values of nine parameters evaluated (two parents, maximum and minimum mean values from 188 RILs) and F probability, standard error (SE), least significant difference (LSD) and the heritability values under
control and saline treatment, 2010.
Page 3 of 15
Control, 2011
Trait
Days to flower
Days to maturity
Above ground dry
matter (g plant -1)
Yield (g plant -1)
Total pod number
plant -1
Seed number
plant -1
Stem + leaf weight
(g plant -1)
Harvest index
100-seed weight (g)
ICCV 2 (SS)
30
76
19.98
10.21
75.97
40.15
9.77
0.53
25.64
JG 11 (ST)
32
79
27.08
14.7
71.34
61.07
12.38
0.54
24.03
Variation in RILs
25-46
73-91
10.55-33.61
4.60-18.13
24.45-109.74
17.59-78.76
5.54-17.42
0.23-0.61
15.17-45.21
F Probability
<.001
<.001
<.001
<.001
<.001
<.001
<.001
<.001
<.001
SE
1.59
2.55
4.18
2.41
14.85
10.13
2.29
0.05
1.65
LSD
3.12
5.01
8.2
4.72
29.14
19.88
4.49
0.11
3.24
Heritability (%)
91
43
52
49
33
49
54
38
91
Pushpavalli et al. BMC Plant Biology (2015) 15:124
Table 2 ANOVA results for the parameters evaluated under control and salinity treatments in 2011
Salinity, 2011
ICCV 2 (SS)
29
69
9.54
5.92
27.66
23.29
3.62
0.62
25.66
JG 11 (ST)
30
75
13.06
7.14
30.66
29.62
5.92
0.55
24.02
Variation in RILs
23-48
66-88
6.93-25.19
2.91-11.89
11.26-85.12
9.56-54.23
2.45-13.30
0.28-0.71
15.45-44.32
F Probability
<.001
<.001
<.001
0.001
<.001
<.001
<.001
<.001
<.001
SE
2.01
2.17
3.09
1.76
9.57
7.63
1.59
0.05
1.82
LSD
3.95
4.25
6.06
3.45
18.78
14.97
3.13
0.09
3.57
Heritability (%)
90
85
48
40
67
60
64
71
89
Mean values of nine parameters evaluated (two parents, maximum and minimum mean values from 188 RILs) and F probability, standard error (SE), least significant difference (LSD) and the heritability values under
control and saline treatment, 2011.
Page 4 of 15
Pushpavalli et al. BMC Plant Biology (2015) 15:124
Page 5 of 15
of the corresponding trait in both the years (Additional file
4: Table S4). To understand the importance of the QTLs
identified, the mean value of traits for which QTLs were
found was correlated with the mean yield in both the
treatments and across years (Additional file 4: Table S4).
Except for DM in the control treatment in 2010 and DF
under salinity in 2011, all the other traits for which
QTLs were identified showed significant correlations
with yield. In the salinity treatment, the ADM, pod
number, and seed number explained up to 76%, 75%,
and 76% of the variation in yield, respectively. In the
control treatment, the stem + leaf weight, filled pod
number and seed number explained up to 51%, 56%
and 49% variations in yield. Although the HI and the
100-seed weight were significantly correlated to seed
yield they explained less than 12% of the yield variation
in both treatments [Table 3].
As all the traits showed significant correlations between the control and salinity treatments, indicating that
the value of traits in the salinity treatment were influenced by the potential value in the control treatment,
the traits were expressed as relative values, calculated as
the ratio of values in salinity treatment to the mean
value of the trait in the control treatment for each RIL.
In 2010 and 2011, the relative ADM (R2 = 0.86, R2 =
0.76), relative stem + leaf weight (R2 = 0.52, R2 = 0.27),
relative pod number (R2 = 0.85, R2 = 0.64 and relative
seed number (R2 = 0.89, R2 = 0.89) showed significant
correlations with relative yield. This indicated that these
traits were important in determining higher yield under
salinity in chickpea. By contrast the relative values of
phenological traits, 100-seed weight and HI were not
significantly related to the relative seed yield (Additional
file 5: Table S5).
Table 3 Relationship between the traits for which QTLs were identified and yield
Control, 2010
Days to maturity (DMC1)
CY1 = 0.0616x + 5.2717DMC1
R2 = 0.001 (n.s)
Aboveground dry matter (ADMC1)
CY1 = 0.4575x + 0.6915ADMC1
R2 = 0.83**
Stem + leaf wt. (ST + LFWTC1)
CY1 = 0.6142x + 3.7464ST + LFWTC1
R2 = 0.51**
Harvest index (HIC1)
CY1 = 14.954x + 3.0064HIC1
R2 = 0.09**
100- seed weight (100SDWTC1)
CY1 = 0.1337x + 7.1635100SDWTC1
R2 = 0.03*
Days to flower (DFS1)
SY1 = 0.0671x + 4.8857DFS1
R2 = 0.04**
Days to maturity (DMS1)
SY1 = 0.0915x + 0.2932DMS1
R2 = 0.10**
Total pod number (TPDNOS1)
SY1 = 0.193x + 0.7443TPDNOS1
R2 = 0.75**
Seed number (SDNOS1)
SY1 = 0.1924x + 0.6744SDNOS1
R2 = 0.76**
Harvest Index (HIS1)
SY1 = 11.534x + 1.0604HIS1
R2 = 0.12**
100 - seed weight (100SDWTS1)
SY1 = 0.2179x + 2.3611100SDWTS1
R2 = 0.11**
Days to flower (DFC2)
CY2 = 0.4756x + 26.722DFC2
R2 = 0.08**
Days to maturity (DMC2)
CY2 = 0.3687x + 75.324DMC2
R2 = 0.09**
Aboveground dry matter (ADMC2)
CY2 = 1.6454x + 3.2286ADMC2
R2 = 0.85**
Stem + leaf weight (ST + LFWTC2)
CY2 = 0.6454x + 3.2286ST + LFWTC2
R2 = 0.48**
Filled pod number (FPDNOC2)
CY2 = 3.034x + 10.336FPDNOC2
R2 = 0.56**
Total pod number (TPDNOC2)
CY2 = 2.9113x + 33.653TPDNOC2
R2 = 0.28**
Seed number (SDNOC2)
CY2 = 2.9747x + 15.317SDNOC2
R2 = 0.49**
100- seed weight (100SDWTC2)
CY2 = 0.7146x + 15.12100SDWTC2
R2 = 0.22**
Harvest index (HIC2)
CY2 = 0.0071x + 0.4364HIC2
R2 = 0.17**
Days to flower (DFS2)
SY2 = 0.3838x + 27.863DFS2
R2 = 0.012(n.s)
Days to maturity (DMS2)
SY2 = 0.6464x + 69.096DMS2
R2 = 0.04**
Aboveground dry matter (ADMS2)
SY2 = 1.5322x + 1.2604ADMS2
R2 = 0.76**
100 - seed weight (100SDWTS2)
SY2 = 0.5902x + 20.249100SDWTS2
R2 = 0.04**
Harvest Index (HIS2)
SY2 = 0.0091x + 0.5234HIS2
R2 = 0.04**
Salinity, 2010
Control, 2011
Salinity, 2011
All the traits were significantly correlated either at P < 0.001 or P < 0.05 except for days to maturity, control, 2010 and days to flower, salinity, 2011.
Pushpavalli et al. BMC Plant Biology (2015) 15:124
Page 6 of 15
Genetic linkage map and marker correspondence
The intra-specific genetic map developed based on
ICCV 2 × JG 11 spanned 329.6 cM with 56 markers
mapped in 7 out of 8 linkage groups. No markers were
mapped on CaLG02. The number of markers mapped
per linkage group varied from 2 to 11. On an average
one marker/ 5.88 cM were mapped in the present
study. The linkage group wise marker correspondence
was established between the genetic map constructed
in the present study and previously published
genetic maps using CMap (Supplementary figure 2
to 10; />saved_links?selected_link_group=Pushpavalli&action=
saved_links_viewer&data_source=CMAP_PUBLIC). There
were no common markers between current study
and [15,16], but all the three studies had common
markers with other published maps that were summarised in Table 4.
number, filled pod number and seed number on CaLG07
in 2011.
In case when one of the flanking markers was common to more than one QTL, that region was considered
as a single genomic region that contained two or more
QTLs. By following this criterion, the 46 QTLs identified
were present in 9 genomic regions (Additional file 11:
Figure S1). QTLs that contributed >10% of the phenotypic variation explained (PVE) were considered as
major QTLs. The PVE by QTLs, in this study, ranged
from 6 to 67%. If in a particular treatment, the QTL for
a given trait appeared in the same genomic region in
more than one year, the QTL was considered as stable
QTL [14]. A total of 14 stable QTLs for five different
traits in control treatment were identified (Additional
file 11: Figure S1).
QTLs for phenological traits
QTLs for salinity tolerance
The genotyping and phenotyping data were analysed for
identification of major and minor QTLs to understand
the genetic basis of salinity tolerance. In the mapping
population derived from ICCV 2 × JG 11, a total of 46
QTLs were identified that included 19 QTLs for phenological traits (7 QTLs for DF; 12 QTLs for DM) and 27
QTLs for yield and yield-related traits across years and
treatments. The QTL analysis for seven (2010) and nine
(2011) yield and yield-related traits detected 23 major
QTLs across treatments for all traits (3 QTLs for ADM;
1 QTL for seed number; 1 QTL for pod number; 3
QTLs for yield; 2 QTLs for stem + leaf weight; 9 QTLs
for HI; 4 for 100-seed weight) except for filled pod number and empty pod number (Additional file 6: Table S6).
In the salinity treatment a few minor QTLs were identified for HI on CaLG04d in 2010, while in the control
treatment minor QTLs were identified for yield, pod
In 2010, for DF neither in control nor in the salinity
treatment major QTL was identified but in 2011, six
major QTLs (3 QTLs in the control and 3 QTLs in the
salinity treatment), for DF were identified and explained up to 40% of the PVE. In 2010 no major QTL
for DM in the salinity treatment was identified but 4
major QTLs (up to 67% PVE) for DF were identified
in the control treatment. In 2011, in the salinity treatment, four major QTLs were identified for DM (up to
67% PVE) and in the control treatment; three QTLs
(up to 65% PVE) were identified. Four stable QTLs for
DM in control treatment were detected, two each in
CaLG05 (with flanking markers CaM0463-ICCM272)
and in CaLG08 (CKAM1903-CKAM0343) (Additional
file 6: Table S6). In any case, since there was no relationship between phenological development and yield
either in the control or salinity treatments, these
QTLs were not considered important for the primary
purpose of this study.
Table 4 Linkage group correspondence in three studies to published maps
LG number as per published maps
Samineni (2010)
Vadez et al. (2012)
In present study
LG 1
NA
LG 1 (6)
CaLG01 (3)
LG 2
LG 2 (5)
LG 2 (4)
NA
LG 3
LG 1 (4), LG3 (2)
LG 6 (3)
CaLG03 (3)
LG 4
LG 4 (7)
LG 6 (18)
CaLG04 (3), CaLG05a (3)
LG 5
LG 7 (8)
LG 7 (10)
CaLG02 (3)
LG 6
LG 6 (6)
LG 3 (10)
CaLG05b (3)
LG 7
LG 5 (6)
LG 5 (7)
CaLG07 (6)
LG 8
LG 8 (4)
LG 4 (5)
CaLG08 (4)
The linkage group number in published maps and the corresponding number in Samineni (2010), Vadez et al. (2012) and in present study were given. The
numbers within parenthesis refers to the common markers identified between the linkage group in a population and reference maps. NA- Not applicable. LG 5
and LG 7 in reference maps that harbored salinity tolerance related QTLs across three population were highlighted. (bold + red font).
Pushpavalli et al. BMC Plant Biology (2015) 15:124
Yield and biomass
Four yield QTLs (three major and one minor QTL),
were identified across two years and treatments. In 2010,
in the salinity treatment one major QTL was identified
on CaLG07 and explained 17% of the PVE. In 2011, one
major QTL in the salinity treatment that explained 12%
PVE was also identified on CaLG05, while one major
QTL (16% PVE) and one minor QTL (8% PVE) were
identified on each of CaLG05 and CaLG07 in the control
treatment. The two major QTLs identified in the control
and salinity treatments in 2011 were located at the same
position on CaLG05 with flanking markers, CaM0463
and ICCM272.
In the salinity treatment, one major QTL for ADM
that explained 12% PVE was identified in 2011. In the
control treatment, two major QTLs for ADM that explained up to 27% PVE were identified across years. All
the three QTLs for ADM were found at the same loci of
CaLG05 (CaM0463-ICCM272). Thus two stable QTLs for
ADM in control treatment were identified. In the salinity
treatment, no QTL for stem + leaf weight was identified,
whereas in the control treatment two major and stable
QTLs for stem + leaf weight were identified on CaLG05
(CaM0463-ICCM272) across years (Additional file 6:
Table S6).
QTLs for pod number, filled pod number and seed
number
In the salinity treatment in 2010, one major QTL for pod
number (25% PVE) was found on CaLG07 (CaM2031CKAM0165) while in the control treatment in 2011, one
minor QTL (8% PVE) was found on CaLG07 (ICCM0034CaM0906). In the control treatment, one more minor QTL
for filled pod number (8% PVE) was found on CaLG07.
Again on CaLG07, in the salinity treatment in 2010, one
major QTL for seed number with 17% PVE and in the control treatment in 2011, one minor QTL (9% PVE) was identified for seed number. These QTLs were of great interest
since the correlation analysis above also showed a close relationship between seed and pod number and yield across
treatments.
QTLs for harvest index and 100-seed weight
The QTL analysis identified nine QTLs for HI across
years and treatments. In 2010, in the salinity treatment a
minor QTL (6% PVE) for HI was identified on CaLG04d
while in the control treatment two major QTLs for HI
were identified, one each on CaLG05 (46% PVE) and
CaLG08 (10% PVE). In 2011, in the salinity and control
treatment, three major QTLs per treatment for HI
explaining PVE of 30-49% and 32 to 56%, one each on
CaLG05, CaLG04d and CaLG08 were identified. Four
stable QTLs for HI under control treatment were identified. Four major QTLs for 100-seed weight, one each
Page 7 of 15
per treatment and per year, were identified on CaLG05.
Three of the four QTLs for 100-seed weight were identified at the same locus of CaLG05 (CaM0463-ICCM272)
and explained PVE up to 40%. Two stable QTLs for
100-seed weight under control treatment were identified.
The fourth QTL was also identified on CaLG05, but at a
different position which explained 17% of the PVE.
Again, although these QTLs were significant, they had
limited importance for the primary scope of this study
since there was only limited or no significant relationship between 100-seed weight or HI and yield in any of
the treatments, especially under salinity (Additional file
5: Table S5).
Genomic regions harbouring QTLs for salinity tolerance
identified
The genomic region of CaLG05 flanked by markers
CaM0463 and ICCM272 contained 17 major QTLs for
seven different traits (DF, DM, ADM, stem + leaf
weight, 100-seed weight, HI and yield) across treatments
(Figure 1). Furthermore, one major QTL for DF, DM,
ADM, HI, 100-seed weight and yield in the salinity treatment was found in this region. Another genomic region,
on CaLG07, harboured seven QTLs, out of which 5 QTLs
were identified in the salinity treatment for five different
traits (DF, DM, seed number, pod number and yield), but
none of these QTLs were stable (Figure 2). A genomic
region on CaLG08 harboured eight QTLs (6 in the control treatment and 2 in the salinity treatment) for three
traits, DF, DM and HI. Out of these three genomic regions, the genomic regions on CaLG05 and CaLG07
were of greatest interest as they hold QTLs for traits
that were significantly related to yield under salinity
(Additional file 11: Figure S1).
Mining candidate genes in salinity stress responsive
genomic regions
The BES-SSRs (CaM0463 and CaM0123) on CaLG05
were mapped on Ca5, chickpea reference genome, over a
11.7 Mb (33.1 Mb and 44.8 Mb) distance between the
markers. Similarly the BES-SSRs CaM2031 and CaM1942
markers on CaLG07 were mapped on Ca7 over a 12.5 Mb
(36.3 Mb and 48.9 Mb) distance between the markers on
the chickpea reference genome. A total of 1129 and 440
genes were identified on CaLG05 and CaLG07 respectively (Additional file 7: Table S7). All the identified 1569
genes could be assigned to three functional categories:
(i) molecular function, (ii) cellular component and (iii)
biological processes.
Though the total number of genes found on
CaLG05 and CaLG07 were 1569, the sum of genes
assigned to different functional categories (2710) was
higher. This is because a given gene may fall in more
than one category (Additional file 8: Table S8). In the
Pushpavalli et al. BMC Plant Biology (2015) 15:124
Page 8 of 15
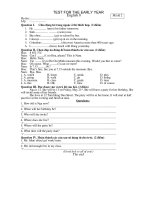
Figure 1 QTLs for seven different traits were identified across years and treatments on CaLG05. A. Genomic region on CaLG05 that harboured
the 17 QTLs for traits that conferred salinity tolerance in ICCV 2 × JG 11 population were identified using QTL cartographer. B. CaLG05 in ICCV 2 ×
JG 11 population corresponded to LG 5 in Thudi et al. 2011 and LG7 in Vadez et al. 2012.
Pushpavalli et al. BMC Plant Biology (2015) 15:124
A
Page 9 of 15
B
LG 7 (Thudi et al. 2011)
CaLG07
(In present study)
0.0
5.9
7.1
7.9
10.0
18.3
19.0
25.2
26.0
27.1
27.4
28.0
28.1
28.9
29.5
30.2
30.5
30.6
77.7
74.6
CKAM0280
CaM1469
CKAM1317
59.1
CKAM0993
39.9
CKAM0448 CaM1942
20.3
0.9
0.0
(On
CaLG07
in
physical
map,
CKAM0165 Thudi et
al. 2011)
31.1
31.5
31.9
32.0
32.6
33.6
35.0
35.1
35.2
35.7
36.5
37.8
38.0
39.3
40.8
41.6
43.5
43.9
45.5
45.6
46.3
46.6
48.0
49.4
49.9
50.1
50.3
50.6
50.9
51.3
51.8
52.0
52.1
52.3
CaM2031 CaM1608
CaM0906
ICCM0034 (On
CaLG03 52.5
in
physical 52.7
map,
Thudi et 52.8
al. 2011)
52.9
53.1
53.3
53.5
53.6
54.0
54.3
54.7
55.3
55.7
57.3
58.7
59.6
62.2
63.3
63.6
64.4
65.4
65.8
66.4
66.7
CaM0812
STMS25
CaM1469 CaM2094
H1N12
TA196
CaM0958
CaM0656
CaM0864
CaM2162
XP-Ca-20253
CaM0277
AJ276275
ISSR830
CaM0705
cpPb-490513
CaM0795
CaM1975
LG 5
cpPb-173044 cpPb-491157
(Vadez et al. 2012)
cpPb-490210 cpPb-490981
cpPb-491194 cpPb-677096
TA95rts3
31.7
CaM0340 CaM1658
NO_X_13_ NO_112_1NO_X_1
30.7
CaM0345
29.8
TA18 TA78
CaM0599 TA21
CaM1496
CaM0435
ISSR8112
CaM1506
CaM1591
CaM1497
HR_Oben
cpPb-490874 cpPb-682790
ICCM0034 CaM2186
CaM0443
TA78
CaM1827
TA18
TSa62
TA28 TA21
15.1
TAb140
TA180 TS46
TAA59
TAA58
TA28
TA5L-TS71R
CaM0598
H1O12
CaM2032
CaM1607 CaM0622
H1I18
CaM0286
cpPb-682222
cpPb-682693
cpPb-327923
cpPb-679896
cpPb-676498 CaM1620
0.0
TA114
cpPb-677192 cpPb-677961
cpPb-490690 cpPb-679050
cpPb-488935
cpPb-677368 cpPb-350187
cpPb-675455 cpPb-680065
cpPb-489394 cpPb-679693
cpPb-489344 cpPb-677139
cpPb-350325
cpPb-682791 CaM1159
CaM0034
H1C22
cpPb-326427
cpPb-173377
CaM0661
AGL178
H5E11
MSU82
cpPb-681271
ICCM0196
cpPb-325968
cpPb-682113
TA4L-TA199R-4_540
cpPb-676152
STMS9
GAA44 TGAA44
CaM0583
cpPb-679688
EST671
TA180
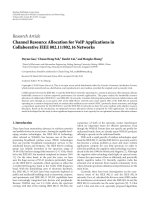
Figure 2 QTLs for five different traits were identified across years and treatments on CaLG07. A. Genomic region on CaLG07 that harboured the
9 QTLs for traits that conferred salinity tolerance in ICCV 2 × JG 11 population were identified using QTL cartographer. B. CaLG07 in ICCV 2 × JG
11 population corresponded to LG 7 in Thudi et al. 2011 and LG5 in Vadez et al. 2012.
Pushpavalli et al. BMC Plant Biology (2015) 15:124
molecular function category, the highest number of
genes fell into binding (575) followed by catalytic activity (501) whereas in cellular component category,
the highest number of genes fell into cell part (765)
followed by membrane (335). Similarly, in the biological processes category, a maximum number of
genes fell into metabolic process (747) followed by
cellular process (727) and biological regulation (336)
(Additional file 7: Table S7).
Based on gene ontology (GO) annotation, from 1569
genes, 48 putative candidate genes were found to have
reported to have a reponse in several plant species to
salinity stress (31 on CaLG05 and 17 on CaLG07).
These 48 genes were located in a distance of 11.1 Mb
(33.6 Mb to 44.7 Mb) and 8.2 Mb (starting at 37.9 Mb
and ending at 46.1 Mb) on CaLG05 and CaLG07
respectively.
Discussion
Comparing the loci of QTLs for salinity tolerance with
previous studies
The genetic map was constructed from ICCV 2 x JG 11
derived population where two key genomic regions related to salinity stress tolerance were identified. To
understand whether the genomic regions conferred salinity tolerance across populations, the markers on each
LG were compared with published maps and a standard
LG number was assigned. For example, nine markers
were mapped on LG 5 in a previous report [16]. When
we searched for the position of these nine markers in published maps, we found that seven out of nine markers
were located on LG 7 in the published maps [18,19]. Thus,
the LG 5 was re-assigned to LG 7 to coincide with the
published maps. Re-assigning LG numbers was done for
each LG group in the three populations (Table 4). By
doing this, we were able to compare the key genomic regions identified in the present study with those in the
other two studies and this comparison helped us to identify whether a particular LG contained QTLs for salinity
tolerance-related traits across populations.
Genomic region on CaLG05 (CaM0463- ICCM272)
CaLG05 in the present study, LG 7 in [15] and LG 7 in
[16] corresponded to LG 5 on the published maps. In the
present study on CaLG05, two major QTLs were identified for yield, one in the salinity treatment (12% PVE) and
another in the control treatment (16% PVE). The genomic
region on CaLG05, flanked by CaM0463 and ICCM272
markers spanning the distance of 28.6 cM, harboured at
least one QTL for six different traits per treatment (control, salinity) other than the QTL for yield. So, this locus
clearly not only harboured salinity-tolerant QTLs, but also
had a highly significant effect on enhancing yield and its
related traits across environments in this particular
Page 10 of 15
population. Many of the QTLs in that region were found
to increase biomass in both treatment and therefore this
region would impart increased crop vigour that would
eventually lead to a yield benefit. The favourable allele for
yield and the QTLs for 6 different traits on CaLG05 were
from ICCV 2, the sensitive parent, but known to have
good early vigour. In another study, by [15] a minor QTL
for yield that explained 8% PVE was located on LG 7 of
ICC 1431× ICC 6263 genetic map. In [16], in the salinity
treatment the LG 7 of the ICCV 2 × JG 62 mapping population harboured one QTL for seed weight, pod number,
HI and 100-seed weight. So after standardising the LG
number of three populations, it was clear that the LG 5 of
the published maps harboured several important QTLs
for salinity tolerance in chickpea (Table 4, Figure 1). Thus,
the genomic region found on CaLG05 in the present study
(LG 5 in the published maps), is considered to be an
important genomic region for future MAB for salinity tolerance in chickpea, and this region appears to confer
higher plant vigour.
Genomic region on CaLG07 in the present study
(CaM2031-CKAM0165)
CaLG07 in the present study and LG 5 in [16] corresponded to LG 7 in the published maps. The major QTL
that contributed 17% PVE to yield in salinity treatment
was identified on CaLG07 using a composite interval
mapping approach. In the control treatment a minor QTL
(8% PVE) for yield was also found on CaLG07. Two major
QTLs for aboveground dry matter on LG 5 (LG 7 as per
published maps) with 27% and 20% PVE and also QTLs
for HI and DF were identified under salinity conditions by
[16]. In the present study, the loci flanked by the markers
CaM2031-CKAM0165 on CaLG07 that spanned the distance of 19.4 cM contained one QTL per treatment for
yield and pod number.
Unlike on CaLG05, on CaLG07 the QTL for yield that
contributed the highest PVE (17%) was found in the salinity treatment, whereas the QTL in the control treatment had a low PVE (7%). The QTL for yield in the
salinity treatment in CaLG07 co-maps (at the same position 15.91 cM) with the QTL for pod number and seed
number, indicating that this particular loci could be particularly responsible for enhanced yield in salinity stress
environments in chickpea, by means of securing a better
reproductive success under saline conditions. The allele
for the loci is from the salinity-tolerant parent, JG 11
(Figure 2). Therefore, the genomic region found on
CaLG07 in the present study is the other important genomic region for future MAB for salinity tolerance in
chickpea, and this region appears to confer the capacity
to maintain a large number of seeds, probably in relation
to an enhanced reproductive success.
Pushpavalli et al. BMC Plant Biology (2015) 15:124
Key traits to impart salinity tolerance
The QTLs for DF and DM were located on CaLG01,
CaLG05, CaLG04d, CaLG07 and CaLG08, indicating
these traits may be controlled by polygenes present on
different chromosomes. Though the phenological traits
had high heritability values across treatments and
years, there was no significant relationships between
the phenological traits and pod yield, so that these
QTLs would have no use in breeding salt tolerant lines.
Indeed, unlike the study in soybean by [20] phenological traits had no role in determining yield in the
ICCV 2 × JG 11 mapping population, this might be due
to the fact that both genotypes were early maturing
and the range of variation in phenology was small. This
was different from an earlier QTL study by [16], in
which the two parental lines (one was ICCV 2) had
large phenological and yield variation, so that the related QTLs, had to be analysed through the lens of
flowering-time differences.
The yield-related traits such as ADM, stem + leaf
weight, total pod number and seed number were found to
be significantly and linearly related to yield across treatments. Also the mean values of above-mentioned traits in
the salinity treatment were significantly explained by the
control treatment. So in the mapping population, ICCV
2 × JG 11 used in the present study, QTLs found in the
control treatment also holds significant importance in enhancing salinity tolerance. The co-mapping of QTLs for
traits like ADM, stem + leaf weight, total pod number,
filled pod number and seed number along with the yield
QTL makes the two major genomic regions on LG 5 and
LG 7 (as per the published maps) promising targets for future breeding of salinity tolerant chickpea.
Candidate genes identification and its association with
salinity tolerance
In plant response pathways to stresses, the membrane
receptors, ion channels, histidine kinase etc., perceive
the extracellular stress signal and in turn activate complex signalling cascade at intracellular level [21]. This is
followed by generation of secondary signal molecules
such as Ca2+, inositol phosphates; reactive oxygen species (ROS) and abscisic acid (ABA) that transduce stress
responsive genes and lead to plant acclimatize for stress
tolerance directly or indirectly. The stress induced genes
involved in the generation of regulatory molecules like
ABA, salicyclic acid and ethylene result in a second
round of signalling. These molecules were found to cross
talk in stress signalling pathways [21].
The putative candidate genes found in this study were
also experimentally demonstrated for their role in salinity stress response by several studies in different plants
(Additional file 9: Table S9A and Additional file 10:
Table S9B). Across CaLG05 and CaLG07, ten candidate
Page 11 of 15
genes that encode for proteins ABA-insensitive 5 like
protein, UBP16, HVA22-like, HDA6, and beta glucosidase 24, transcription factors Myb 44, ATHB 5, and
GTE10 were identified. These genes were found to have
a vital role in ABA biosynthesis, metabolism, and ABA
dependent signalling pathways (Additional file 9: Table
S9A, Additional file 10: Table S9B). In soybean, novel ion
transporter gene GmCHX1 was reported to confer salinity
tolerance by achieving ion homeostasis [22], something
that has been recently hypothesized to potentially play a
key role in the adaptation to salt stress in chickpea [65]. In
the present study, on CaLG05, three putative candidate
genes involved in ion transport encode the proteins of a
potassium channel AKT1 (involved in regulating K+/Na+
ratio), ubiquitin carboxyl-terminal hydrolase 16 and probable inactive poly [ADP-ribose] polymerase SRO2 (regulates plasma membrane antiporter activity) were reported
to confer salinity stress tolerance in Arabidopsis [23,24].
Genes involved in the biosynthesis of methionine and
osmolytes like Gly betaine were also identified on CaLG05
and CaLG07. Among 48 putative candidate genes, most of
the genes were found to play a direct or indirect role in
osmoregulation that helps the plants to cope not only
with salinity stress but also with other abiotic stresses
(Additional file 9: Table S9A and Additional file 10:
Table S9B). Identification of putative candidate genes
for salinity tolerance on CaLG05 and CaLG07 made
theses genomic regions more promising which can be
exploited for improving abiotic stress tolerance in
chickpea through MAB.
Conclusions
The present study has identified two potential genomic
regions that harboured QTLs linked to salinity tolerance
in chickpea and which can be used in MAB. The genomic region on CaLG05 harboured QTLs for six traits
in the salinity treatment found to have a role in enhancing productivity across both control and salinity environments, and confers higher plant vigour. Yield and
related traits QTLs were also identified in two other
populations in the same chromosome region, which validates the importance of that region. The genomic region
on CaLG07 harboured major QTLs for yield and its related traits, mainly under salinity, especially seed and pod
number. This QTL is hypothesized to confer a higher
reproductive success. Availability of chickpea whole
genome sequence allowed the identification of putative
candidate genes for salinity tolerance in the two genomic regions that were identified, which is being
reported for the very first time. The present study
opens a window for further research work towards the
fine mapping of the genomic regions on CaLG05 and
CaLG07 and the identification of novel genes for
salinity tolerance in chickpea.
Pushpavalli et al. BMC Plant Biology (2015) 15:124
Materials and methods
Plant material and treatment conditions
A total of 188 F8 RILs were derived from the salt-sensitive
parent ICCV 2 and salt-tolerant parent JG 11. The study
was conducted in pots buried in the ground at ICRISAT,
Patancheru, India (17°30’N; 78°16’E; altitude 549 m). This
system enables soil salinity treatments to be imposed in
outdoor conditions, but sheltered from the rain [5,6].
Two experiments were carried out between October
and February in two consecutive growing seasons (20102011 and 2011-2012) with a salinity treatment and a control treatment in both growing seasons. In 2010-2011, the
plants were sown on 30th October 2010 and harvested in
the first week of February 2011. In 2011-2012, the plants
were sown on 25th October 2011 and harvested between
19th January and 6th February 2012 in the salinity pots and
between 6 and 25th February 2012 in the control pots.
Hereafter, the year of sowing, 2010 and 2011, will be used
to indicate the 1st and 2nd experiment, respectively. Maximum temperatures during the growing season ranged
from 22 to 32°C in 2010 and 25 to 36°C in 2011, while
minimum temperatures ranged from 6 to 22°C in 2010
and 8.6 to 22°C in 2011 with relative humidities of 46-86%
during the day in 2010 and 41-79% in 2011.
Pots (0.27 m diameter) containing 7.5 kg of a vertisol
(fine montmorillontitic isohyperthermic typic pallustert)
soil were buried in the soil so that the outer rim of each
pot and outside soil surface were at the same level to
avoid direct heating of the pots by solar radiation. The
vertisol soil (pH = 8.1, cation exchange capacity (CEC)/
clay ratio = 0.87, ECe = 1 dS m–1) [17,25] was taken from
the ICRISAT farm and fertilised with di-ammonium
phosphate at a rate of 300 mg kg–1 soil. One-half of the
pots were artificially salinized with 1.17 g NaCl kg–1 soil,
equivalent to 80 mM NaCl in sufficient volume (1.875 L)
to wet the vertisol to field capacity. The control pots received tap water containing no significant amounts of
NaCl in the same quantity to bring the soil to field capacity. Subsequent watering of both treatments was performed with tap water. The bottoms of the salinized
pots were sealed to avoid any salt leaching. Therefore utmost care was taken to water the salt-treated pots, to
avoid both water stress and water logging in the pots.
To achieve this plants were watered usually every two
days, especially at later stage. In our initial work on salt
stress, we would estimate the amount of water to be
added to reach 90% field capacity with a set of pots
weighted at field capacity and then weighted before each
watering to assess water losses. Over time and with experience, we would apply a set amount to all pots based
on water requirements of the smallest plants, usually
every 2-3 days, and then give additional amounts to pots
containing larger plants. The watering was also a key
element to maintain the salt concentration in the soil
Page 12 of 15
solution relatively constant. The pots were also small
enough that there was only a very limited salt gradient
from top to bottom. In both treatments, six seeds were
planted in each pot and later thinned to four similarsized plants per pot. The experimental design was a
randomised block design (RBD) with two treatments, a
control (0 mM NaCl) and a salinity treatment (80 mM
NaCl) as main factors and genotypes as sub-factors
with four replications per treatment (each replicate was
a single pot containing four plants).
Parameters evaluated
The RIL population along with parents was phenotyped
for days to 50% flowering (DF) and maturity [DM; in
days after sowing (DAS) and recorded when at least two
plants per pot commenced flowering or reached maturity]. At maturity, all plants were harvested and oven
dried at 65°C for 48 h. After oven-drying, seven yieldrelated traits - aboveground dry matter g plant-1 (including stem, leaves left at maturity and the pods) (ADM),
stem + leaf weight g plant-1, total pod number plant-1,
seed number plant-1, yield (seed weight) g plant-1 were
recorded. Harvest Index (HI) was calculated by dividing
yield by ADM. The100-seed weight was calculated by
dividing yield by seed number and multiplied by 100. In
2011, along with above-mentioned traits, the number of
filled pods plant-1 and number of empty pods plant-1
was counted. Any pod that had no or non-viable seeds
was considered as an empty pod. The filled pod number
was the difference between the total pod number and
the empty pod number. All parameters were measured
on a pot basis and calculated on a per plant basis.
PCR and marker analysis
A total of 98 markers (68 SSRs and 30 SNPs) distributed
equally on the chickpea genome were chosen from published genetic maps [18,19,26] for assessing parental polymorphism (ICCV 2 and JG 11). Polymorphic markers
were genotyped on the RILs using the polymerase chain
reaction (PCR) amplification condition described earlier
[18,26]; (Additional file 1: Table S1 and Additional file 2:
Table S2). In brief, polymerase chain reactions for all SSR
markers were performed in 5 μL reaction volume employing GeneAmp® PCR system 9700 DNA thermal cycler
(Applied Biosystems, CA, USA). The SNP markers were
genotyped as described earlier by [19].
Construction of genetic map and QTL analysis
A total of 66 polymorphic markers were used to construct the genetic linkage map using Join Map v 4.0
(www.kyazma.nl/index.php/mc.JoinMap) [27]. In order
to find the QTLs responsible for the salinity tolerance,
composite interval mapping (CIM) was employed using
Windows QTL Cartographer version 2.5 [28]. To gain
Pushpavalli et al. BMC Plant Biology (2015) 15:124
greater insights into genomic regions controlling the
salinity tolerance we compared the results from this
study with the previously published genetic maps
( />Hereafter, the different chickpea genetic maps that were
used for comparison were collectively referred as
“published maps”.
Identification of genes for salinity tolerance in present
study
In order to identify candidate genes, the bacterial artificial
chromosome (BAC)-end derived SSR markers (BES-SSRs)
present in the QTL region/or flanking the salinity tolerance QTLs whose physical positions [29] were known
were subjected to BLAST against chickpea reference genome assembly [30]. The candidate genes in the regions between the markers mapped on the reference genome were
retrieved and functionally categorized using UniProt KB
database ( />Statistical analysis
The data were analysed with GENSTAT 14.0 (VSN International Ltd., Hemel Hempstead, UK). An unbalanced
ANOVA was performed for all observed parameters individually. Differences between mean values of treatments
were evaluated using a LSD test at a 0.05 significance
level. Linear regressions were fitted using Microsoft Excel
2007 (Microsoft Corp., 1985, Redmond, Washington,
USA). Genotypic and phenotypic components were obtained from ANOVA which was used to calculate the
broad sense heritability (H2).
Availability of supporting data
All the supporting data are included as a additional files
in this manuscript.
Additiional files
Additional file 1: Table S1. Polymorphic SSR markers used for
genotyping the F8 RIL chickpea population of ICCV 2 × JG 11. The
unlinked markers are denoted by *.
Additional file 2: Table S2. LPolymorphic SNP markers used for
genotyping the F8 RIL chickpea population of ICCV 2 × JG 11. The
unlinked markers are denoted by *.
Additional file 3: Table S3. F probability values (at P < 0.01), F statistic
values obtained with unbalanced ANOVA analysis for genotype, year,
genotype*year interaction. Nine and eleven different traits were
evaluated under control and saline treatment in 2010 and 2011
respectively.
Page 13 of 15
Additional file 6: Table S6. Summary of major and minor QTLs for
various salinity tolerance related traits. The QTLs were identified using
QTL Cartographer on ICCV 2 × JG 11 derived mapping population.
Additional file 7: Table S7. 1569 candidate genes with the UniProt Id
and protein name found on CaLG05 and CaLG07 were given. Genes
that were found to involve in salinity stress response were highlighted
(Ca5- Yellow; Ca7-Blue).
Additional file 8: Table S8. Gene ontology categorization of 1569
genes identified on CaLG05 and CaLG07.
Additional file 9: Table S9A. List of putative candidate genes found to
be associated with salinity stress response on CaLG05. (XLS 30 kb)
Additional file 10: Table S9B. Table S9B: List of putative candidate
genes found to be associated with salinity stress response on CaLG07.
Additional file 11: Figure S1. Genetic linkage map of chickpea (ICCV
2 × JG 11) with 56 markers on seven linkage groups. Kosambi map
distances are on left- hand side and the genomic regions harboring QTL
for salinity-related regions are on right-hand side as listed in Additional
file 6: Table S6 in the control and saline treatment, 2010 and 2011.
Abbreviations
QTL: Quantitative trait loci; SNPs: Single nucleotide polymorphisms;
SSRs: Simple sequence repeats; RILs: Recombinant inbred lines; LSD: Least
significant difference; DF: Days to first flower; DM: Days to maturity;
HI: Harvest index; ADM: Above ground dry matter; ANOVA: Analysis of
variance; PVE: Phenotypic variation explained; GO: Gene ontology;
LG: Linkage group; MAB: Marker assisted breeding; ROS: Reactive oxygen
species; ABA: Abscisic acid; CEC: Cation exchange capacity; RBD: Randomized
block design; PCR: Polymerase chain reaction; CIM: Composite interval
mapping; BAC: Bacterial artificial chromosome.
Competing interests
The authors declare that they have no competing interests.
Authors’ contributions
VV, RKV, NCT, TDC and KHMS designed experiments. RP and LK carried out
experiments in field and involved in data collection, analysis and
interpretation. PMG developed the RILs. MT and RKV involved in genotyping,
genotyping data interpretation and genetic map construction. MVR helped
while drafting the manuscript. RP and VV wrote the paper. All authors read
and approved the final manuscript.
Acknowledgements
The technical assistance provided by Mr N Jangaiah throughout the
experiment is gratefully acknowledged. Special thanks to Mr Aamir W Khan,
Ms Deepa Jaganathan for their help in data analysis and interpretation and
to Mr Bhanu Prakash, Dr Abhishek Rathore for uploading the mapping data
to cmap server. The authors thank Australia-India Strategic Research Fund
(Project ST050162) for financial assistance. R Pushpavalli thanks the World
Bank for financial support through a grant from the International Fund for
Agriculture Research (IFAR).
Author details
1
International Crops Research Institute for the Semi-Arid Tropics, Patancheru
502 234, Telangana State, India. 2Department of Plant Science, Bharathidasan
University, 620024 Tiruchirappalli, Tamil Nadu, India. 3The UWA Institute of
Agriculture, The University of Western Australia, 35 Stirling Highway, 6009
Crawley, WA, Australia. 4School of Plant Biology, The University of Western
Australia, 35 Stirling Highway, 6009 , Crawley, WA, Australia. 5Centre for Plant
Genetics and Breeding, M080, The University of Western Australia, 35 Stirling
Highway, 6009 Crawley, WA, Australia.
Additional file 4: Table S4. Relationship between the nine and eleven
traits evaluated under control and salinity in 2010 and 2011. All the traits
were significantly correlated (P < 0.001).
Received: 12 February 2015 Accepted: 9 April 2015
Additional file 5: Table S5. Relationship between relative yield in 2010
and 2011 (RY1 and RY2) and relative values of studied parameters. The
equations are the fitted linear regressions with the correlation coefficients
and level of significance (**-P < 0.01; *-P < 0.05; n.s.- non-significant).
References
1. FAOSTAT. FAOSTAT database. Available at (2013). Accessed 12 Augt 2014.
2. Flowers TJ, Gaur PM, Gowda CLL, Krishnamurthy L, Srinivasan S, Siddique
KHM, et al. Salt sensitivity in chickpea. Plant Cell Environ. 2010;33:490–509.
Pushpavalli et al. BMC Plant Biology (2015) 15:124
3.
4.
5.
6.
7.
8.
9.
10.
11.
12.
13.
14.
15.
16.
17.
18.
19.
20.
21.
22.
23.
24.
25.
Samineni S, Siddique KHM, Gaur PM, Colmer TD. Salt sensitivity of the
vegetative and reproductive stages in chickpea (Cicer arietinum L.): Podding
is a particularly sensitive stage. Environ Exp Bot. 2011;71:260–8.
Rengasamy P. World salinization with emphasis on Australia. Aust J Exp Bot.
2006;57:1017–23.
Vadez V, Krishnamurthy L, Serraj R, Gaur PM, Upadhyaya HD, Hoisington DA,
et al. Large variation in salinity tolerance in chickpea is explained by
differences in sensitivity at the reproductive stage. Field Crop Res.
2007;104:123–9.
Krishnamurthy L, Turner NC, Gaur PM, Upadhyaya HD, Varshney RK,
Siddique KHM, et al. Consistent variation across soil types in salinity
resistance of a diverse range of chickpea (Cicer arietinum L.) genotypes.
J AgronCrop Sci. 2011;197:214–27.
Turner NC, Colmer TD, Quealy J, Pushpavalli R, Krishnamurthy L, Kaur J, et al.
Salinity tolerance and ion accumulation in chickpea (Cicer arietinum L.)
subjected to salt stress. Plant Soil. 2013;365:347–61.
Genc Y, Oldach K, Gogel B, Wallwork H, McDonald GK, Smith AB.
Quantitative trait loci for agronomic and physiological traits for a bread
wheat population grown in environments with a range of salinity levels.
Mol Breed. 2013;32:39–59.
Nguyen VL, Ribot SA, Dolstra O, Niks RE, Visser RGF, Linden CG.
Identification of quantitative trait loci for ion homeostasis and salt tolerance
in barley (Hordeum vulgare L.). Mol Breed. 2013;31:137–52.
Arraouadi S, Badri M, Abdelly C, Huguet T, Aouani ME. QTL mapping of
physiological traits associated with salt tolerance in Medicago truncatula
recombinant inbred line. Genomics. 2012;99:118–25.
Hamwieh A, Xu D. Conserved salt tolerance quantitative trait loci (QTL) in
wild and cultivated soybean. Breeding Sci. 2008;58:355–9.
Thudi M, Gaur PM, Krishnamurthy L, Mir RR, Kudapa H, Fikre A, et al.
Genomics-assisted breeding for drought tolerance in chickpea. Funct Plant
Biol. 2014;41:1178–90.
Gaur PM, Thudi M, Srinivasan S, Varshney RK. Advances in chickpea genomics,
Legumes in the omic era 2014; />Varshney RK, Thudi M, Nayak SP, Gaur PM, Kashiwagi J, Krishnamurthy L,
et al. Genetic dissection of drought tolerance in chickpea (Cicer arietinum
L.). Theor Appl Genet. 2014;127:445–62.
Samineni S: Physiology, genetics and molecular mapping of salt tolerance
in chickpea (Cicer arietinum. L), ‘Ph D thesis, The University of Western
Australia’; (2010). Accessed
15 May 2014.
Vadez V, Krishnamurthy L, Thudi M, Anuradha C, Colmer TD, Turner NC,
et al. Assessment of ICCV 2 × JG 62 chickpea progenies shows sensitivity of
reproduction to salt stress and reveals QTL for seed yield and yield
components. Mol Breed. 2012;30:9–21.
Robinson HF. Quantitative genetics in relation to breeding on the
centennial of mendelism. Indian J Genet. 1966;26:71–187.
Thudi M, Bohra A, Nayak SN, Varghese N, Shah TM, Penmetsa RV, et al. Novel
SSR markers from BAC-end sequences, DArT arrays and a comprehensive
genetic map with 1,291 marker loci for chickpea (Cicer arietinum L.). PLoS One.
2011;6(11):e27275.
Hiremath PJ, Kumar A, Penmetsa RV, Farmer A, Schlueter JA, Chamarthi SK,
et al. Large-scale development of cost-effective SNP marker assays for diversity
assessment and genetic mapping in chickpea and comparative mapping in
legumes. Plant Biotech J. 2012;10(6):716–32.
Liu B, Fujita T, Yan Z, Sakamoto S, Xu D, Abe J. QTL mapping of domesticationrelated traits in soybean (Glycine max). Ann Bot. 2007;100:1027–38.
Tuteja N. Abscisic acid and abiotic stress signaling. Plant Signal Behav.
2007;2(3):135–8.
Qi X, Li MW, Xie M, Liu X, Ni M, Shao G, et al. Identification of a novel salt
tolerance gene in wild soybean by whole-genome sequencing. Nat
Commun. 2014;5:4340.
Zhou H, Zhao J, Yang Y, Chen C, Liu Y, Jin X, et al. Ubiquitin specific
protease16 modulates salt tolerance in Arabidopsis by regulating Na+/H+
antiport activity and serine hydroxymethyl transferase stability C. Plant Cell.
2012;24:5106–22.
Jaspers P, Blomster T, Brosche M, Salojarvi J, Ahlfors R, Vainonen JP, et al.
Unequally redundant RCD1 and SRO1 mediate stress and developmental
responses and interact with transcription factors. Plant J. 2009;60:268–79.
Swaify E, Pathak SAP, Rego TJ, Singh S. Soil measurement for optimized
productivity under rain fed conditions in the semi-arid tropics. Adv Soil Sci.
1985;1:1–64.
Page 14 of 15
26. Nayak SN, Zhu H, Varghese N, Datta S, Choi H-K, Horres R, et al. Integration
of novel SSR and gene-based SNP marker loci in the chickpea genetic map
and establishment of new anchor points with Medicago truncatula genome.
Theor Appl Genet. 2010;120:1415–41.
27. Van Ooijen JW. Join Map 4: software for the calculations of genetic linkage
maps in experimental populations. Kyazma B. V.: Wageningen; 2006.
28. Wang S, Basten CJ, Zeng ZB. Windows QTL cartographer 2.5. Department of
Statistics, North Carolina State University, Raleigh, NC. 2010.
/>29. Varshney RK, Mir RR, Bhatia S, Thudi M, Hu Y, Azam S, et al. Integrated
physical, genetic and genome map of chickpea (Cicer arietinum L.). Funct
Integr Genomics. 2014;14:59–73.
30. Varshney RK, Song C, Saxena RK, Azam S, Yu S, Sharpe AG, et al. Draft
genome sequence of chickpea (Cicer arietinum) provides a resource for trait
improvement. Nat Biotechnol. 2013;31:240–6.
31. Pu L, Liu M, Kim SY, Chen LO, Fletcher JC, Sung ZR. Embyonic flower 1 and
Ultrapetala1 act antagonistically on Arabidopsis development and stress
response. Plant Physiol. 2013;162:812–30.
32. Golldack D, Quigley F, Michalowski CB, Kamasani UR, Bohnert HJ.
Salinity stress-tolerant and -sensitive rice (Oryza sativa L.) regulate
AKT1-type potassium channel transcripts differently. Plant Mol Biol.
2003;51:71–81.
33. Chen Z, Hong X, Zhang H, Wang Y, Li X, Zhu JK, et al. Disruption of the
cellulose synthase gene, AtCesA8/IRX1, enhances drought and osmotic
stress tolerance in Arabidopsis. Plant J. 2005;43:273–83.
34. Ciftci-Yilmaz S, Morsy MR, Song L, Coutu A, Krizek BA, Lewis MW, et al. The
EAR-motif of the Cys2/His2-type zinc finger protein Zat7 plays a key role in
the defense response of Arabidopsis to salinity stress. J Biol Chem.
2007;282:9260–8.
35. Tiwari S, Schulz R, Iked Y, Dytham L, Bravo J, Mathers L, et al. Maternally
expressed PAB C- terminal, a novel imprinted gene in Arabidopsis, encodes
the conserved C-terminal domain of polyadenylate binding proteins. Plant
Cell. 2008;20:2387–98.
36. Rena Z, Zhenga Z, Chinnusamy V, Zhua J, Cuie X, Iidaa K, et al. RAS1, a
quantitative trait locus for salt tolerance and ABA sensitivity in Arabidopsis.
Proc Natl Acad Sci. 2010;107:5669–74.
37. Seo JS, Sohn HB, Noh K, Jung C, An JH, Donovan CM, et al. Expression of
the Arabidopsis AtMYB44 gene confers drought/salt-stress tolerance in
transgenic soybean. Mol Breed. 2012;29:601–8.
38. Titiz O, Tambasco-Studart M, Warzych E, Apel K, Amrhein N, Laloi C, et al.
PDX1 is essential for vitamin B6 biosynthesis, development and stress
tolerance in Arabidopsis. Plant J. 2006;48:933–46.
39. Guo WJ, Ho THD. An abscisic acid-induced protein, HVA22, inhibits
gibberellin-mediated programmed cell death in cereal aleurone cells. Plant
Physiol. 2008;147:1710–22.
40. Sperotto RA, Ricachenevsky FK, Duarte GL, BoV T, Lopes KL, Sperb ER, et al.
Identification of up-regulated genes in flag leaves during rice grain filling
and characterization of OsNAC5, a new ABA-dependent transcription factor.
Planta. 2009;230:985–1002.
41. Chinnusamy V, Schumaker K, Zhu JK. Molecular genetic perspectives on
cross-talk and specificity in abiotic stress signalling in plants. Crosstalk in
plant signal transduction Special Issue. J Exp Bot. 2004;395:225–36.
42. Ginzberg I, Barel G, Ophir R, Tzin E, Tanami Z, Muddarangappa T, et al.
Transcriptomic profiling of heat-stress response in potato periderm. J Exp
Bot. 2009;60(15):4411–21.
43. Verma P, Kaur H, Petla BP, Rao V, Saxena SC, Majee M. Protein Lisoaspartyl methyltransferase2 is differentially expressed in chickpea and
enhances seed vigor and longevity by reducing abnormal isoaspartyl
accumulation predominantly in seed nuclear proteins. Plant Physiol.
2013;161:1141–57.
44. Perrella G, Lopez-Vernaza MA, Carr C, Sani E, Gosselé V, Verduyn C, et al.
Histone deacetylase complex1 expression level titrates plant growth and
abscisic acid sensitivity in Arabidopsis. Plant Cell. 2013;25:3491–505.
45. Kumar S, Dhingra A, Daniell H. Plastid-expressed betaine aldehyde
dehydrogenase gene in carrot cultured cells, roots, and leaves confers
enhanced salt tolerance. Plant Physiol. 2004;136:2843–54.
46. Thu NBA, Hoang XLT, Nguyen TDH, Thao NP, Tran LSP. Differential
expression of two-component system–related drought-responsive genes in
two contrasting drought-tolerant soybean cultivars DT51 and MTD720
under well-watered and drought conditions. Plant Mol Biol Rep. 2014
doi:10.1007/s11105-014-0825-y; published online.
Pushpavalli et al. BMC Plant Biology (2015) 15:124
Page 15 of 15
47. Joshi V, Jander G. Arabidopsis methionine g-lyase is regulated according to
isoleucine biosynthesis needs but plays a subordinate role to threonine
deaminase. Plant Physiol. 2009;151:367–78.
48. Ma X, Sukiran NL, Ma H, Su Z. Moderate drought causes dramatic floral
transcriptomic reprogramming to ensure successful reproductive
development in Arabidopsis. BMC Plant Biol. 2014;14(164):1–16.
49. Dooki AD, Mayer-Posner FJ, Askari H, Zaiee A, Salekdeh GH. Proteomic
responses of rice young panicles to salinity. Proteomics. 2006;6:6498–507.
50. Ogawa T, Ishikawa K, Harada K, Fukusaki E, Yoshimura K, Shigeoka S.
Overexpression of an ADP-ribose pyrophosphatase, AtNUDX2, confers
enhanced tolerance to oxidative stress in Arabidopsis plants. Plant J.
2009;57:289–301.
51. Reddy VS, Ali GS, Reddy ASN. Genes encoding calmodulin binding proteins
in the Arabidopsis Genome. J Biol Chem. 2002;277:9840–52.
52. Javadmanesh S, Rahmani F, Pourakbar L. Effect of abiotic stresses on
histidine kinases gene expression in Zea mays L. cv. SC. 704. J Stress Physiol
Biochem. 2013;9:124–35.
53. Ulm R, Ichimura K, Mizoguchi T, Peck SC, Zhu T, Wang X, et al. Distinct
regulation of salinity and genotoxic stress responses by Arabidopsis MAP
kinase phosphatase 1. EMBO J. 2002;21(23):6483–93.
54. Lakhssassi N, Doblas VG, Rosado A, Valle AED, Pose D, Jimenez AJ, et al. The
Arabidopsis tetracopeptide thioredoxin-like gene family is required for osmotic
stress tolerance and male sporogenesis. Plant Physiol. 2012;158:1252–66.
55. Zhang Y, Mao L, Wang H, Brocker C, Yin X, Vasiliou V, et al. Genome-wide
identification and analysis of grape aldehyde dehydrogenase (ALDH) gene
superfamily. PLoS One. 2012;2:1–11.
56. Hua J, Grisafi P, Cheng SH, Fink GR. Plant growth homeostasis is controlled
by the Arabidopsis BON1 and BAP1 genes. Genes Dev. 2001;15:2263–72.
57. Biedermann S, Hellmann H. WD40 and CUL4-based E3 ligases: lubricating all
aspects of life. Trends Plant Sci. 2011;16:38–46.
58. Laxalt AM, Riet B, Verdonk JC, Parigi L, Tameling WIL, Vossen J, et al.
Characterization of five tomato phospholipase D cDNAs: rapid and specific
expression of LePLDb1 on elicitation with xylanase. Plant J. 2001;26(3):237–47.
59. Yonamine I, Yoshida K, Kido K, Nakagawa A, Nakayama H, Shinmyo A.
Overexpression of NtHAL3 genes confers increased levels of proline
biosynthesis and the enhancement of salt tolerance in cultured tobacco
cells. J Exp Bot. 2004;55:387–95.
60. Clark GB, Sessions A, Eastburn DJ, Roux SJ. Differential expression of
members of the annexin multigene family in Arabidopsis. Plant Physiol.
2001;126:1072–84.
61. Zörb C, Schmitt S, Neeb A, Karl S, Linder M, Schubert S. The biochemical
reaction of maize (Zea mays L.) to salt stress is characterized by a mitigation
of symptoms and not by a specific adaptation. Plant Sci. 2004;167:91–100.
62. Tasseva G, Richard L, Zachowski A. Regulation of phosphatidylcholine
biosynthesis under salt stress involves choline kinases in Arabidopsis
thaliana. FEBS Lett. 2004;566:115–20.
63. Lin TY, Chiou CY, Chiou SJ. Putative genes involved in saikosaponin
biosynthesis in Bupleurum species. Int J Mol Sci. 2013;14:12806–26.
64. Aken OV, Pecenkova T, Cotte B, Rycke RD, Eeckhout D, Fromm H, et al.
Mitochondrial type-I prohibitins of Arabidopsis thaliana are required for
supporting proficient meristem development. Plant J. 2007;52:850–64.
65. Pushpavalli R, Quealy J, Colmer TD, Turner NC, Siddique KHM, Rao MV and
Vadez V. Salt Stress Delayed Flowering and Reduced Reproductive Success
of Chickpea (Cicer arietinum L.), A Response Associated with Na +
Accumulation in Leaves. J Agron Crop Sci. 2015: doi:10.1111/jac.12128.
Submit your next manuscript to BioMed Central
and take full advantage of:
• Convenient online submission
• Thorough peer review
• No space constraints or color figure charges
• Immediate publication on acceptance
• Inclusion in PubMed, CAS, Scopus and Google Scholar
• Research which is freely available for redistribution
Submit your manuscript at
www.biomedcentral.com/submit