Diffraction evidence for the structure of cellulose microfibrils in bamboo, a model for grass and cereal celluloses
Bạn đang xem bản rút gọn của tài liệu. Xem và tải ngay bản đầy đủ của tài liệu tại đây (687.19 KB, 7 trang )
Thomas et al. BMC Plant Biology (2015) 15:153
DOI 10.1186/s12870-015-0538-x
RESEARCH ARTICLE
Open Access
Diffraction evidence for the structure of
cellulose microfibrils in bamboo, a model
for grass and cereal celluloses
Lynne H. Thomas1, V. Trevor Forsyth2,3, Anne Martel2, Isabelle Grillo2, Clemens M. Altaner4 and Michael C. Jarvis5*
Abstract
Background: Cellulose from grasses and cereals makes up much of the potential raw material for biofuel
production. It is not clear if cellulose microfibrils from grasses and cereals differ in structure from those of other
plants. The structures of the highly oriented cellulose microfibrils in the cell walls of the internodes of the bamboo
Pseudosasa amabilis are reported. Strong orientation facilitated the use of a range of scattering techniques.
Results: Small-angle neutron scattering provided evidence of extensive aggregation by hydrogen bonding through
the hydrophilic edges of the sheets of chains. The microfibrils had a mean centre-to-centre distance of 3.0 nm in
the dry state, expanding on hydration. The expansion on hydration suggests that this distance between centres
was through the hydrophilic faces of adjacent microfibrils. However in the other direction, perpendicular to the
sheets of chains, the mean, disorder-corrected Scherrer dimension from wide-angle X-ray scattering was 3.8 nm. It
is possible that this dimension is increased by twinning (crystallographic coalescence) of thinner microfibrils over part
of their length, through the hydrophobic faces. The wide-angle scattering data also showed that the microfibrils had a
relatively large intersheet d-spacing and small monoclinic angle, features normally considered characteristic of
primary-wall cellulose.
Conclusions: Bamboo microfibrils have features found in both primary-wall and secondary-wall cellulose, but are
crystallographically coalescent to a greater extent than is common in celluloses from other plants. The extensive
aggregation and local coalescence of the microfibrils are likely to have parallels in other grass and cereal species
and to influence the accessibility of cellulose to degradative enzymes during conversion to liquid biofuels
Keywords: WAXS, WANS, SANS, Crystallinity, Aggregation, Cellulase
Background
Cellulose comprises long microfibrils, each a few nm in
diameter and containing some tens of glucan chains.
The structure of cellulose microfibrils, partially crystalline and partially disordered, is not fully known [1]. Cellulose from cereal crop residues and from grasses like
Miscanthus is a sustainable starting point for biofuels [2]
and, increasingly, for bio-based chemical manufacturing
[3]. The conversion of cellulose to useful products can
be achieved by enzymatic depolymerisation [4] and is
inhibited by lignification, by incompletely understood
* Correspondence:
5
School of Chemistry, Glasgow University, Glasgow G12 8QQ, UK
Full list of author information is available at the end of the article
features of microfibril structure and by aggregation of
the microfibrils [5,6].
Evidence has emerged, first from 13C NMR spectroscopy [7-9] and more recently from other spectroscopic
and scattering technologies [10-15], for partially ordered
cellulose microfibrils no more than about 3 nm in diameter. Cellulose microfibrils of that size have been reported from unlignified primary cell walls [13,15] and
from gymnosperm xylem, which is dominated by lignified secondary cell walls [7,10,16], although cotton, flax
and certain other materials composed of relatively pure
cellulose contain thicker microfibrils [14,17,18]. A 3 nm
microfibril is too thin to accommodate the 36 chains
formerly assumed to be present in microfibrils emerging
from the 6-membered ‘rosette’ responsible for cellulose
biosynthesis [19]. Recently, based on spectroscopic and
© 2015 Thomas et al. This is an Open Access article distributed under the terms of the Creative Commons Attribution License
( which permits unrestricted use, distribution, and reproduction in any medium,
provided the original work is properly credited. The Creative Commons Public Domain Dedication waiver (http://
creativecommons.org/publicdomain/zero/1.0/) applies to the data made available in this article, unless otherwise stated.
Thomas et al. BMC Plant Biology (2015) 15:153
Results
Scattered X-ray intensity
A
B
0
90
180
270
4
delta q
360
C
3
Scattered X-ray intensity
scattering evidence, partially ordered 18- and 24-chain
models have been suggested for mung bean, celery and
spruce wood cellulose [10,13,15]. In primary cell walls,
microfibrils of approximately this size may be stacked or
‘twinned’ along part of their length, cohering through
the hydrophobic [200] crystal face so that the mean lateral dimension is slightly increased in that direction
[15,20]. An 18-chain microfibril model with some ‘twinning’ of this nature appeared to fit the X-ray and NMR
data for mung bean primary-wall cellulose [13]. It is not
clear whether similar microfibril structures are present
in grass and cereal celluloses dominated by lignified secondary walls, for which the most detailed recent model
is the flattened-hexagonal, 36-chain structure proposed
on AFM evidence for the cellulose of corn stover [19].
It would therefore be of interest to examine the structure of cellulose microfibrils in a grass or cereal species,
using the scattering methods that have led to models
with less than 36 chains for the microfibrils of nongraminaceous plants. A technical problem is that some
of these methods require very well-oriented microfibrils
[15]. Highly uniform cellulose orientation is not a wellestablished feature of most grass and cereal tissues.
Bamboo cellulose, however, is particularly well-oriented
[21,22]. This feature is responsible for the high stiffness
of some bamboo species [22], and its adoption as an engineering material both as intact canes and as the fibre
component in biocomposites [23]. In other respects
bamboos are typical, if overgrown, grasses [24,25]. Here
we report evidence for cellulose microfibril structure in
the commercially important bamboo species Pseudosasa
amabilis (Tonkin cane).
Page 2 of 7
2
200
1
D
0
0
1000
q2d
1-10 110
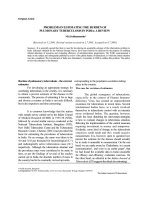
Wide-angle X-ray scattering (WAXS)
Intact internode tissue from mature bamboo stems gave
a well-oriented fibre diffraction pattern (Figs. 1a and a).
In the azimuthal direction it was possible to dissect the
orientation distribution into a wide and a narrow component (Fig. 1a), corresponding perhaps to different cellwall layers [21] or to different cell types within the
vascular bundles. In the radial direction, the backgroundcorrected equatorial profile obtained with Cu Kα radiation
is shown in Fig. 1c. It resembled that observed [22] for
bamboo cellulose and had some similarities to the corresponding profile for spruce wood [10]. However the
200 reflection was narrower and at slightly lower q than
for spruce wood implying a mean intersheet spacing
(0.403 nm +/− 0.001 nm from three diffraction patterns
using both Cu and Mo radiation) about 3 % wider than
in spruce cellulose. The 1–10 and 110 reflections were
strongly overlapped, implying a smaller monoclinic
angle than in wood or in the published cellulose Iβ
structure [26]. The mean best-fit monoclinic angle was
0
5
10
15
q, nm-1
20
25
Fig. 1 a WAXS pattern from bamboo cellulose using Cu Kα radiation.
The fibre axis is vertical. b Microfibril orientation from the azimuthal
distribution of the 200 reflection. Dotted lines show fitted wide and
narrow components. c Background-corrected equatorial reflections.
d Plot of integral width δq against q2d for the principal equatorial
reflections. The integral widths of the 1–10 and 110 reflections lie well
above the line projected through the integral widths of the 200 and
400 reflections
92°, although this parameter was difficult to estimate
because broadening and overlap of the 1–10 and 110
reflections made them hard to distinguish from one another. The wide intersheet spacing and small monoclinic angle match the observations of Driemeier et al.
[27] on sugar cane cellulose.
Thomas et al. BMC Plant Biology (2015) 15:153
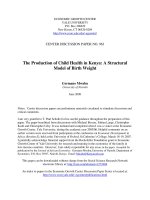
Wide-angle neutron scattering (WANS)
Wide-angle neutron scattering patterns were recorded
from bamboo with and without prior equilibration with
D2O to exchange surface hydroxyl groups. In cellulose
Iβ, complete deuteration (which requires much more extreme conditions) slightly increases the relative intensity
of the 200 reflection and greatly decreases the relative
intensity of the 1–10 reflection [26]. Since the cellulose
Iβ lattice is too close-packed to be permeable to H2O or
D2O, any difference between the H and D diffraction
patterns (Fig. 2) may be concluded to be derived from
hydroxyl groups that were accessible to D2O and located
either at the surface of the microfibrils, or in disordered
internal regions, or in any hemicellulose segments that
might be ordered enough to adopt the same chain conformation as cellulose.
The 200 reflection was at essentially the same position
before and after deuteration, so that the difference diffraction pattern (Fig. 2) showed only the increase in
intensity. The width of the 200 reflection was slightly
less than was observed by WAXS implying, if anything,
Scattered neutron intensity
A
0
5
10
15
20
q, nm-1
001
Scattered neutron intensity
Wide intersheet spacing and a small monoclinic angle
are features normally associated with primary-wall celluloses [13,15,28], but the radial width of the equatorial reflections from bamboo cellulose was considerably less
than has been observed from primary-wall celluloses, indicating either greater crystallite dimensions or less disorder. Separating the disorder-related and size-related
components of broadening as described by [10,14] gave
a Scherrer dimension (mean column length) of 3.84 nm
± 0.13 nm (n = 3) perpendicular to the [200] lattice plane
and a value of 0.036 ± 0.001 for the disorder parameter
g. This value of g is in agreement with other cellulosic
materials but the Scherrer dimension is greater than was
found for spruce wood or primary-wall cellulose [10,14].
The [200] Scherrer dimension calculated here was also
greater than was estimated previously for bamboo cellulose [22], as expected because of the allowance made
here for disorder-related broadening. Broadening of the
1–10 and 110 reflections was difficult to quantify because of the strong overlap between them and because
their broadening appeared to be less asymmetric than
that of the 200 reflection. With the best-fit value of the
monoclinic angle they were clearly substantially wider at
half height than the 200 reflection, implying shorter
dimensions and/or higher disorder in these crystallographic directions.
An unusual feature of the equatorial scattering profile
from this well-oriented bamboo cellulose was the presence of a weak 100 shoulder close to q = 8 nm−1, which
might indicate an anomaly in intersheet stagger, or the
spacing between alternate sheets of chains exposed at a
[010] face of the microfibril.
Page 3 of 7
002
004
B
0
5
10
15
20
q,
25
nm-1
Fig. 2 WANS pattern from bamboo cellulose, with and without
deuteration. a Background-corrected equatorial reflections. Inset: the
two-dimensional WANS pattern from bamboo in the H form. The
fibre axis is vertical. b Reflections on the fibre axis. Closed circles: D
form. Open circles: H form. Thin line: difference D-H. Dotted line:
fitted equatorial profile
a slightly greater Scherrer dimension perpendicular to
the sheets of chains. However the absence of a 400 reflection with measureable intensity in WANS prevented
the calculation of a disorder correction.
The negative value of the 1–10 reflection (q = 11 nm−1)
in the D-H difference diffraction pattern allowed its position to be established and differentiated from the overlapping 110 reflection. Fitting the H and D diffraction
patterns on the hypothesis that the 1–10 and 110 reflections were unaltered in q by deuteration, the best-fit spacing implied a monoclinic angle of 94°, in reasonable
agreement with the best-fit value of the monoclinic angle
from WAXS. The equatorial part of the WANS pattern
Thomas et al. BMC Plant Biology (2015) 15:153
was thus consistent with the same lateral d-spacings for
the domains accessible to deuteration as for the inaccessible domains, implying a surface location for the majority
of the deuteration. D2O-accessible regions within the microfibrils, if abundant, would require looser chain packing
which was not observed.
The signal:noise ratio in WANS was insufficient for
the 100 reflection to be distinguished. On the fibre axis,
the 001 and 002 reflections were observed only after
deuteration (Fig. 2b), implying that there was some irregularity in the longitudinal stagger of the accessible
chains exposed at the surfaces of the microfibrils.
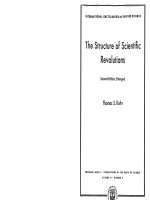
Small-angle neutron scattering (SANS)
When cellulose microfibrils aggregate together with any
regularity, Bragg scattering (diffraction) at small angles
can be observed from the arrayed microfibrils themselves, in addition to the wide-angle scattering from the
crystal planes within the microfibrils [12]. In woody materials if the microfibrils are in close contact, there will
be insufficient matrix material between them to provide
the contrast for small-angle Bragg scattering of X-rays.
However if the microfibrils can be forced apart by D2O
there is intense neutron scattering contrast between the
D2O and the cellulose, as can be seen at low q in Fig. 2a.
Starting from bamboo saturated with D2O, the D2O content was progressively reduced to zero in the absence of
H2O. Considerable SANS contrast remained at zero
D2O content (Fig. 3a) due to exchange of hydroxyl
groups on cellulose surfaces [15] or hemicelluloses. As
the D2O content was reduced the small-angle Bragg
peak moved to higher q, implying that on drying the
nominal centre-to-centre spacing of the microfibrils narrowed from 3.19 nm at 25 % D2O to 2.96 nm at 0 %
D2O (Fig. 3c). It may be assumed that the centre-tocentre spacing at 0 % D2O corresponds to microfibrils
touching one another and is therefore equal to the
microfibril diameter. After drying the remaining deuterium atoms were on hydroxyl groups, not water molecules. It is therefore likely that it was contact through
the hydrophilic faces of the microfibrils that gave rise to
the small-angle Bragg scattering, not through the 200
faces suggested as the sites of microfibril coalescence
(twinning).
No small-angle Bragg peak was observed from bamboo
equilibrated with 35 % D2O: 65 % H2O. A mixture of
D2O and H2O in these proportions matches the cellulose scattering length density and thus gives zero contrast between the liquid phase and cellulose [12]. This
observation showed that the spacing observed was indeed between cellulose microfibrils, not lignin or some
other feature of the cell-wall structure of bamboo, such
as arabinoxylans. The d-spacings shown in Fig. 3b do
not necessarily correspond to any form of global mean,
Page 4 of 7
because the scattering contrast is likely to be greatest
when the microfibrils are just far enough apart to permit
D2O to enter between them: wider spacings are probably
too irregular for strong Bragg scattering. The Bragg
peaks observed in D2O were broad, indicating that only
a few microfibrils were packed laterally together, or that
the packing was disordered, or most probably both.
Discussion
The wide-angle and small-angle scattering patterns and
NMR spectra for bamboo cellulose resembled those
from wood and dicot primary cell walls in many respects, but there were interesting differences. Although
bamboo internodes can certainly be called woody, with
secondary wall layers and strong lignification [21] the
unit cell parameters of the crystalline cellulose fraction
resembled those of primary cell walls, with a small monoclinic angle and relatively large intersheet [200] d-spacing.
Essentially the same intersheet d-spacing was measured
by neutron scattering when the accessible cellulose chains
were deuterated. This observation strongly suggests that
most of the D2O-accessible cellulose chains were at the
microfibril surface rather than buried in the interior, since
the chain packing appeared to be as tight as in other crystalline celluloses into which water cannot penetrate.
The diameters of cellulose microfibrils have often been
estimated on the assumption that they are approximately
as wide as they are high [10], although the AFM study of
Ding and Himmel [19] suggested that maize primarywall microfibrils were about 3 nm high perpendicular to
the [200] plane and 3.6 nm wide parallel to the [200]
plane. The different techniques used here provide information on microfibril dimensions in each lateral
direction. The Scherrer dimension obtained by WAXS
after disorder correction was 3.8 nm perpendicular to
the [200] plane, and the WANS data implied that
3.8 nm was not an overestimate in this direction.
Bamboo microfibrils, therefore, are substantially larger
in this dimension, on average, than microfibrils of softwood [10] or dicot primary-wall cellulose [13,15]. The
WAXS data suggested smaller lateral dimensions in
other directions, but this inference was not quantitative because the disorder correction was difficult to
apply to broadening of the 1–10 and 110 reflections.
The mean centre-to centre distance of 3.0 nm, estimated from the position of the SANS coherent scattering peak, must include hydrogen-bonding cellulose
surfaces that deuterate to provide the SANS contrast.
This distance cannot therefore be perpendicular to the
[200] plane; it could be parallel or diagonal to that
plane depending on which crystal faces form the
boundaries of the microfibril. A mean sheet width of
three chains, giving a mean dimension of about 3 nm
in that direction, would be consistent with the WAXS
Thomas et al. BMC Plant Biology (2015) 15:153
Page 5 of 7
Fig. 3 SANS of bamboo cellulose, hydrated to varying extents with
D2O. a Two-dimensional scattering pattern at 25 % D2O. The fibre
axis is vertical. b Radial distribution of equatorial SANS intensity as a
function of D2O content, with small-angle Bragg peak in the region
of q = 2 nm−1. c Effect of hydration with D2O on the d-spacing
between microfibrils, calculated from the q value of the Bragg peak
A
data on the assumption that there was substantial disorder at the hydrophilic faces of the microfibril Fig. 4.
A cellulose chain within the Iβ crystal structure occupies 0.32 nm2 in cross-section [26] or 0.33 nm2 with the
slightly larger d-spacings found for bamboo. This crosssectional area would suggest that the observed microfibril
dimensions, 3.8 nm perpendicular to the sheets of chains
and 3.0 nm across the sheets, would allow space for about
34 chains. However the irregular hydrophilic surfaces of
the microfibrils mean that fewer chains can be fitted
within these overall dimensions. Based on microfibril
models similar to those suggested for spruce cellulose [10]
the number of chains would be about 26–30 depending
on the detailed shape of the microfibrils. That would be
consistent with the 18-chain model proposed for mung
bean primary-wall cellulose [13] only if there were a much
greater extent of ‘stacking’ or ‘twinning’ in which two 18chain microfibrils coalesce through the [200] faces for part
of their length. The suggested dimensions and this pattern
of coalescence and divergence recall the AFM observations by Ding and Himmel [19] on the microfibrils of
maize primary cell walls, but with the crystal lattice turned
through 90°. AFM methods give no indication of the
orientation of the lattice planes. It should be stressed that
only averaged dimensions can be derived from our data,
and the dimension obtained by SANS is not a true
D2O content
B
25%
Scattered neutron intensity
15%
10%
0%
35% D2O / 65% H2O (Cellulose match)
0
1
2
3
q, nm-1
microfibril d-spacing, nm
3.25
3.20
C
3.8 nm
3.15
3.10
3.05
3.0 nm
in dry state, moving
apart on hydration
3.00
2.95
0%
10%
20%
D2O content
30%
Fig. 4 Proposed average dimensions for microfibrils of bamboo
cellulose, from WAXS (vertical dimension) and SANS (horizontal
spacing). Each of the microfibrils is shown with the (200) lattice
plane, corresponding to the orientation of the sheets of
hydrogen-bonded chains, horizontal. The elliptical shape of the
microfibrils as shown is merely diagrammatic, avoiding assumptions
about which lattice planes are exposed at the surface
Thomas et al. BMC Plant Biology (2015) 15:153
average. The data of Wang et al. [22] on local crystallographic variability between bamboo cell walls, the developmental variation in maize recorded by Zhang et al. [29]
and the intricate aggregation of maize microfibrils imaged
by Ding and Himmel [19], show that averaged dimensions
may conceal complex local patterns of variation. The
‘twinning’ or ‘stacking’ (crystallographic coalescence)
phenomenon proposed by Newman et al. [13] and
Thomas et al. [15] may be sufficient to provide a large
part of this variation without assuming heterogeneity
in the structures of microfibrils extruded by the terminal complexes that carry out their biosynthesis [30].
Aggregation of cellulose microfibrils in bamboo and in
other monocotyledonous species [19,22] appears to involve contact with and without crystalline coalescence.
How such aggregation interferes with the access of cellulases to the cellulose surfaces that they attack, and how
chemical pretreatments impact on the extent of microfibril aggregation [6], are questions that deserve closer
attention during the development of enzymatic processes for manufacturing biofuels and bio-based materials from grass and cereal biomass.
Conclusions
The microfibrils of bamboo cellulose, although derived
mainly from secondary cell walls, resembled the primarywall celluloses of other plants in having relatively wide
inter-sheet spacing and small monoclinic angle. The mean
microfibril diameter was 3.8 nm perpendicular to the
sheets of chains, unusually large for a woody material but
consistent with fusion of pairs of smaller microfibrils over
part of their length. The bamboo microfibrils were also
loosely aggregated into bundles with a limited degree of
regularity in spacing. D2O was able to penetrate into the
microfibril bundles, increasing the microfibril spacing as
hydration progressed.
Methods
Page 6 of 7
D2O:H2O, the contrast match composition for cellulose, and then equilibrated with phosphorus pentoxide
to dry to a predetermined weight. The samples were
immediately sealed in an aluminium foil package
15 mm square. At least 1 h was then allowed for internal equilibration of moisture [10]. An empty foil
container was used as background.
Wide-angle X-ray scattering (WAXS)
X-ray diffraction patterns were obtained at ambient
temperature using a Rigaku R-axis/RAPID image plate
diffractometer. Both Cu Kα (λ = 0.15406 nm, one sample)
and Mo (λ = 0.7071 nm, two samples) sources were used,
with the beam collimated to a diameter of 0.5 mm. Scattering angles were expressed as q = 4πsinθ/λ. Samples
were 1 mm thick in the direction parallel to the beam and
their other dimensions exceeded the beam diameter. The
diffraction patterns were collected in perpendicular transmission mode. Radial profiles of scattered intensity I as a
function of q were integrated over azimuthal angles of 2°
using the AreaMax software package (Rigaku/MSC,
Tokyo). Background correction was carried out as described [10]. Each tangential profile was fitted by a dual
Gaussian function and the narrower of the two Gaussians
was used to reconstruct the equatorial radial profile [14].
In the radial direction, the overlapping 1–10 and 110 reflections were fitted by two Gaussian functions and the
200 reflection was fitted by an asymmetric function F(q)
constructed as follows: when q > the point of maximum
intensity q0, F(q) = F0(q), a simple Gaussian function.
When q < q0, F(q) = F0(q)(1 + 0.1(q - q0)2). It was assumed
that the integral width δq of F0(q) was controlled by both
disorder and the column length of the crystallite, so that
δq = δq 0 + π/2 g2q2d, where g is the non-asymmetric disorder parameter and d is the lattice spacing. Then a plot
of integral width δq against q2d is linear with, at the
intercept, the Scherrer dimension (mean column length)
L = 2π/δq0 [10].
Material
Tonkin cane (Pseudosasa amabilis) internodes were split
and the interior removed to leave strips of the outer tissue approximately 2 mm wide × 1 mm deep.
Small-angle neutron scattering (SANS)
SANS analysis was conducted on the high-flux beamline
D33 at the Institut Laue-Langevin (ILL), Grenoble.
The neutron beam had a wavelength λ = 3.5 Å with
spread Δλ/λ = 10 %, and was passed through a 2.8 m
long collimator tube. Sample-to-detector distance was
2 m. The q range covered in this experiment extended
from 0.4 nm−1 to 2.8 nm−1. A number of bamboo segments about 1 mm thick were placed side by side to
give a sheet wider than the beam diameter. The bamboo segments were saturated with H2O, D2O or 35:65
Wide-angle neutron scattering (WANS)
Bamboo samples were prepared as for SANS at 25 %
H2O or D2O content, sufficient to saturate the cell walls
without filling the cell lumina. WANS analysis was conducted on beamline D19 at the ILL. Beamline D19 has a
four-circle diffractometer with a cylindrical detector
consisting of a 256 × 640 array of gas-filled cells giving
an aperture 30° vertically × 120° horizontally. The neutron beam was monochromated to a wavelength of
2.42 Å and the sample-to-detector distance, taken to the
electrode plane in each cell at the equator, was 756 mm.
The response for each cell of the detector was calibrated
using the isotropic incoherent neutron scattering from a
vanadium rod, and blank-corrected using an empty aluminium foil container.
Thomas et al. BMC Plant Biology (2015) 15:153
The absorption coefficient of the sample along the
beam axis was calculated from absorption coefficients
based on the elemental composition. Absorption factors
at all angles within the aperture of the detector were
then calculated using in-house software based on the
integrated path length through the sample, which was
assumed to have cuboidal geometry and was wider than
the neutron beam. The fibre axis was tilted such that the
full widths of the 001, 002, 003 and 004 reflections were
collected. In-house software was then used to reconstruct the data into reciprocal space and to join together
the component images of the diffraction pattern. The
combined images were exported into Fit2D, where radial
intensity profiles integrated over 10° in azimuth were
calculated in the equatorial and meridional directions.
Abbreviations
NMR: Nuclear Magnetic Resonance; WAXS: Wide-angle X-ray Scattering;
WANS: Wide-angle Neutron Scattering; SANS: Small-angle Neutron Scattering;
AFM: Atomic Force Microscopy; gg: gauche-gauche; gt: gauche-trans;
tg: trans-gauche.
Competing interests
The authors declare no competing interests.
Authors’ contributions
LHT carried out the X-ray scattering experiments, participated in the neutron
scattering experiments and analysed much of the data. VTF supervised the
running of the WANS experiments and data analysis. AM and IG supervised
the running of the SANS experiments and data analysis. CMA participated in
the interpretation of the results. MCJ carried out some of the data analysis and
drafted the manuscript and all authors read and approved the final version.
Acknowledgements
We thank the Institut Laue-Langevin for the award of neutron beamtime.
Author details
Department of Chemistry, University of Bath, Claverton Down, Bath BA2
7AY, UK. 2Institut Laue-Langevin, Grenoble Cedex 9 38042, France. 3EPSAM/
ISTM, Keele University, Staffordshire ST5 5BG, UK. 4New Zealand School of
Forestry, University of Canterbury, Christchurch 4180, New Zealand. 5School
of Chemistry, Glasgow University, Glasgow G12 8QQ, UK.
1
Received: 12 February 2015 Accepted: 10 March 2015
References
1. Nishiyama Y, Johnson GP, French AD, Forsyth VT, Langan P. Neutron
crystallography, molecular dynamics, and quantum mechanics studies of
the nature of hydrogen bonding in cellulose I-beta. Biomacromolecules.
2008;9:3133–40.
2. Carroll A, Somerville C. Cellulosic biofuels. Annu Rev Plant Biol. 2009;60:165–82.
3. Klemm D, Kramer F, Moritz S, Lindstrom T, et al. Nanocelluloses: a new
family of Nature-based materials. Angewandte Chemie-International Edition.
2011;50:5438–66.
4. Himmel ME, Ding S-Y, Johnson DK, Adney WS, et al. Biomass recalcitrance:
Engineering plants and enzymes for biofuels production. Science.
2007;315:804–7.
5. Chundawat SPS, Bellesia G, Uppugundla N, Sousa LD, et al. Restructuring
the crystalline cellulose hydrogen bond network enhances Its
depolymerization rate. J Am Chem Soc. 2011;133:11163–74.
6. Ding S-Y, Liu Y-S, Zeng Y, Himmel ME, et al. How does plant cell wall
nanoscale architecture correlate with enzymatic digestibility? Science.
2012;338:1055–60.
7. Newman RH. Estimation of the relative proportions of cellulose I alpha and I
beta in wood by carbon-13 NMR spectroscopy. Holzforschung.
1999;53:335–40.
Page 7 of 7
8.
9.
10.
11.
12.
13.
14.
15.
16.
17.
18.
19.
20.
21.
22.
23.
24.
25.
26.
27.
28.
29.
30.
Sturcova A, His I, Apperley DC, Sugiyama J, Jarvis MC. Structural details of
crystalline cellulose from higher plants. Biomacromolecules. 2004;5:1333–9.
Wickholm K, Larsson PT, Iversen T. Assignment of non-crystalline forms in
cellulose I by CP/MAS C-13 NMR spectroscopy. Carbohydr Res.
1998;312:123–9.
Fernandes AN, Thomas LH, Altaner CM, Callow P, et al. Nanostructure of
cellulose microfibrils in spruce wood. Proc Natl Acad Sci U S A.
2011;108:E1195–203.
Jakob HF, Fengel D, Tschegg SE, Fratzl P. The elementary cellulose fibril in
Picea abies: Comparison of transmission electron microscopy, small-angle
X-ray scattering, and wide-angle X-ray scattering results. Macromolecules.
1995;28:8782–7.
Kennedy CJ, Cameron GJ, Sturcova A, Apperley DC, et al. Microfibril
diameter in celery collenchyma cellulose: X-ray scattering and NMR
evidence. Cellulose. 2007;14:235–46.
Newman RH, Hill SJ, Harris PJ. Wide-angle X-ray scattering and solid-state
nuclear magnetic resonance data combined to test models for cellulose
microfibrils in mung bean cell walls. Plant Physiol. 2013;163:1558–67.
Thomas LH, Altaner CM, Jarvis MC. Identifying multiple forms of lateral
disorder in cellulose fibres. J Appl Crystallogr. 2013;46:972–9.
Thomas LH, Forsyth VT, Sturcova A, Kennedy CJ, et al. Structure of cellulose
microfibrils in primary cell walls from collenchyma. Plant Physiol.
2013;161:465–76.
Xu P, Donaldson LA, Gergely ZR, Staehelin LA. Dual-axis electron tomography:
a new approach for investigating the spatial organization of wood cellulose
microfibrils. Wood Sci Technol. 2007;41:101–16.
Clair B, Almeras T, Pilate G, Jullien D, et al. Maturation stress generation in
poplar tension wood studied by synchrotron radiation microdiffraction.
Plant Physiol. 2011;155:562–70.
Moharir AV, Kiekens P. Cellulose crystallite sizes in diploid and tetraploid
native cotton. J Appl Polym Sci. 1998;68:2107–12.
Ding SY, Himmel ME. The maize primary cell wall microfibril: A new model
derived from direct visualization. J Agric Food Chem. 2006;54:597–606.
Newman RH, Redgwell RJ. Cell wall changes in ripening kiwifruit: C-13 solid
state NMR characterisation of relatively rigid cell wall polymers. Carbohydr
Polym. 2002;49:121–9.
Crow E, Murphy RJ. Microfibril orientation in differentiating and maturing
fibre and parenchyma cell walls in culms of bamboo (Phyllostachys viridiglaucescens (Carr.) Riv. & Riv.). Bot J Linn Soc. 2000;134:339–59.
Wang Y, Leppanen K, Andersson S, Serimaa R, et al. Studies on the
nanostructure of the cell wall of bamboo using X-ray scattering. Wood Sci
Technol. 2012;46:317–32.
Liu D, Song J, Anderson DP, Chang PR, Hua Y. Bamboo fiber and its
reinforced composites: structure and properties. Cellulose. 2012;19:1449–80.
Lybeer B, Koch G. A topochemical and semiquantitative study of the
lignification during ageing of bamboo culms (Phyllostachys
viridiglaucescens). IAWA Journal. 2005;26:99–109.
Lybeer B, VanAcker J, Goetghebeur P. Variability in fibre and parenchyma
cell walls of temperate and tropical bamboo culms of different ages. Wood
Sci Technol. 2006;40:477–92.
Nishiyama Y, Langan P, Chanzy H. Crystal structure and hydrogen-bonding
system in cellulose 1 beta from synchrotron X-ray and neutron fiber
diffraction. J Am Chem Soc. 2002;124:9074–82.
Driemeier C, Santos WD, Buckeridge MS. Cellulose crystals in fibrovascular
bundles of sugarcane culms: orientation, size, distortion, and variability.
Cellulose. 2012;19:1507–15.
Dinand E, Chanzy H, Vignon MR. Suspensions of cellulose microfibrils from
sugar beet pulp. Food Hydrocoll. 1999;13:275–83.
Zhang QS, Cheetamun R, Dhugga KS, Rafalski JA, et al. Spatial gradients in
cell wall composition and transcriptional profiles along elongating maize
internodes. BMC Plant Biol. 2014;14–27.
Slabaugh E, Davis JK, Haigler CH, Yingling YG, Zimmer J. Cellulose synthases:
new insights from crystallography and modeling. Trends in Plant Science,
2014;14:99–106.