The striking and unexpected cytogenetic diversity of genus Tanacetum L. (Asteraceae): A cytometric and fluorescent in situ hybridisation study of Iranian taxa
Bạn đang xem bản rút gọn của tài liệu. Xem và tải ngay bản đầy đủ của tài liệu tại đây (3.11 MB, 16 trang )
Olanj et al. BMC Plant Biology (2015) 15:174
DOI 10.1186/s12870-015-0564-8
RESEARCH ARTICLE
Open Access
The striking and unexpected cytogenetic
diversity of genus Tanacetum L. (Asteraceae): a
cytometric and fluorescent in situ hybridisation
study of Iranian taxa
Nayyereh Olanj1,2, Teresa Garnatje3, Ali Sonboli4, Joan Vallès2 and Sònia Garcia2*
Abstract
Background: Although karyologically well studied, the genus Tanacetum (Asteraceae) is poorly known from the
perspective of molecular cytogenetics. The prevalence of polyploidy, including odd ploidy warranted an extensive
cytogenetic study. We studied several species native to Iran, one of the most important centres of diversity of the
genus. We aimed to characterise Tanacetum genomes through fluorochrome banding, fluorescent in situ
hybridisation (FISH) of rRNA genes and the assessment of genome size by flow cytometry. We appraise the effect of
polyploidy and evaluate the existence of intraspecific variation based on the number and distribution of GC-rich
bands and rDNA loci. Finally, we infer ancestral genome size and other cytogenetic traits considering phylogenetic
relationships within the genus.
Results: We report first genome size (2C) estimates ranging from 3.84 to 24.87 pg representing about 11 % of those
recognised for the genus. We found striking cytogenetic diversity both in the number of GC-rich bands and rDNA loci.
There is variation even at the population level and some species have undergone massive heterochromatic or rDNA
amplification. Certain morphometric data, such as pollen size or inflorescence architecture, bear some relationship with
genome size. Reconstruction of ancestral genome size, number of CMA+ bands and number of rDNA loci show that
ups and downs have occurred during the evolution of these traits, although genome size has mostly increased and
the number of CMA+ bands and rDNA loci have decreased in present-day taxa compared with ancestral values.
Conclusions: Tanacetum genomes are highly unstable in the number of GC-rich bands and rDNA loci, although some
patterns can be established at the diploid and tetraploid levels. In particular, aneuploid taxa and some odd ploidy
species show greater cytogenetic instability than the rest of the genus. We have also confirmed a linked rDNA
arrangement for all the studied Tanacetum species. The labile scenario found in Tanacetum proves that some
cytogenetic features previously regarded as relatively constant, or even diagnostic, can display high variability,
which is better interpreted within a phylogenetic context.
Keywords: 5S, 35S, Aneuploidy, Evolutionary cytogenetics, Genomic instability, L-type arrangement, Polyploidy,
Odd ploidy, Ribosomal DNA
* Correspondence:
2
Laboratori de Botànica – Unitat associada CSIC, Facultat de Farmàcia,
Universitat de Barcelona, Avinguda Joan XXIII s/n, 08028 Barcelona, Catalonia,
Spain
Full list of author information is available at the end of the article
© 2015 Olanj et al. This is an Open Access article distributed under the terms of the Creative Commons Attribution License
( which permits unrestricted use, distribution, and reproduction in any medium,
provided the original work is properly credited. The Creative Commons Public Domain Dedication waiver (http://
creativecommons.org/publicdomain/zero/1.0/) applies to the data made available in this article, unless otherwise stated.
Olanj et al. BMC Plant Biology (2015) 15:174
Background
Tanacetum L. is a genus of the family Asteraceae Bercht.
& J. Presl and includes approximately 160 species [1]. It is
one of the largest genera within the tribe Anthemideae
Cass., together with genera such as Artemisia L., Achillea L.
and Anthemis L. Commonly known as tansies, Tanacetum
species are native to many areas of the Northern
Hemisphere, occupying the temperate zones of Europe,
Asia, North Africa and North America, but particularly
abundant in the Mediterranean and Irano-Turanian regions. Although the presence of Tanacetum in the Southern
Hemisphere is much less common [1, 2], some species are
grown worldwide such as T. parthenium (L.) Sch. Bip.,
which can behave as a weed outside its native range.
Tanacetum species are mostly perennial herbs, although
the genus has some annuals and some subshrubs. They
usually form rhizomes and are aromatic plants. Their
capitula, solitary or arranged in more or less dense or
loose compound inflorescences, always contain disc
flowers (flosculous, yellow, numerous — up to 300), sometimes with ray flowers (ligulate, white, yellow or pale
pink). Tanacetum is considered to hold a crucial position
for understanding the phylogenetic relationships within its
tribe, but available phylogenetic reconstructions show that
these species form an imbroglio whose generic relationships and infrageneric arrangement are still unsettled [3].
Many species of Tanacetum are widely distributed and are
used as sources of medicines, food or forage. In particular,
several studies have shown that essential oils from T.
parthenium [4–6] and T. balsamita L. [7–9] have strong
antibacterial, cytotoxic, neuroprotective and antioxidant
activity. T. balsamita has also shown anti-inflammatory
properties [10]. West and central Asia are two important
speciation centres of the genus [11], and Iran is one of the
main areas of speciation and diversification, promoted by
a unique combination of ecosystems. In Iran the genus is
represented by 36 species according to the most recent
revisions, including 16 endemic taxa [3, 12–17].
The karyology of Tanacetum has been extensively
studied, with chromosome counts known for a considerable number of its species [18–21]. Its basic chromosome
number is x = 9, as in most Anthemideae and Asteraceae;
indeed x = 9 is likely the ancestral basic number for the
family as a whole [22]. Ploidy levels are found up to 10×
[23]. Recent work has added more karyological information for this genus; it seems that polyploidy is an
important evolutionary force and the existence of odd
ploidy, aneuploidy and presence of B-chromosomes is not
uncommon [18, 20].
Methods such as fluorochrome banding and fluorescent in situ hybridisation (FISH) of 5S and 18S-5.8S-26S
(35S) ribosomal RNA genes (rDNA) provide chromosome markers, excellent tools to improve karyotype
description [24]. These methods have proven useful for
Page 2 of 16
comparing taxa at different levels, particularly in plants
(see, for example, [25] on several Asteraceae genera;
[26], on Fragaria L.; [27] on Thinopyrum Á. Löve). However broader cytogenetic information is largely missing
for Tanacetum, as happens for many wild species, unlike
crops or other economically interesting plants whose
chromosomes have been more deeply investigated.
Genome size estimation, easily obtained by flow cytometry, has been used in a similar way (see, for example,
[28] on Tripleurospermum Sch. Bip.; [29] on Carthamus
L.; [30] on Artemisia L.). The combination of these
methods can improve our understanding of chromosome evolution and genome organisation processes in
plants [31]. Moreover, molecular cytogenetic studies,
together with genome size evaluation, are also useful in
a wide range of biological fields, from taxonomy, evaluation and conservation of genetic resources, to plant
breading [24, 32–34].
Despite being a large and well-known genus, molecular
cytogenetic studies of Tanacetum are limited to a single
work reporting data on two species: T. achilleifolium
(M. Bieb.) Sch. Bip. and T. parthenium [35]. That study
described co-localisation of both 5S and 35S ribosomal
RNA genes in Tanacetum, the so-called linked type
(L-type) arrangement of rDNA, confirming preliminary
findings for this genus [25]. This rDNA organisation is
typical of several Asteraceae members, particularly those
belonging to tribes Anthemideae and the Heliantheae
Cass. alliance (see [25, 36] for details). However, the most
common rDNA organisation in plants, and also in family
Asteraceae, is that in which both rRNA genes are separated (S-type arrangement). Remarkably, [35] found that
one 35S rDNA locus was separated in T. achilleifolium,
while the other one remained co-localised with the 5S.
This dual organisation of rDNA in the same species
(i.e. both L-type and S-type coexisting) is exceptional.
Likewise, genome sizes for Tanacetum are only known
for few species, reduced to three research works to our
knowledge [37–39]. In this study, we establish a deeper
knowledge of Tanacetum genomes through molecular
cytogenetic and genome size analysis. We focus on
several species native to Iran, since this area constitutes
a centre of speciation and diversification of the genus.
All ploidy levels previously reported for the genus (from
2x to 10x) exist in Iran [20], many of the studied tansies
grow there in polyploid series, and odd stable ploidy,
aneuploidy and presence of B-chromosomes have been
found [3, 20]. Our specific goals were (1) to characterise
the genomes of Tanacetum species by flow cytometry,
fluorochrome banding and FISH of rRNA genes, and
particularly, to observe the rDNA organisation in these
species, (2) to detect the karyotype and genome size
patterns of the genus and describe their typical models,
if any, (3) to address the presence of polymorphisms at
Olanj et al. BMC Plant Biology (2015) 15:174
the cytogenetic level, (4) to assess the impact of polyploidy in Tanacetum genomes, and (5) to reconstruct
ancestral character states of genome size and karyotype
features such as number of rDNA loci and CMA+ bands
to infer genome evolution in the context of a phylogenetic
framework of the genus.
Results
The chromosome counts here represent most ploidy
levels found in Tanacetum to present, all x = 9-based. We
found B-chromosomes in one of the populations of T. pinnatum and in T. fisherae, and some of the populations investigated, such as those of T. archibaldii and T. aureum
(Lam.) Greuter, M.V.Agab. & Wagenitz, presented mixed
ploidy. In addition, several of the studied taxa are odd
polyploids, such as the case of triploid T. joharchii Sonboli
& Kaz. Osaloo and T. kotschyi (Boiss.) Grierson, and the
pentaploid T. fisherae Aitch. & Hemsl. which is also a
hypoaneuploid since it has lost one chromosome out of
the 45 expected. More detailed karyological information is
in Table 1.
Genome size
Table 1 presents holoploid genome size data (2C), together with other karyological features of the studied
species, as well as information on some closely related
taxa for comparison. We analysed 38 populations of 20
species and five subspecies of Tanacetum, including
ploidy from 2x to 6x. Genome sizes (2C) ranged from
3.84 pg (belonging to one of the diploid populations of
T. parthenium) to 24.87 pg (from a tetraploid population
of T. pinnatum Boiss.), an overall 6.47-fold range, and a
3.29-fold range at the diploid level. Mean 2C at diploid
level is 8.05 pg. The low Half Peak Coefficient of
Variation (HPCV) mean value (2.29 %) indicates good
quality of the flow cytometric assessments. Fluorescence
histograms from the flow cytometer are presented in
Fig. 1 to illustrate the accuracy of measurements with all
internal standards used.
We found intraspecific genome size differences in most
cases in which several populations were assessed, reaching
22.18 % in the triploid T. kotschyi, 16.04 % in the diploid
T. parthenium, 9.43 % in the tetraploid populations of T.
aureum, 8.10 % in the tetraploid T. polycephalum Sch.
Bip., 1.89 % in the hexaploid T. tabrisianum (Boiss.) Sons.
& Takht., and negligible variability (<0.1 %) among diploid
T. pinnatum populations.
Genome size (2C) and total karyotype length (TKL)
were significantly (p < 0.0001) and positively correlated
with ploidy, but monoploid genome size (1Cx) did not
decrease with ploidy. Nevertheless, when data of the same
species at different ploidy levels was compared, there was
a trend to genome downsizing i.e. reduction of monoploid
genome size in T. polycephalum and T. pinnatum, whose
Page 3 of 16
4× and 6× polyploids present, respectively, 6.07 % and
17.96 % less genome size than expected from the genome
size in their diploid populations. In addition, genome size
is positively correlated with TKL (p = 0.003), with the
number of rDNA signals (p < 0.0001) and with pollen
morphometric characters such as polar axis (p = 0.03) and
equatorial diameter (p = 0.02). Species with different compound inflorescences have significantly different genome
sizes (p = 0.009); species with solitary capitula have the
smallest genome compared to species presenting corymbs
of capitula, which have the greatest amounts of DNA
(5.54 pg vs 13.2 pg at the diploid level).
GC-rich regions
Table 1 shows the results of fluorochrome banding with
chromomycin and FISH assays, and Figs. 2 and 3 present
selected representative Tanacetum metaphases. For the
sake of clarity, only three chromosomal locations have
been considered both for chromomycin A3 (CMA) and
rDNA signals, following the treatment used in the
www.plantrdnadatabase.com. These are: (peri)centromeric, interstitial and (sub)terminal. Results of chromomycin banding, which stains GC-rich DNA portions, are
highly variable within and between Tanacetum species
and even among individuals in some cases. In only four
species is the number of bands always constant (the
diploids T. parthenifolium Sch. Bip., T. persicum (Boiss.)
Mozaff., T. pinnatum and T. budjnurdense (Rech.f.)
Tzvelev) and low — four, see picture of T. pinnatum
(Fig. 2a). However, from a minimum of two CMA+
bands in a wild population of the diploid T. parthenium
(Fig. 3g) to a maximum of 66 bands for the diploid
T. archibaldii Podlech (Fig. 3a) there are myriad variations. In most cases, however, there is a considerable
range of variability within a species. The preferred
position is usually (sub)terminal, and sometimes detached or terminal decondensed DNA (probably rDNA)
is clearly seen with this staining (see Fig. 3k). Several
species also present pericentromeric bands, and in two
species (T. archibaldii and T. joharchii), several intercalary signals are also visible (Fig. 3a and 3k). Pericentromeric (and to a lesser extent, intercalary) bands appear
in species that already present a high number of
GC-rich bands.
Several taxa of different ploidy (different populations
from T. aureum, T. heimerlii (Nábělek) Farsa, T. parthenium, T. polycephalum Sch. Bip. subsp. argyrophyllum
(K.Koch) Podlech, T. pinnatum, T. sonbolii Mozaff. and
T. tabrisianum) show odd numbers of bands in different
individuals (Table 1). Intensity and size differences of
chromomycin signals are clearly visible in several
species, such as T. kotschyi (Fig. 2d), T. oligocephalum
(DC.) Sch. Bip. (Fig. 2g), T. balsamita (Fig. 3c) and
T. joharchii (Fig. 3k).
Species
Population
PL1 2n2 2C3
2C4
SD5 1Cx6 HPCV7 CMA8
rDNA9
T. archibaldii Podl.
Mazandaran: Pole Zangoleh road (1790)
2
18
8.77
8577
0.04 4.39 1.77
4
T. balsamita L.
Mazandaran: Pole Zangooleh road (1788)
2
18
10.38
10152 0.09 5.19 1.13
40tc (24, 30, 34, 36, 40, 4
42, 44)
T. budjnurdense (Rech.f) Tzvel.
Khorasan: Bujnourd (1477)
2
18
10.13
9907
0.19 5.07 1.77
4t
4
T. canescens DC.
Zanjan: Soltanieh (1912)
2
18
9.3
9095
0.13 4.65 1.68
4, 6 and 8tc
6 (8)
T. aureum (Lam.) Greuter, M.V.Agab. &
Wagenitz
Urmia: Meyab (1848)
4
36
17.08*
16704 1.38 4.27 2.62
28tc (26, 32, 34)
10 (8)
T. aureum (Lam.) Greuter, M.V.Agab. &
Wagenitz
Urmia: Suluk Waterfall (1861)
4
36
15.47*
15130 0.36 3.87 2.79
6 and 10t (3, 4, 5)
10
T. heimerlii (Nabělek) Parsa
Urmia: Sero road, Golsheykhan (1227)
2
18
8.25
8069
0.06 4.13 2.09
4t (2, 3, 5, 6)
4 and 6
T. oligocephalum (DC.) Sch.Bip.
Urmia: Chaldoran (1914)
2
18
7.67
7501
0.05 3.84 2.53
6t (4)
6
T. oligocephalum (DC.) Sch.Bip.
Urmia: Naghadeh (1868)
4
36
17.57*
17183 0.62 4.39 2.2
22t(10, 12, 14, 20, 24)
12 (8, 10)
T. oligocephalum (DC.) Sch.Bip.
Urmia: Mamakan (1911)
4
36
14.87*
14543 0.28 3.72 3.02
10t (8, 9)
10
T. fisherae Aitch. & Hemsley.
Kerman Mehr mountain, north and east slopes (1916)
5
44A 17.11*
16734 0.27 3.42 2.69
30 tc (8, 14, 22, 24, 28) 10 (5, 7, 6, 12,
15)
T. hololeucum (Bornm.) Podl.
Mazandaran: Pole Zangoleh road (1791)
2
18
8.45
8264
T. joharchii Sonboli & Kaz.Osaloo
Khorasan, Chenaran, (1620)
3
27
11.31*
11061 0.11 3.77 0.92
T. kotschyi (Boiss.) Grierson
Urmia, Anhar road, Suluk (1129)
3
27
10.04*
9819
T. kotschyi (Boiss.) Grierson
Tabriz: Mishodagh (1339)
3
27
10.72*
10484 0.12 3.57 1.83
44tc (28, 32, 42, 44, 48) 6
T. kotschyi (Boiss.) Grierson
Zanjan: Ghidar (1419)
3
27
8.58*
8391
0.09 2.86 1.89
18tc (20, 22, 26)
4
T. parthenifolium (Willd.) Sch.Bip.
Urmia: Suluk Waterfall (1127)
2
18
4.68
4577
0.09 2.34 3.07
4t
4
T. parthenium (L.) Sch.Bip.
Tehran: Tochal (1483)
2
18
3.84
3756
0.04 1.92 2.46
2t (3, 4)
2 (3, 4)
T. parthenium (L.) Sch.Bip.
Tehran: Shahid Beheshti University, agricultural field of
research. Cultivated (1633)
2
18
4.51
4411
0.04 2.26 3.06
14tc (8, 10)
6
T. parthenium (L.) Sch.Bip.
Hamadan: Dare Morad Beig (1903)
2
18
4
3912
0.04 2.00 3.02
3t (2,4)
2(3, 4)
T. persicum (Boiss.) Mozaff.
Chahar Mahal & Bakhtiari: Sabz Kuh (1502)
2
18
4.4
4303
0.69 2.20 2.49
4t
4
B
0.2
4.23 1.61
0.07 3.35 1.63
56itc (50, 54, 66)
14 and 16t (18, 20, 22) 6
24itc (32 and 36)
6 (5, 8)
24tc (20, 28, 32, 34)
6
Hamadan: Asad Abad (1895)
2
18
13.19
12900 0.06 6.60 2.09
4t
4
T. pinnatum Boiss.
Hamadan: Malayer (1896)
2
18
13.18*
12890 0.08 6.59 2.75
4t (6)
4
T. pinnatum Boiss.
Hamadan: Razan (1894)
4
36
24.87*
24323 0.58 4.15 1.45
6t (3, 4, 5)
4 and 6 (8)
T. polycephalum Sch.Bip. ssp. argyrophyllum
(K.Koch) Podlech
Urmia: Meshkin Shahr (1884)
2
18
9.26
9056
6t (5, 7, 8, 10)
6 (7, 8)
T. polycephalum Sch.Bip. ssp. argyrophyllum
(K.Koch) Podlech
Urmia: Ghasemloo Valley (1866)
4
36
17.88*
17487 0.84 4.47 2.84
8 and 10t (5, 6, 13)
12 (14)
Page 4 of 16
T. pinnatum Boiss.
0.14 4.63 1.3
Olanj et al. BMC Plant Biology (2015) 15:174
Table 1 Provenance and voucher number from the Medicinal Plants and Drug Research Institute Herbarium (MPH), Shahid Beheshti University (Tehran) of the populations of
Tanacetum studied, together with genome size, number of CMA+ bands and number of rDNA sites
Species
Population
PL1 2n2 2C3
2C4
SD5 1Cx6 HPCV7 CMA8
T. polycephalum Sch.Bip. ssp. argyrophyllum
(K.Koch) Podlech
Urmia: Oshnaviyeh (1867)
4
35
16.82*
16450 0.4
T. polycephalum Sch.Bip. ssp. argyrophyllum
(K.Koch) Podlech
Urmia: Marand (1856)
4
36
17.89*
T. polycephalum Sch.Bip.ssp. azerbaijanicum
Podlech
Urmia: Ghishchi (1212)
4
36
T. polycephalum Sch.Bip. ssp. duderanum
(Boiss.) Podlech
Mazandaran: Pole Zangoleh road (1795)
4
T. polycephalum Sch.Bip. ssp. farsicum Podlech Hamadan: Kabudar Ahang (1901)
T. polycephalum Sch.Bip. ssp. heterophyllum
(Boiss.) Podlech
Mazandaran: Pole Zangoleh road (1797)
T. polycephalum Sch.Bip.ssp. heterophyllum
(Boiss.) Podlech
4.21 2.94
rDNA9
6, 10, 20 and 24t
14 (10, 11, 12,
13, 15)
17496 0.16 4.47 2.4
32 and 36t (8, 20)
12 (14)
18.24*
17839 0.31 4.56 2.4
16t (8, 14)
12
36
17.63*
17242 0.53 4.41 3.22
14tc (18, 20, 22, 24)
12 (11)
6
54
24.12** 23589 0.39 4.02 3.46
22 and 24t (18, 20, 26) 13 (14, 17)
4
36
18.10*
18 and 22t (16, 18, 20,
30, 32)
12 (9, 10, 11)
Hamadan: Asad Abad (1899)
6
54
22.99** 22484 0.56 3.83 2.88
8t (10, 12, 14, 16)
18 (15, 16, 17)
T. sonbolii Mozaff.
(305) Urmia: Takab
2
18
9.17
5t (4, 6, 8)
8
T. tabrisianum (Boiss.) Sosn. & Takht.
Urmia: Ahar (1905)
6
54
23.56** 23042 1.12 3.93 2.59
20 and 26t (14, 16, 27) 14 and 16 (10,
12)
17702 0.29 4.53 2.48
8968
0.19 4.59 2.12
T. tabrisianum (Boiss.) Sosn. & Takht.
Urmia: Ahar (1906)
6
54
24.01** 23482 0.16 4.00 1.96
50t (28, 40)
16 (14, 15, 26)
T. tenuisectum (Boiss.) Podl.
Tehran: Damavand (863)
2
18
7.68
7511
32, 34 and 46tc
6 (8, 10)
T. tenuissimum (Trautv.) Grossh.
Urmia: Jolfa (1855)
4
36
16.26*
15902 1.33 4.07 2.74
16 and 22 tc
9
0.13 3.84 1.11
Olanj et al. BMC Plant Biology (2015) 15:174
Table 1 Provenance and voucher number from the Medicinal Plants and Drug Research Institute Herbarium (MPH), Shahid Beheshti University (Tehran) of the populations of
Tanacetum studied, together with genome size, number of CMA+ bands and number of rDNA sites (Continued)
All populations are native to Iran. (1) ploidy; (2) chromosome number; (3) genome size in pg; Petunia hybrida ‘PxPC6’ (2C = 2.85 pg), (*) Pisum sativum ‘Express Long’ (2C = 8.37 pg), and (**) Triticum aestivum ‘Chinese
Spring’ (2C = 30.9 pg) were used as internal standards; (4) genome size in Mbp (1 pg = 978 Mbp); (5) standard deviation; (6) monoploid genome size; (7) half peak coefficient of variation for each population; (8) most
commonly found number of CMA+ bands, together with the most usual position found for them (I = interstitial, t = terminal or subterminal, c = centromeric or pericentromeric); in brackets, other numbers of CMA+
bands found; (9) most commonly found number of rDNA sites; in brackets other numbers of rDNA sites found (position of rDNA sites is always terminal or subterminal). AThe expected number for a pentaploid would
be 2n = 45 but there is an already described hypoaneuploidy for this taxon, sometimes presenting a B chromosome (2n = 44 + 1B, [105]); Btwo to three B-chromosomes occasionally found
Page 5 of 16
Olanj et al. BMC Plant Biology (2015) 15:174
Page 6 of 16
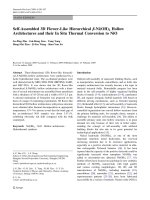
Fig. 1 Fluorescence histograms of the genome size assessments of (a) T. heimerlii 2x population (2) with Petunia hybrida (1) as internal standard,
(b) T. pinnatum 4x population (4) with Pisum sativum (3) as internal standard and (c) T. polycephalum ssp. heterophyllum 6x population (5) with
Triticum aestivum (6) as internal standard
There is no significant relationship between ploidy and
the most commonly found number of signals for a given
species, nor with genome size. In addition, the number
of GC-rich bands is positively correlated with the
altitude at which species occur, considering all taxa
(p = 0.04) and only diploids (p = 0.006).
rDNA loci
The FISH assays of a large sample representing genus
Tanacetum show a totally homogeneous L-type organisation of ribosomal RNA genes. The number of signals
within a species (even within a population) and between
species at the same ploidy is usually heterogeneous
although not as heterogeneous as the number of CMA+
bands. The minimum number of signals found was two
(one locus) for one population of T. parthenium and the
maximum was 26 (13 loci) for some individuals of one
population of T. tabrisianum (although most T. tabrisianum had eight loci, see Fig. 2n). In all cases, rDNA signals
occupied terminal or subterminal positions, always coincidental with CMA+ signals, and sometimes appearing as
decondensed (as T. joharchii in Fig. 3d, l arrows). Species
such as T. fisherae and T. tabrisianum (Fig. 2k, n, asterisks), presented locus size differences, but in general, this
was homogeneous. The number of rDNA signals was
positively and significantly correlated with ploidy and genome size (p < 0.0001 for both), but there was no reduction
in number of loci, as the number of signals per haploid
genome did not diminish significantly with increasing
ploidy. However, a reduction in the number of signals was
detected in individual polyploid series for T. pinnatum
and three out of four of T. polycephalum. In all other
cases there was additivity; that is, the tetraploid had
exactly twice as many signals as the diploid, except in the
case of one tetraploid T. polycephalum population, in
which there was upsizing by one locus.
The heterogeneity in the number of signals for a given
species (that is, the different number of rDNA loci that
could be found in metaphases coming from the same species) was positively correlated with ploidy (p < 0.0001)
which means that with increasing ploidy there was a tendency to instability in the number of rDNA signals. In
particular, the hypoaneuploid T. fisherae (2n = 5x = 44)
and T. polycephalum var. argyrophyllum (2n = 4x = 35)
were the most unstable with respect to the number of
rDNA signals.
Phylogenetic relationships among species and ancestral
characters
Statistical analyses at the genus level should consider
phylogenetic relationships among taxa to be as unbiased
as possible. However, due to lack of enough data, these
comparisons could not be done in most cases. Still, we
detected significant and positive correlations using the
phylogenetic generalised least squares method (PGLS)
between genome size (2C), ploidy, and number of rDNA
signals (p < 0.0001), i.e. all parameters increase/decrease
in concert. The reconstruction of character evolution
into the phylogeny (Fig. 4), based on diploid taxa, provides ancestral 2C values ranging from 7.98 to 8.84 pg,
from 10 to 13 for CMA+ bands, and from 4 to 6 rDNA
signals for Tanacetum species.
Discussion
All species investigated present x = 9 as the basic chromosome number confirming previous research [20, 23]. In
contrast to other Anthemideae, in which other basic
chromosome numbers have been found (e.g. Artemisia
presents x = 7, 8, 9, 10, 11; Pentzia Thunb., x = 7, 8, 9,
Lasiospermum Fisch., x = 9, 10 [40]) x = 9 it is the only
found in Tanacetum until present [41].
Olanj et al. BMC Plant Biology (2015) 15:174
Page 7 of 16
Fig. 2 Chromomycin A3-positive (CMA+) and FISH images of the most commonly found metaphases of representative species of each ploidy
level in Tanacetum. CMA+ bands are marked yellow, 26S-5S rDNA signals, marked orange in images. CMA+ positive bands are marked yellow,
26S-5S rDNA signals, are marked red-green in the schematic representation of chromosomes. (a, b, c) Tanacetum pinnatum, 2x population
(Asad Abad, 1895) showing four CMA+ and four rDNA signals; (d, e, f) T. kotschyii, 3x population (Urmia, 1129) showing up to 24 CMA and six
rDNA signals; large CMA+ bands indicated with asterisks; (g, h, i) T. oligocephalum, 4x population (Mamakan, 1911), showing 10 CMA+ and 10
rDNA signals; large CMA+ bands indicated with asterisks and faint bands indicated with arrows; (j, k, l) T. fisherae, 5x population, showing up to
30 CMA+ and 10 rDNA signals; large rDNA signals indicated with asterisks; (m, n, o) T. tabrisianum 6x population (Ahar, 1906), showing up to 50
CMA+ and 16 rDNA signals; large rDNA signals indicated with asterisks. Scale bars = 10 μm
Olanj et al. BMC Plant Biology (2015) 15:174
Page 8 of 16
Fig. 3 Chromomycin A3-positive (CMA+) FISH images of cytogenetically variable Tanacetum species, in which CMA+ bands are marked yellow,
26S-5S rDNA signals and marked orange. (a, b) T. archibaldii (2x) with 56 CMA signals (asterisks indicate interacalary CMA+ bands) and with 4
rDNA signals; (c, d) T. balsamita, 2x, with 40 CMA+ signals (many of them pericentromeric, indicated with asterisks) and with four rDNA signals –
a slightly decondensed rDNA is indicated with an arrow; cultivated (e, f) and wild (g,h) T. parthenium (from Shahid Beheshti University, 1633 and
Tochal, 1483, respectively), both 2x with 14 and six CMA+ and six and two rDNA signals observed, respectively; (i, j) T. kotschyi (Tabriz, Mishodagh,
1339), 3x, with 44 CMA+ signals and six rDNA signals and (k, l) T. joharchii, 3x, with 24 CMA and six rDNA signals; note faint or interstitial CMA+
bands indicated with asterisks and decondensed rDNAs indicated with arrows in both pictures. Scale bars = 10 μm
To our knowledge, genome size was available for only
four species of the genus, the diploid T. vulgare (mean 2C
= 8.85 pg, [37]), a tetraploid population of T. cinerariifolium (Trevir.) Sch. Bip. (2C = 14.53 pg, [38]) and some
hexaploid populations of T. balsamita and T. corymbosum
(L.) Sch. Bip. (2C = 21.44 pg and 2C = 19.95 pg, respectively, [39]). Therefore this research contributes new genome sizes for all species and subspecies studied here (with
the exception of T. balsamita), representing approximately 11 % of the recognised species of the genus. The
Olanj et al. BMC Plant Biology (2015) 15:174
Page 9 of 16
Fig. 4 Ancestral state reconstruction of number of rDNA signals (left) and genome size (right) for diploid Tanacetum taxa. The model of reconstruction
was Parsimony as implemented in Mesquite (v.3.02), and ancestral state reconstruction was estimated using the 50 % majority-rule consensus topology
obtained by Bayesian inference phylogenetic analysis of the internal transcribed spacer 1 (ITS1), ITS2 and trnH-psbA data sequence. The Bayesian
clade-credibility values (posterior probability > 0.5) are given above branches. Schematic representation of chromosomes with the most commonly
found numbers of rDNA signals and bars that depict genome sizes (2C values) with a red line indicating the mean 2C value at the diploid level.
(*) Tanacetum polycephalum ssp. argyrophyllum
amount of nuclear DNA is mostly intermediate in Tanacetum. According to the genome size categories in plants
established by [42], three of the 20 species we studied
(17.65 %) have small genome sizes (2.8 ≤ 2C < 7 pg),
whereas the remaining have intermediate genome sizes
(7 ≤ 2C < 28 pg), including all ploidy levels. Mean genome size of the diploid taxa studied (8.35 pg) was coincidental with the mean of the tribe Anthemideae
(8.30 pg) and of the family Asteraceae (2C = 8.20 pg),
according to data from the Genome Size in Asteraceae
Database (www.asteraceaegenomesize.com). Closely related diploid genera, such as Artemisia, have similar
mean genome sizes (2C = 7.75 pg) whereas the majority
of diploid Tanacetum allies present remarkably lower
mean 2C values (2C = 5.9 pg for Achillea, 2C = 6.4 pg
for Anacyclus L., 2C = 5.12 for Anthemis, 2C = 5.71 for
Matricaria L., 2C = 5.13 for Tripleurospermum). The
comparatively larger mean genome size of Tanacetum
could be because our sample lacks annual representatives (as does most of the genus) which, quite often —
though not always — tend to present lower genome
sizes than their counterparts [43].
Genome downsizing and polyploidy in Tanacetum
Polyploidy and hybridisation are important evolutionary
forces shaping plant genomes and underlying the huge
angiosperm diversity. Both can confer evolutionary advantages [44–46] attributed to the plasticity of plant genomes
and to increased genetic variability, generating individuals
capable of exploiting new niches [47]. Polyploidy is linked
to numerous epigenetic/genomic changes such as chromo
some rearrangements, transposable element mobilisation,
gene silencing or genome downsizing [48–50]. Certainly,
genome downsizing would be a widespread biological
response to polyploidisation [51]. This may lead to diploidisation of the polyploid genome [52–54]. There is no evidence of genome downsizing across Tanacetum ploidy
levels. However, there are genome size trends within
separately polyploid series of particular species. Tetraploid
T. pinnatum presents up to 6.07 % lower 1Cx than
expected from the 1Cx of the diploid populations, and
hexaploid and tetraploid T. polycephalum present,
respectively, 17.96 % and 4.28 % lower 1Cx than expected
from the 1Cx of the diploid population. This is consistent
with previous observations of more pronounced genome
Olanj et al. BMC Plant Biology (2015) 15:174
downsizing with higher ploidy [30, 45, 55–57]. Recent
work [57] has demonstrated erosion of low copy-number
repetitive DNA in allopolyploids, sometimes counteracted
by expansion of a few repeat types. Age and genomic similarity of the parental genome donors of the polyploids play
a role in the extent of genome size change with polyploidy
[56] and a deeper understanding of the likely hybridogenic
origin of some of the Tanacetum polyploids studied would
allow more robust hypotheses on the balancing genomic
processes these taxa may have undergone.
Small genome size and invasiveness
Tanacetum parthenium appears listed in several countries as an invasive weed [58, 59]. Its genome size was
the smallest obtained in our study (three populations
were analysed whose mean was 2C = 4.12 pg). This is
consistent with previous findings [60], which detected
that many weeds (including those in family Asteraceae)
had smaller amounts of DNA than closely related (nonweedy) species. This relationship is supported by recent
work [61, 62]. The other species with small genome sizes
in our sample (T. parthenifolium and T. persicum) have
not, however, been recorded as weeds. Therefore a small
genome size (particularly, smaller than that of closely
related species) is a necessary but not sufficient condition for a plant to become a weed. A recent review [63]
concluded that invasive species were characterised by
small and very small genomes, yet this conclusion may
be biased by the general trend of land plants to small
genome sizes as a whole [42].
Intraspecific instability and massive amplification of
GC-rich DNA occur in several Tanacetum species
We found that ribosomal DNA is always CMA+ in
Tanacetum (see Discussion on rDNA loci below), common to other studies [45, 64, 65] although exceptions
are found [66]. For most of the studied populations, the
number of CMA+ bands significantly exceeded that of
rDNA signals and there was no apparent relationship
with ploidy or with genome size (Table 1). The number
of CMA+ bands is neither stable within a species nor
within a population. The presence of odd and of nonhomologous signals was occasionally observed, for
example in T. aureum and in T. oligocephalum (Table 1),
where a single chromosome with two CMA+ bands at
each end was observed instead of the two identical
chromosomes expected. Odd ploidy species, such as T.
fisherae (5x) and T. kotschyi (3x), were particularly labile
with respect to the number of CMA+ bands. However,
the greatest variability in number of CMA+ bands corresponded to the diploid T. balsamita, in which sevendifferent numbers of signals were found (Table 1 and
Fig. 3c). Such instability in the number of GC-rich bands
was unexpected and has seldom been reported. Only the
Page 10 of 16
highly variable CMA+ banding pattern previously found
in Citrus L. and close genera [67] is similar to the variability found in Tanacetum, probably as a consequence of
amplification or reduction in satellite sequences known to
be particularly GC-rich [68]. It is possible that some as yet
undescribed satellite DNA type, specific to Tanacetum, is
in part responsible for these karyotype features.
Another characteristic of the CMA+ banding pattern in
Tanacetum was the striking number of signals found in
certain species, particularly in diploid taxa (Table 1, Fig. 3a,
3c, 3i, 3k). This contrasts with previous work on genus Artemisia [69, 70], in which a large number of CMA+ bands
was only detected in some polyploids, while the only
CMA+ bands in diploids were those exactly corresponding
to rDNA loci. In other Asteraceae genera, such as Cheirolophus Cass., a large number of CMA+ bands was also reported, mostly coincidental with 35S rDNA signals [71];
this was also the case for Filifolium [72]. In Centaurea L.
[73] the number of CMA+ bands was the same as or
smaller than the number of 35S rDNA signals, while in
some Xeranthemum L. [74], Galinsoga Ruiz & Pav. and
Chaptalia Vent. [75], few additional GC-rich bands were
observed.
While most bands are in terminal position, pericentromeric GC-rich heterochromatin was detected in several
species, some of them closely related, such as T. polycephalum, T. aureum and T. canescens DC. on one hand
(Table 1), and T. fisherae (Fig. 2j), T. kotschyi (Fig. 2d), T.
tenuisectum Sch.Bip. and T. joharchii (Fig. 3k) on the
other. In fact, in Arabidopsis thaliana (L.) Heynh., centromeres are one of the most GC-rich genomic regions [76].
Differences in total GC% among eukaryotes are largely
driven by the composition of non-coding DNA of which
retrotransposons are the most abundant (for example, LTR
Huck elements contain more than 60 % GC, [77]). Possibly, some centromere-specific LTR could have undergone
amplification in these closely related Tanacetum genomes.
What can this fluctuating distribution of CMA+ bands
mean, and what are the implications? It is feasible that a
specific satellite and/or retroelement family may be expanded or contracted in Tanacetum genomes. Although
the number and the distribution of CMA+ bands are
thought to be relatively constant features of plant karyotypes [24, 70], our results strongly argue against this view,
since variability was found even within a population. In
addition, there were few evident ecological or geographic
patterns in Tanacetum, that is, few significant relationships were found between the number or variability of
GC-rich signals and geographical distribution, weedy behaviour, or soil features. The only significant association is
with altitude: Tanacetum species living at higher altitudes
tend to present more GC-rich DNA. In line with this
hypothesis, [78] found a large number of heterochromatic
bands (both GC- and AT-rich) in species from the
Olanj et al. BMC Plant Biology (2015) 15:174
Asteraceae genus Myopordon Boiss. inhabiting high
mountain areas. These authors related the development of
such heterochromatic bands in terminal regions with an
adaptation to protect telomere function from UV radiation, a major genome-damaging agent, particularly in
high mountains. Heterochromatin expansion in terminal
regions (as in Tanacetum) has also been suggested to
enhance chromosomal pairing during cell division [79].
Genomic organisation of rDNA and typical distribution
pattern of Tanacetum
Our cytogenetic study confirmed that both the 5S and
the 35S rRNA genes are co-localised (L-type arrangement) in all chromosomes. Such organisation was found
in Artemisia for the first time in higher plants [36], and
subsequently inferred for at least 25 % of Asteraceae species [25]. In the latter study, Southern blot hybridisation
was performed on a sample of T. parthenium, and the
profile obtained also suggested L-type organisation for
its rDNA. Prior to our study, the only evidence of this
particular rDNA organisation directly in chromosomes
was from T. achilleifolium and T. parthenium [35].
Curiously, these authors found one unlinked 5S locus
additional to two regular L-type loci in T. achilleifolium,
while T. parthenium showed L-type arrangement in all
loci. Within the sample studied we could not find a
single species with unhomogenised rDNA (i.e. that both
kinds of rDNA arrangement, linked and separated, were
present in the same species), since both rDNA probes
invariably overlapped in all loci. Nevertheless, possible incomplete homogenisation of rRNA genes may also be
present in other close genera such as Achillea and
Chrysanthemum L. [72, 80]. Besides, in some metaphases
decondensed rDNA signals are detected. These probably
correspond to active nucleolar organizer regions (NORs),
i.e. rDNA that is being actively transcribed, visible in T.
balsamita (Fig. 3d, one signal) and in T. joharchi (Fig. 3l,
two signals). Decondensed rDNA, however, is not always
detected during metaphase.
Unexpected variation in number of rDNA loci
The number of rDNA signals was always smaller and less
variable than that of CMA+ bands, as found previously in
other closely related species (in Artemisia, [45, 70]) and
even in other families (genus Ipomoea from Convolvulaceae, [81]). In particular, the most common number of
rDNA loci at the diploid (with two to three loci) and
tetraploid (with five to six loci) levels was relatively constant and consistent with previous data for Tanacetum
[35, 82] or for the closely related genera Matricaria and
Tripleurospermum [25]. However, taxa with odd, higher
ploidy or aneuploid levels often displayed higher intraspecific polymorphism in the number of signals. Of these,
the hypoaneuploid population of T. polycephalum var.
Page 11 of 16
argyrophyllum was particularly striking, since metaphases
with 10, 11, 12, 13, 14 and 15 rDNA signals were observed; the hypoaneuploid T. fisherae (2n = 5x = 44)
showed a similar condition (Table 1). Thus, processes of
hypoaneuploidy could affect genomic stability producing
this variation in number of loci.
Although it would be expected that the number of signals remain relatively constant for a given species, cases
of intraspecific polymorphism in the number of signals
are increasingly reported. As for Tanacetum, diversity in
the number of rDNA signals for a given species has been
found in Fragaria vesca L. [26] and in Phaseolus vulgaris
L. [83], for example. However, what is exceptional in
Tanacetum is that these polymorphisms happen even at
the population level and, albeit very rarely, sometimes
within the same individual. All this, together with the
unexceptional situation of odd numbers of signals in
many taxa (which otherwise is rare) illustrates how
dynamic Tanacetum genomes are.
Given these fluctuations, the constantly terminal position of rDNA signals in all the species studied could be
considered surprising. However, this is so in most plants:
[84] argued that there seems to be a strong positive selection favouring the location of 35S rDNA at chromosome
ends, probably as a result of homologous recombination
constraints.
As with the number of CMA+ bands, there was no global reduction in the number of signals per haploid genome with increasing ploidy. Similarly, the number of
rDNA loci did not show any apparent relationship with
genome size.
Our analyses have allowed us to distinguish some interesting relationships between several of the traits studied.
As others have found [85, 86] morphological data regarding pollen size are tightly linked with genome size in
Tanacetum, i.e. pollen size reflects genome size in this
genus. In addition, species of Tanacetum with solitary capitula have smaller genome sizes than those with capitula
organised in complex inflorescences. It is known that
sometimes polyploids tend to present larger reproductive
organs and more flowers per inflorescence than their diploid relatives [87], but few studies have approached the relationship of genome size or polyploidy with natural
patterns, such as inflorescence architecture [88]. Suggested
that the shift in inflorescence phyllotaxis from spiral to
distichous would have occurred at the same time as the
expansion of genome size characterising several groups of
grasses [89], though admitting no clear reason why genome
size as such should affect inflorescence architecture.
In addition, the reconstruction of ancestral cytogenetic
traits brings evidence that these characters have followed
increases and decreases during evolution in Tanacetum
(Fig. 4). In general, it seems that genome size and the
number of rDNA loci have increased, while the number
Olanj et al. BMC Plant Biology (2015) 15:174
of CMA+ bands has decreased in most present taxa.
Few studies have specifically approached the evolution
of cytogenetic traits within a temporal and phylogenetic
perspective and, while events favouring increase in genome size and number of rDNA signals during evolution
have been detected [56], there is no discernible pattern
in the direction of these changes. For example, [90]
found a decrease in number of rDNA loci during the
evolution of Hypochaeris L. The overall decrease of
GC-rich DNA could also respond to depletion of
certain repeated DNA sequences during evolution in
Tanacetum.
Conclusions
This work is the first extensive cytogenetic report on
Tanacetum species. We have confirmed linkage of both
rDNAs in all chromosomal loci. Tanacetum stands out as
variable, particularly in the number of rDNA sites and
CMA+ bands. These vary widely even within a given
population. In particular, aneuploid and odd ploidy taxa
appear more unstable. The observed intrapopulation differences are likely a reflection of genomic differentiation
which could complement further population biology studies. Besides, the number of GC-rich DNA bands found in
certain species is striking and deserves more study. A possible cause is the amplification of repeat families or TEs in
these species compared to others showing utterly different
profiles. Polyploidy and aneuploidy are important evolutionary forces in this genus. Several of the studied populations present spontaneous mixed ploidy, another sign of
its current genomic dynamism.
It is difficult to set general patterns in the evolution of
genome size, number of rDNA loci or heterochromatin in
plants. Yet, studies such as ours contribute to the knowledge of these cytogenetic features at a larger scale. Finally,
the particularly labile cytogenetic scenario observed in
Tanacetum is uncommon and has been seldom reported.
Both chromosomal markers (rDNA loci and GC-rich
bands) tend to be relatively constant at the species level, a
feature that has allowed their use in biosystematics. Still,
even at the population level, these traits can be variable in
Tanacetum and this variation is better understood considering evolutionary relationships between species.
Methods
Plant materials
Seeds of 38 populations of Tanacetum species were
collected from the wild for molecular cytogenetics and
genome size assessments (Table 1). Specimen vouchers of
the studied materials have been deposited at the Medicinal
Plants and Drug Research Institute Herbarium (MPH) of
the Shahid Beheshti University, Tehran.
Page 12 of 16
Chromosome preparations
Root tip meristems were obtained by germinating achenes
on moist filter paper in Petri dishes at room temperature
in the dark. They were pre-treated with 2 mM 8hydroxyquinoline at room temperature for 3–3.5 h. Subsequently, the material was fixed in 3:1 v/v absolute ethanol:glacial acetic acid and stored at 4 °C for 24 h, and then
stored in 70 % ethanol at 4 °C until use. For fluorochrome
banding and fluorescence in situ hybridisation (FISH), the
chromosome spreads were obtained using the air-drying
technique of [91], with modifications. Fixed root tips were
washed three times in distilled water with shaking and
later in citrate buffer (0.01 M citric acid-sodium citrate,
pH 4.6) for 30 min, excised and incubated for 20–35 min
at 37 °C in an enzymatic mixture [4 % cellulase Onozuka
R10 (Yakult Honsha), 1 % pectolyase Y23 (Sigma) and 4 %
hemicellulase (Sigma)]. Digested root tips were placed on
a slide, excess enzymatic solution was removed and protoplasts were obtained by applying gentle pressure in a drop
of 45 % acetic acid. The metaphase plates were evaluated
using a phase contrast microscope and slides were frozen
for at least 24 h at -80 °C. Later, the coverslip was quickly
removed, the slide rinsed with absolute ethanol and then
air dried for at least two days protected from dust.
Fluorochrome banding
In order to reveal GC-rich bands, the chromosomes
were stained with the fluorochrome chromomycin A3
(CMA), according to [24, 92] with slight modifications.
The slides were incubated in McIlvaine buffer pH 7,
MgSO4 (0.1 g/L in McIlvaine buffer, pH 7) for 15 min,
stained with CMA3 (0.2 mg/ml in McIlvaine buffer pH 7
MgSO4) for 90 min in the dark, rinsed in McIlvaine buffer pH 7, and counterstained with methyl green (0.1 % in
McIlvaine buffer pH 5.5) for 10 min; rinsed in McIlvaine
buffer pH 5.5, dried briefly at room temperature, also in
the dark, and mounted in two small drops of Citifluor
AF1 (glycerol/PBS solution).
Labelling of rDNA probes and FISH
For hybridisation experiments we mostly used the same
slides as for fluorochrome banding with CMA after
destaining with fixative, dehydration through an ethanol
series (70 %, 90 % and 100 %) and drying for two days.
The probe used for 35S rDNA localisation was a plasmid
carrying a 2.5 kb insert of 26S rRNA gene from Lycopersicum
esculentum Mill. labelled with Cy3 (Jena Biosciences) using
the Nick Translation Mix (Roche). The 5S rDNA probe
was an approximately 0.7 kb-long trimer of 5S rRNA
genes from Artemisia tridentata Nutt., labelled with
Green dUTP using the Nick Translation Mix (Abbott
Molecular). This probe contained three units of the 5S
rRNA gene (120 bp) and the non-coding intergenic
spacers (about 290 bp). Both probes have been used
Olanj et al. BMC Plant Biology (2015) 15:174
Page 13 of 16
following previous research [25, 65]. FISH was carried out
according to [24] with slight modifications. Slides were incubated in 100 μg/ml DNase-free RNase in 2 × SSC
(0.03 M sodium citrate and 0.3 M sodium chloride) for 1
h at 37 °C, washed in 2xSSC three times for 5 min with
slow shaking, rinsed in 0.01 N HCl for 2 min and incubated in pepsin (0.1 mg/ml in 0.01 N HCl) for 15 min at
37 °C, washed in 2xSSC for 5 min twice, dehydrated in an
ethanol series (70 %, 90 % and 100 %, for 3 min in each)
and air dried. The probe hybridisation mixture contained
25–100 ng/μl rDNA probes, formamide, 50 % (w/v) dextran sulphate, and 20 × SSC. This was denatured at 75 °C
for 10 min and chilled on ice for 5 min. A volume of 30 μl
was loaded onto slides and covered with plastic coverslips.
The preparations were denatured at 75 °C for 10 min and
transferred at 55 °C for 5 min. Hybridisation was carried
out for more than 18 h at 37 °C in a humidified chamber.
Following hybridisation, the slides were washed with shaking in 2 × SSC, 0.1 × SSC and 2 × SSC at 42 °C for 5 min
twice each, and then once in 2 × SSC for 5 min, once in
4 × SSCT for 7 min, briefly rinsed in 1 × PBS and dried.
Samples were counterstained with Vectashield (Vector
Laboratories, Inc., Burlingame, CA, USA), a mounting
medium containing 500 ng/μl of 4’,6-diamidino-2-phenylindole (DAPI). The fluorescence signals were analysed
and photographed using a digital camera (AxioCam HRm,
Zeiss) coupled to a Zeiss Axioplan microscope; images
were analysed with Axiovision HR Rev3, version 4.8
(Zeiss) and processed for colour balance, contrast and
brightness uniformity in Adobe Photoshop. A minimum
of 10 metaphase plates per population were analysed.
Graphics were assembled with PowerPoint 2010 (Microsoft). The data were submitted to the Plant rDNA database, a database compiling information on rDNA signal
number, position and organisation [93, 94].
using an Epics XL flow cytometer (Coulter Corporation,
Miami, FL, USA) at the Centres Científics i Tecnològics,
University of Barcelona. More details about the method are
in [55]. The data have been submitted to the GSAD (Genome Size in Asteraceae Database) [97, 98].
Flow cytometric measurements
Statistical analyses
For flow cytometric measurements of leaf tissue, seedlings were obtained from seeds grown in pots in the
greenhouse of the Faculty of Pharmacy, University of
Barcelona. Five individuals per population of the different Tanacetum species were studied, and of these, two
samples of each were individually processed. Petunia
hybrida Vilm. ‘PxPc6’ (2C = 2.85 pg), Pisum sativum L.
‘Express Long’ (2C = 8.37 pg) and Triticum aestivum L.
‘Chinese Spring’ (2C = 30.9 pg) from [95] were used as
the internal standards. Fresh leaf tissue for the standard
and the target species were chopped up together in 600 μl
of LB01 buffer (8 % Triton X-100; [96]) supplemented with
100 μg/ml ribonuclease A (RNase A, Boehringer, Meylan,
France) and stained with 36 μl of 1 mg/ml propidium iodide (Sigma-Aldrich, Alcobendas, Madrid, 60 μg/ml) to a
final concentration of 60 μg/ml, and kept on ice for 20
min. The fluorescence measurements were performed
Phylogenetic analyses and reconstruction of
character evolution
The nuclear ITS1 + ITS2 and chloroplast trnH-psbA sequences (listed in Additional file 1) were edited by BioEdit
v. 7.1.3.0 [99] followed by manual adjustment. Artemisia
taxa were considered as outgroups [3]. All taxa used for
the phylogenetic analysis were diploid in order to avoid the
effect of polyploidy in the estimated nuclear DNA contents, number of rDNA sites or GC-rich bands. Bayesian
phylogenetic analysis was performed in MrBayes 3.1.2
[100] using a SYM + G model determined from jModeltest
v. 2.1.3 [101] under the Akaike information criterion (AIC;
[102]), to ascertain phylogenetic relationships. The Markov
chain Monte Carlo (MCMC) sampling approach was used
to calculate posterior probabilities (PPs). Four consecutive
MCMC computations were run for 2,000,000 generations,
with tree sampling every 100 generations. Data from the
first 1000 generations were discarded as the burn-in
period. PPs were estimated through the construction of a
50 % majority-rule consensus tree.
The ancestral character reconstructions (genome size,
number of rDNA sites and number of CMA+ bands)
were conducted using unordered maximum parsimony
as implemented for continuous and meristic characters
in Mesquite v. 3.02 software [103] using the 50 %
majority-rule consensus tree resulting from the Bayesian
inference analysis as the input tree file. The output trees
were edited with Mesquite v. 3.02.
Analyses of regression, one-way ANOVA, X2, ShapiroWilk test for normality and Barlett’s test for equality of
variances were performed with RStudio, v.0.98.1078. In
addition, the phylogenetic generalised least squares
(PGLS) algorithm as implemented in the nlme package
for R (Version 3.1-118) was used to analyse variation of
genome size, number of rDNA sites and number of
CMA+ bands in a phylogenetic context. Data on genome
size and ribosomal DNA loci for the complementary and
outgroup species were extracted from the Plant rDNA
database [93].
Availability of supporting data
The data sets supporting the results of this article are
available in the TreeBase repository, ID 17805 and http://
purl.org/phylo/treebase/phylows/study/TB2:S17805 [104].
Olanj et al. BMC Plant Biology (2015) 15:174
Additional file
Additional file 1: Accessions downloaded from GenBank. Species
names and accession numbers of Artemisia and Tanacetum ITS1 + ITS2
and trnH-psbA sequences.
Abbreviations
1Cx: Monoploid Genome Size; 2C: Holoploid Genome Size;
CMA: Chromomycin A3; FISH: Fluorescent in situ Hybridisation;
NOR: Nucleolar Organizer Region; PGLS: Phylogenetic Generalised Least
Squares; rDNA: Ribosomal DNA (or ribosomal RNA genes); rRNA: Ribosomal
RNA; TKL: Total Karyotype Length.
Page 14 of 16
6.
7.
8.
9.
Competing interests
The authors declare that they have no competing interests.
10.
Authors’ contributions
NO and AS collected the plant materials. NO, AS, JV and SG designed the
research study. NO, SG and JV performed the research experiments and TG
the phylogenetic analyses. SG performed the statistical analyses and
ancestral state reconstruction and drafted the manuscript. All authors made
contributions to the final manuscript and read and approved its final version.
11.
12.
13.
Acknowledgments
This work was supported by the Dirección General de Investigación Científica y
Técnica, Government of Spain (CGL2010-22234-C02-01 and 02/BOS and
CGL2013-49097-C2-2-P) and the Generalitat de Catalunya, Government of
Catalonia ("Ajuts a grups de recerca consolidats", 2009SGR0439 and
2014SGR514). SG benefitted from a Juan de la Cierva postdoctoral contract
from the Ministry of Economy and Competitiveness, Government of Spain.
NO benefitted from a fellowship from the Science, Research and Technology
Ministry of Iran. Aleš Kovařík is acknowledged for supplying the rDNA probes
and Spencer C. Brown for supplying internal standards for flow cytometry. We
thank the technical staff of the Medicinal Plants and Drugs Research Institute,
Shahid Beheshti University, who helped us with fieldwork. Ricard Àlvarez, Jaume
Comas, Chari González and Sonia Ruiz are acknowledged for their assistance in
flow cytometric analyses. We acknowledge support of the publication fee by
the CSIC Open Access Publication Support Initiative through the Unit of
Information Resources for Research (URICI).
Author details
1
Department of Biology, Faculty of Basic Science, Malayer University, Malayer,
Iran. 2Laboratori de Botànica – Unitat associada CSIC, Facultat de Farmàcia,
Universitat de Barcelona, Avinguda Joan XXIII s/n, 08028 Barcelona, Catalonia,
Spain. 3Institut Botànic de Barcelona (IBB-CSIC-ICUB), Passeig del Migdia s/n,
Parc de Montjuïc, 08038 Barcelona, Catalonia, Spain. 4Department of Biology,
Medicinal Plants and Drugs Research Institute, Shahid Beheshti University,
Evin 1983963113Tehran, Iran.
14.
15.
16.
17.
18.
19.
20.
21.
22.
Received: 17 April 2015 Accepted: 26 June 2015
23.
References
1. Oberprieler C, Himmelreich S, Vogt R. A new subtribal classification of the
tribe Anthemideae (Compositae). Willdenowia - Ann Bot Gard Bot Museum
Berlin-Dahlem. 2007;37:89–114.
2. Oberprieler C, Himmelreich S, Källersjö M, Vallès J, Watson L, Vogt R. Tribe
Anthemideae Cass. In: Funk V, Stuessy T, Bayer R, editors. Systematics, Evolution
and Biogeography of the Compositae. Washington: IAPT; 2009. p. 631–66.
3. Sonboli A, Stroka K, Kazempour Osaloo S, Oberprieler C. Molecular
phylogeny and taxonomy of Tanacetum L. (Compositae, Anthemideae)
inferred from nrDNA ITS and cpDNA trnH–psbA sequence variation.
Plant Syst Evol. 2011;298:431–44.
4. Smith RM, Burford MD. Supercritical fluid extraction and gas
chromatographic determination of the sesquiterpene lactone parthenolide
in the medicinal herb feverfew (Tanacetum parthenium). J Chromatogr A.
1992;627:255–61.
5. Awang DVC. Prescribing therapeutic feverfew (Tanacetum parthenium (L.)
Schultz Bip., syn. Chrysanthemum parthenium (L.) Bernh.). Integr Med.
1998;1:11–3.
24.
25.
26.
27.
28.
29.
Salamci E, Kordali S, Kotan R, Cakir A, Kaya Y. Chemical compositions,
antimicrobial and herbicidal effects of essential oils isolated from Turkish
Tanacetum aucheranum and Tanacetum chiliophyllum var. chiliophyllum.
Biochem Syst Ecol. 2007;35:569–81.
Bagci E, Kursat M, Kocak A, Gur S. Composition and antimicrobial activity of
the essential oils of Tanacetum balsamita L. subsp. balsamita and T.
chiliophyllum (Fisch. et Mey.) Schultz Bip. var. chiliophyllum (Asteraceae) from
Turkey. J Essent Oil Bear Plants. 2008;11:476–84.
Yousefzadi M, Ebrahimi SN, Sonboli A, Miraghasi F, Ghiasi S, Arman M,
et al. Cytotoxicity, antimicrobial activity and composition of essential oil
from Tanacetum balsamita L. subsp. balsamita. Nat Prod Commun.
2009;4:119–22.
Esmaeili MA, Sonboli A, Ayyari Noushabadi M. Antioxidant and protective
properties of six Tanacetum species against hydrogen peroxide-induced
oxidative stress in K562 cell line: A comparative study. Food Chem.
2010;121:148–55.
Karaca M, Özbek H, Akkan HA, Tütüncü M, Özgökce F, Hi̇m A, et al. Antiinflammatory activities of diethyl-ether extracts of Helichrysum plicatum DC.
and Tanacetum balsamita L. in rats. Asian J Anim Vet Adv. 2009;4:320–5.
Vallès J, Garnatje T, Garcia S, Sanz M, Korobkov AA. Chromosome numbers in
the tribes Anthemideae and Inuleae (Asteraceae). Bot J Linn Soc. 2005;148:77–85.
Mozzafarian V. Notes on the tribe Anthemideae (Compositae), new species,
new records and new combinations for Iran. Iranian J Bot. 2005;11:115–27.
Djavadi S. Three new records of Tanacetum for the flora of Iran. Rostaniha.
2008;9:23–32.
Sonboli A, Kazempour Osaloo S, Riahi H, Mozaffarian V. Tanacetum joharchii
sp. nov. (Asteraceae-Anthemideae) from Iran, and its taxonomic position
based on molecular data. Nord J Bot. 2010;28:74–8.
Sonboli A, Oberprieler C. Insights into the phylogenetic and taxonomic
position of Tanacetum semenovii Herder (Compositae, Anthemideae) based
on nrDNA ITS sequences data. Biochem Syst Ecol. 2012;45:166–70.
Kazemi M, Sonboli A. A taxonomic reassessment of the Tanacetum aureum
(Asteraceae, Anthemideae) species group: insights from morphological and
molecular data. Turkish J Bot. 2014;38:1259–73.
Kazemi M, Sonboli A, Maivan HZ, Osaloo SK, Mozaffarian V. Tanacetum
tarighii (Asteraceae), a new species from Iran. Ann Bot Fenn.
2014;51:419–22.
Chehregani A, Hajisadeghian S. New chromosome counts in some species
of Asteraceae from Iran. Nord J Bot. 2009;27:247–50.
Inceer H, Hayirlioglu-Ayaz S, Guler H. Karyological studies of some
representatives of Tanacetum L. (Anthemideae-Asteraceae) from north-east
Anatolia. Plant Syst Evol. 2012;298:827–34.
Olanj N, Sonboli A, Riahi H, Osaloo SK. Karyomorphological study of nine
Tanacetum taxa (Asteraceae, Anthemideae) from Iran. Caryologia. 2013;66:321–32.
Ghasemkhani T, Ahmadi M, Atri M. Variation of chromosome numbers in 14
populations of Tanacetum parthenium and eight populations of T.
polycephalum in Hamedan Province, Iran. Chromosom Bot. 2013;8:103–8.
Semple J, Watanabe K. A review of chromosome numbers in Asteraceae
with hypotheses on chromosomal base number evolution. In: Funk V,
Stuessy T, Bayer R, editors. Systematics, Evolution and Biogeography of the
Compositae. Washington: IAPT; 2009. p. 61–72.
Chehregani A, Mehanfar N. New chromosome counts in the tribe
Anthemideae (Asteraceae) from Iran. Cytologia (Tokyo). 2008;73:189–96.
Siljak-Yakovlev S, Pustahija F, Vicic V, Robin O. Molecular cytogenetics
(FISH and fluorochrome banding): resolving species relationships and
genome organization. Methods Mol Biol. 2014;1115:309–23.
Garcia S, Panero JL, Siroky J, Kovarik A. Repeated reunions and splits feature
the highly dynamic evolution of 5S and 35S ribosomal RNA genes (rDNA) in
the Asteraceae family. BMC Plant Biol. 2010;10:176.
Liu B, Davis TM. Conservation and loss of ribosomal RNA gene sites in
diploid and polyploid Fragaria (Rosaceae). BMC Plant Biol. 2011;11:157.
Mahelka V, Kopecky D, Baum BR. Contrasting patterns of evolution of 45S
and 5S rDNA families uncover new aspects in the genome constitution of
the agronomically important grass Thinopyrum intermedium (Triticeae). Mol
Biol Evol. 2013;30:2065–86.
Garcia S, Inceer H, Garnatje T, Vallès J: Genome size variation in some
representatives of the genus Tripleurospermum. Biologia Plantarum. 2005,
49:381–387
Garnatje T, Garcia S, Vilatersana R, Vallès J. Genome size variation in the
genus Carthamus (Asteraceae, Cardueae): systematic implications and
additive changes during allopolyploidization. Ann Bot. 2006;97:461–7.
Olanj et al. BMC Plant Biology (2015) 15:174
30. Pellicer J, Garcia S, Canela MA, Garnatje T, Korobkov AA, Twibell JD, et al.
Genome size dynamics in Artemisia L. (Asteraceae): following the track of
polyploidy. Plant Biol (Stuttg). 2010;12:820–30.
31. Maghuly F, Schmoellerl B, Temsch EM, Laimer M. Genome size, karyotyping
and FISH physical mapping of 45S and 5S genes in two cherry rootstocks:
Prunus subhirtella and Prunus incisa xserrula. J Biotechnol. 2010;149:88–94.
32. Bennett M. Nuclear DNA amounts in angiosperms and their modern
uses—807 new Estimates. Ann Bot. 2000;86:859–909.
33. Mortreau E, Siljak-Yakovlev S, Cerbah M, Brown SC, Bertrand H, Lambert C.
Cytogenetic characterization of Hydrangea involucrata Sieb. and H. aspera D.
Don complex (Hydrangeaceae): genetic, evolutional, and taxonomic
implications. Tree Genet Genomes. 2009;6:137–48.
34. De Jesus ON, de OE SS, Amorim EP, Ferreira CF, de Campos JMS, Silva G de
G, et al. Genetic diversity and population structure of Musa accessions in
ex situ conservation. BMC Plant Biol. 2013;13:41.
35. Abd El-Twab M, Kondo K. Physical mapping of 5S and 45S rDNA in
Chrysanthemum and related genera of the Anthemideae by FISH, and
species relationships. J Genet. 2012;91:245–9.
36. Garcia S, Lim KY, Chester M, Garnatje T, Pellicer J, Vallès J, et al. Linkage of
35S and 5S rRNA genes in Artemisia (family Asteraceae): first evidence from
angiosperms. Chromosoma. 2009;118:85–97.
37. Keskitalo M, Lindén A, Valkonen JPT. Genetic and morphological diversity of
Finnish tansy (Tanacetum vulgare L., Asteraceae). Theor Appl Genet.
1998;96:1141–50.
38. Siljak-Yakovlev S, Pustahija F, Šolić EM, Bogunić F, Muratović E, Bašić N,
et al. Towards a genome size and chromosome number database of
Balkan Flora: C-values in 343 taxa with novel values for 242. Adv Sci Lett.
2010;3:190–213.
39. Garcia S, Hidalgo O, Jakovljević I, Siljak-Yakovlev S, Vigo J, Garnatje T, et al.
New data on genome size in 128 Asteraceae species and subspecies, with
first assessments for 40 genera, 3 tribes and 2 subfamilies. Plant Biosyst - An
Int J Deal with all Asp Plant Biol. 2013;147:1219–27.
40. Funk V, Stuessy T, Bayer R. Systematics, Evolution, and Biogeography of
Compositae. Washington: IAPT; 2009.
41. Sonboli A, Kazempour Osaloo S, Vallès J, Oberprieler C. Systematic status
and phylogenetic relationships of the enigmatic Tanacetum paradoxum
Bornm. (Asteraceae, Anthemideae): evidences from nrDNA ITS,
micromorphological, and cytological data. Plant Syst Evol. 2011;292:85–93.
42. Leitch IJ, Soltis DE, Soltis PS, Bennett MD. Evolution of DNA amounts across
land plants (Embryophyta). Ann Bot. 2005;95:207–17.
43. Garcia S, Sanz M, Garnatje T, Kreitschitz A, Mcarthur ED, Vallès J: Variation of
DNA amount in 47 populations of the subtribe Artemisiinae and related taxa
(Asteraceae, Anthemideae): karyological, ecological, and systematic
implications. Genome. 2004, 1014:1004–1014.
44. Soltis DE, Albert VA, Leebens-Mack J, Bell CD, Paterson AH, Zheng C, et al.
Polyploidy and angiosperm diversification. Am J Bot. 2009;96:336–48.
45. Garcia S, Garnatje T, Pellicer J, McArthur ED, Siljak-Yakovlev S, Vallès J.
Ribosomal DNA, heterochromatin, and correlation with genome size in
diploid and polyploid North American endemic sagebrushes
(Artemisia, Asteraceae). Genome. 2009;52:1012–24.
46. Marques I, Draper D, Riofrío L, Naranjo C. Multiple hybridization events,
polyploidy and low postmating isolation entangle the evolution of
neotropical species of Epidendrum (Orchidaceae). BMC Evol Biol. 2014;14:20.
47. Leitch AR, Leitch IJ. Genomic plasticity and the diversity of polyploid plants.
Science. 2008;320:481–3.
48. Parisod C, Holderegger R, Brochmann C. Evolutionary consequences of
autopolyploidy. New Phytol. 2010;186:5–17.
49. Parisod C, Senerchia N. Responses of transposable elements to polyploidy.
In: Grandbastien MA, Casacuberta JM, editors. Plant Transposable Elements.
Berlin Heidelberg: Springer; 2012. p. 147–68.
50. Tayalé A, Parisod C. Natural pathways to polyploidy in plants and
consequences for genome reorganization. Cytogenet Genome Res.
2013;140:79–96.
51. Leitch IJ, Bennett MD. Genome downsizing in polyploid plants. Biol J Linn
Soc. 2004;82:651–63.
52. Otto SP, Whitton J. Polyploid incidence and evolution. Annu Rev Genet.
2000;34:401–37.
53. Wolfe KH. Yesterday’s polyploids and the mystery of diploidization. Nat Rev
Genet. 2001;2:333–41.
54. Soltis PS, Soltis DE. Polyploidy and Genome Evolution. Berlin Heidelberg:
Springer; 2012.
Page 15 of 16
55. Garcia S, Canela MÁ, Garnatje T, Mcarthur ED, Pellicer J, Sanderson SC, et al.
Evolutionary and ecological implications of genome size in the North
American endemic sagebrushes and allies (Artemisia, Asteraceae). Biol J Linn
Soc. 2008;94:631–49.
56. Leitch IJ, Hanson L, Lim KY, Kovarik A, Chase MW, Clarkson JJ, et al. The ups
and downs of genome size evolution in polyploid species of Nicotiana
(Solanaceae). Ann Bot. 2008;101:805–14.
57. Renny-Byfield S, Kovařík A, Chester M, Nichols RA, Macas J, Novák P, et al.
Independent, rapid and targeted loss of highly repetitive DNA in natural and
synthetic allopolyploids of Nicotiana tabacum. PLoS One. 2012;7:e36963.
58. Hadjikyriakou G, Hadjisterkotis E. The adventive plants of Cyprus with new
records of invasive species. Z Jagdwiss. 2002;48:59–71.
59. Mito T, Uesugi T. Invasive alien species in Japan: the status quo and the
new regulation for prevention of their adverse effects. Glob Environ Res.
2004;8:171–93.
60. Bennett M. DNA Amounts in two samples of angiosperm weeds. Ann Bot.
1998;82:121–34.
61. Knight CA, Ackerly DD. Variation in nuclear DNA content across environmental
gradients: a quantile regression analysis. Ecol Lett. 2002;5:66–76.
62. Pandit MK, White SM, Pocock MJO. The contrasting effects of genome size,
chromosome number and ploidy level on plant invasiveness: a global
analysis. New Phytol. 2014;203:697–703.
63. Suda J, Meyerson LA, Leitch IJ, Pyšek P. The hidden side of plant invasions:
the role of genome size. New Phytol. 2015;205:994–1007.
64. Cabral JS, Felix LP, Guerra M. Heterochromatin diversity and its co-localization
with 5S and 45S rDNA sites in chromosomes of four Maxillaria species
(Orchidaceae). Genet Mol Biol. 2006;29:659–64.
65. Gouja, H., Garnatje, T., Hidalgo, O., Neffati, M., Raies, A., & Garcia, S. (2014).
Physical mapping of ribosomal DNA and genome size in diploid and
polyploid North African Calligonum species (Polygonaceae). Plant
Systematics and Evolution, 301: 1569-1579
66. Carvalho R, Soares Filho WS, Brasileiro-Vidal AC, Guerra M. The relationships
among lemons, limes and citron: a chromosomal comparison. Cytogenet
Genome Res. 2005;109:276–82.
67. Da Silva AEB, Marques A, dos Santos KGB, Guerra M. The evolution of CMA
bands in Citrus and related genera. Chromosome Res. 2010;18:503–14.
68. Beridze T, Tsirekidze N, Roytberg M. On the tertiary structure of satellite
DNA. Biochimie. 1992;74:187–94.
69. Torrell M, Cerbah M, Siljak-Yakovlev S, Vallès J. Molecular cytogenetics of the
genus Artemisia (Asteraceae, Anthemideae): fluorochrome banding and
fluorescence in situ hybridization. I. Subgenus Seriphidium and related taxa.
Plant Syst Evol. 2003;239:141–53.
70. Garcia S, Garnatje T, Hidalgo O, McArthur ED, Siljak-Yakovlev S, Vallès J.
Extensive ribosomal DNA (18S-5.8S-26S and 5S) colocalization in the North
American endemic sagebrushes (subgenus Tridentatae, Artemisia,
Asteraceae) revealed by FISH. Plant Syst Evol. 2007;267:79–92.
71. Garnatje T, Hidalgo O, Vitales D, Pellicer J, Vallès J, Robin O, et al. Swarm of
terminal 35S in Cheirolophus (Asteraceae, Centaureinae). Genome.
2012;55:529–35.
72. Abd El-Twab MH, Motohashi T, Fujise A, Tatarenko E, Kondo K, Kholboeva
SA, et al. Characterization of chromosome complement in Filifolium sibiricum
(L.) Kitamura by aceto-orcein, CMA, DAPI and FISH 5S and 45S rDNA.
Chromosome Bot. 2011;6:75–80.
73. Dydak M, Kolano B, Nowak T, Siwinska D, Maluszynska J. Cytogenetic studies
of three European species of Centaurea L. (Asteraceae). Hereditas.
2009;146:152–61.
74. Garnatje T, Vallès J, Vilatersana R, Garcia-Jacas N, Susanna A, Siljak-Yakovlev
S. Molecular cytogenetics of Xeranthemum L. and related genera
(Asteraceae, Cardueae). Plant Biol (Stuttg). 2004;6:140–6.
75. Vanzela ALL, Ruas CF, Oliveira MF, Ruas PM. Characterization of diploid,
tetraploid and hexaploid Helianthus species by chromosome banding and
FISH with 45S rDNA probe. Genetica. 2002;114:105–11.
76. Zhang R, Zhang C-T. Isochore structures in the genome of the plant
Arabidopsis thaliana. J Mol Evol. 2004;59:227–38.
77. Meyers BC, Tingey SV, Morgante M. Abundance, distribution, and
transcriptional activity of repetitive elements in the maize genome. Genome
Res. 2001;11:1660–76.
78. Hidalgo O, Garcia-Jacas N, Garnatje T, Romashchenko K, Susanna A,
Siljak-Yakovlev S. Extreme environmental conditions and phylogenetic
inheritance: systematics of Myopordon and Oligochaeta (Asteraceae,
Cardueae-Centaureinae). Taxon. 2008;57:769–78.
Olanj et al. BMC Plant Biology (2015) 15:174
79. Siljak-Yakovlev S, Cartier D. Heterochromatin patterns in some taxa of Crepis
praemorsa complex. Caryologia. 1986;39:27–32.
80. Abd El-Twab MH, Kondo K. FISH physical mapping of 5S, 45S and
Arabidopsis-type telomere sequence repeats in Chrysanthemum zawadskii
showing intra-chromosomal variation and complexity in nature.
Chromosome Bot. 2006;1:1–5.
81. Srisuwan S, Sihachakr D, Siljak-Yakovlev S. The origin and evolution of sweet
potato (Ipomoea batatas Lam.) and its wild relatives through the
cytogenetic approaches. Plant Sci. 2006;171:424–33.
82. Honda Y, Abd El-Twab MH, Ogura H, Kondo K, Tanaka R, Shidahara T. Counting
sat-chromosome numbers and species characterization in wild species of
Chrysanthemum sensu lato by fluorescent in situ hybridization using pTa71
probe. Chromosom Sci. 1997;1:77–81.
83. Pedrosa-Harand A, de Almeida CCS, Mosiolek M, Blair MW, Schweizer D,
Guerra M. Extensive ribosomal DNA amplification during Andean common
bean (Phaseolus vulgaris L.) evolution. Theor Appl Genet. 2006;112:924–33.
84. Roa F, Guerra M. Distribution of 45S rDNA sites in chromosomes of plants:
structural and evolutionary implications. BMC Evol Biol. 2012;12:225.
85. Knight C, Clancy R, Götzenberger L: On the relationship between pollen size
and genome size. J Bot 2010, 2010. />2010/612017/abs/.
86. Bainard JD, Husband BC, Baldwin SJ, Fazekas AJ, Gregory TR, Newmaster SG,
et al. The effects of rapid desiccation on estimates of plant genome size.
Chromosome Res. 2011;19:825–42.
87. Robertson A, Rich TCG, Allen AM, Houston L, Roberts C, Bridle JR, et al.
Hybridization and polyploidy as drivers of continuing evolution and
speciation in Sorbus. Mol Ecol. 2010;19:1675–90.
88. Kellogg EA, Camara PEAS, Rudall PJ, Ladd P, Malcomber ST, Whipple CJ,
et al. Early inflorescence development in the grasses (Poaceae). Front Plant
Sci. 2013;4:250.
89. Kellogg EA, Bennetzen JL. The evolution of nuclear genome structure in
seed plants. Am J Bot. 2004;91:1709–25.
90. Cerbah M, Coulaud J: rDNA organization and evolutionary relationships in
the genus Hypochaeris (Asteraceae). Journal of Heredity. 1998:312–318.
91. Geber G, Schweizer D. Cytochemical heterochromatin differentiation in
Sinapis alba (Cruciferae) using a simple air-drying technique for producing
chromosome spreads. Plant Syst Evol. 1987;158:97–106.
92. Schweizer D. Reverse fluorescent chromosome banding with chromomycin
and DAPI. Chromosoma. 1976;58:307–24.
93. Garcia S, Garnatje T, Kovařík A. Plant rDNA database: ribosomal DNA loci
information goes online. Chromosoma. 2012;121:389–94.
94. Garcia S, Gálvez F, Gras A, Kovařík A, Garnatje T. Plant rDNA database:
update and new features. Database (Oxford). 2014;2014:bau063.
95. Marie D, Brown SC. A cytometric exercise in plant DNA histograms, with 2C
values for 70 species. Biol Cell. 1993;78:41–51.
96. Loureiro J, Rodriguez E, Dolezel J, Santos C. Comparison of four nuclear
isolation buffers for plant DNA flow cytometry. Ann Bot. 2006;98:679–89.
97. Garnatje T, Canela MÁ, Garcia S, Hidalgo O, Pellicer J, Sánchez-Jiménez I,
et al. GSAD: a genome size in the Asteraceae database. Cytometry A.
2011;79:401–4.
98. Garcia S, Leitch IJ, Anadon-Rosell A, Canela MÁ, Gálvez F, Garnatje T, et al.
Recent updates and developments to plant genome size databases. Nucleic
Acids Res. 2014;42:D1159–66.
99. Hall T. BioEdit: a user-friendly biological sequence alignment editor and analysis
program for Windows 95/98/NT. Nucleic Acids Symp Ser. 1999;41:95–8.
100. Huelsenbeck J, Ronquist F, Nielsen R, Bollback J. Bayesian inference of
phylogeny and its impact on evolutionary biology. Science. 2001;294:2310–4.
101. Darriba D, Taboada G, Doallo R, Posada D. jModelTest 2: more models, new
heuristics and parallel computing. Nat Methods. 2012;9:772–2.
102. Akaike H. A Bayesian extension of the minimum AIC procedure of
autoregressive model fitting. Biometrika. 1979;66:237–42.
103. Maddison WP, Maddison DR: Mesquite: a modular system for evolutionary
analysis. Version 3.02. 2015. .
104. Garcia S. The striking and unexpected cytogenetic diversity of genus
Tanacetum L. (Asteraceae): a cytometric and fluorescent in situ hybridisation
study of Iranian taxa. TreeBase 2015.
105. Sonboli A, Olanj N, Pourmirzaei A. Biosystematics and phylogeny of
Tanacetum fisherae, a new record from Iran. Rostaniha. 2011;12:165–75.
Page 16 of 16
Submit your next manuscript to BioMed Central
and take full advantage of:
• Convenient online submission
• Thorough peer review
• No space constraints or color figure charges
• Immediate publication on acceptance
• Inclusion in PubMed, CAS, Scopus and Google Scholar
• Research which is freely available for redistribution
Submit your manuscript at
www.biomedcentral.com/submit