Effects of population structure on pollen flow, clonality rates and reproductive success in fragmented Serapias lingua populations
Bạn đang xem bản rút gọn của tài liệu. Xem và tải ngay bản đầy đủ của tài liệu tại đây (1.07 MB, 10 trang )
Pellegrino et al. BMC Plant Biology (2015) 15:222
DOI 10.1186/s12870-015-0600-8
RESEARCH ARTICLE
Open Access
Effects of population structure on pollen flow,
clonality rates and reproductive success in
fragmented Serapias lingua populations
Giuseppe Pellegrino*, Francesca Bellusci and Anna Maria Palermo
Abstract
Background: Fragmentation of habitats by roads, railroads, fields, buildings and other human activities
can affect population size, pollination success, sexual and asexual reproduction specially in plants showing
pollinator limitation, such as Mediterranean orchids. In this study, we assessed pollen flow, selfing rates,
vegetative reproduction and female reproductive success and their correlations with habitat characters in nine
fragmented subpopulations of Serapias lingua.
To improve understanding of population structure effects on plant biology, we examined genetic differentiation
among populations, pollen flow, selfing rates and clonal reproduction using nuclear microsatellite markers.
Results: Smaller populations showed a significant heterozygote deficit occurred at all five nuclear microsatellite
loci, the coefficient of genetic differentiation among populations was 0.053 and pairwise FST was significantly
correlated with the geographical distance between populations. Paternity analysis of seeds showed that most
pollen flow occurred within a population and there was a positive correlation between percentage of received
pollen and distance between populations.
The fruit production rate varied between 5.10 % and 20.30 % and increased with increasing population size,
while the percentage of viable seeds (78-85 %) did not differ significantly among populations. The extent of
clonality together with the clonal and sexual reproductive strategies varied greatly among the nine populations
and correlated with the habitats where they occur. The small, isolated populations tended to have high clonal
diversity and low fruit production, whereas the large populations with little disturbance were prone to have
reductions in clonal growth and increased sexual reproduction.
Conclusions: We found that clonality offers an advantage in small and isolated populations of S. lingua, where
clones may have a greater ability to persist than sexually reproducing individuals.
Background
Fragmentation of plant populations, the process by
which formerly continuous populations turn into
patches of different sizes, isolated from each other, may
have distinctive effects on populations: (1) affecting reproductive success, (2) altering patterns of pollen-mediated
gene flow (pollen flow) and (3) affecting self-pollination
and vegetative propagation. Although many plant populations are naturally isolated and small, populations of
numerous plant species have become more isolated as a
result of the recent anthropogenic fragmentation of
* Correspondence:
Dept. of Biology, Ecology and Earth Sciences, University of Calabria, I-87036
Rende, (CS), Italy
habitats by roads, railroads, fields, buildings and other
human activities [1, 2].
Fragmentation and the abundance of a plant species
can have striking effects on the visitation rate and floral
constancy of its pollinators, with potentially major impacts on the plant's reproductive success, reducing the
abundance and species richness of pollinators, altering
their foraging behaviour and limiting pollinator movement among populations [3, 4]. Thus, plants receive
fewer flower visits suffering pollen limitation and reduction in reproductive success. Studies of local population density and size clearly show that pollination and
reproductive success decrease in sparse and small populations [5]. Reductions in reproductive success due to
© 2015 Pellegrino et al. Open Access This article is distributed under the terms of the Creative Commons Attribution 4.0
International License ( which permits unrestricted use, distribution, and
reproduction in any medium, provided you give appropriate credit to the original author(s) and the source, provide a link to
the Creative Commons license, and indicate if changes were made. The Creative Commons Public Domain Dedication waiver
( applies to the data made available in this article, unless otherwise stated.
Pellegrino et al. BMC Plant Biology (2015) 15:222
reduced insect movements are particularly strong for
plants which show a high degree of dependence on
their pollinator mutualism (i.e. pollinator limitation) for
fruit production [6], such as Mediterranean deceptive
orchids [7].
Sexual reproduction is predominantly pollinator
dependent, even if it may sometimes be successfully guaranteed by asexual reproduction or self-pollination. Selfpollinating populations are more likely to establish in
habitats where pollinators appear to be scarce, in which
population size is small [8], and in environments with limited opportunity for outcrossing [9].
The complex flower structures and pollination strategies
of orchids are the best-documented examples of selection
for outcrossing in flowering plants to avoid inbreeding.
However, auto-pollinating orchids are relatively frequent
in geographically isolated and/or pollinator-scarce environments such as higher latitudes/elevations, coastal areas
and islands [10, 11], supporting the ‘reproductive assurance’ hypothesis in which selection favours increased
self-pollination to ensure the persistence of populations
in situations in which pollinator service strongly limits
reproduction [12]. Approximately 20 % of terrestrial
orchid species in which the pollination system has been
investigated are capable of auto-pollination [11, 13],
suggesting that autopollination is indeed common in
Orchidaceae [14].
In the plant kingdom reproduction can be assured by
vegetative reproduction, a typical asexual reproduction
whereby new individuals are formed without the production of seeds, including the formation of new plants out of
rhizomes, bulbs or tubers. Vegetative propagation leads to
a clonal structure in which one clone (genet) may consist
of several individuals (ramets). The most obvious genetic
signature of vegetative propagation in a population is the
presence of repeated multilocus genotypes (MLGs) and, as
a consequence, heterozygosity and allelic diversity at each
locus are expected to increase [15]. Many orchid species
have the capacity for vegetative propagation which can
represent the prevalent pattern of population maintenance. There are several patterns of vegetative reproduction
in orchids, varying between species possessing different
life forms [16]. The most widespread pattern of vegetative
multiplication in orchids is the formation and germination
of two or more buds, including dormant ones, on axial
organs such as rhizomes, creeping shoots and shoot tubers [17]. The daughter shoots are connected with the
maternal ones for a long time. The daughter shoots in
orchids with shoot rhizomes or bulbotubers (Anacamptis, Dactylorhiza, Orchis, Ophrys, Serapias, etc.) separate most rapidly, after 1–2 years [18]. Among orchids
we can distinguish those with obligate vegetative propagation, those with facultative vegetative propagation,
which includes short-rhizome and most tuberoidous
Page 2 of 10
orchids, and those with vegetative propagation occurring in exceptional cases [16].
An explicit method to clarify and quantify the direction of pollen flow between populations and to verify
the presence of spontaneous self pollination or vegetative reproduction is the molecular analysis of plants
and paternity analysis of seeds collected from known
mothers to determine the origin of the pollen that fertilized the ovules.
In this study, we assessed pollen flow, selfing rates,
vegetative reproduction and female reproductive success in nine fragmented subpopulations of an orchid
species, Serapias lingua. This species dependent upon
insect pollinators to ensure its reproduction, is selfcompatible and able to vegetatively reproduce [19] and
thus, is suitable for investigating the effects of population fragmentation on gene flow, selfing/clonality rates
and reproductive success.
More specifically, we aimed at (1) determining the genetic population structure to quantify clonality rates; (2)
examining fruit production rates in the studied populations to obtain estimates of female reproductive success;
and (3) examining a paternity analysis of seeds collected
from the plants.
Methods
Study species
The genus Serapias L. is distributed throughout the
Mediterranean region with its centre of diversity in
southern Italy and on the Greek islands [20].
Serapias lingua (tongue orchid) is a short-lived tuberous orchid and a tetraploid species [21]. It has dullcoloured flowers of uniform structure: the all three sepals
and the hypochile (the proximal part of the lip) form a
hood (tubular corolla), a unique shiny, more or less round
callosity, is present at the base of the hypochile, the
epichile (the distal part of the lip) is generally inclined
downwards. The petals and lip are characterized by conical epidermal papillae and two types of trichome with
secretory apical cells [22]. It is a widespread species,
mainly distributed in the Mediterranean-Atlantic countries (Portugal, Spain, France, Italy, Balkans, Greece), but
reaching western North Africa (Morocco, Tunisia). It
grows in arid or wet meadows, abandoned agricultural
soils, garigue and bushy environments up to 1200 m a.s.l.
[23]. Recent molecular analysis strongly supports a natural split of S. lingua into a subgroup strictly related to
S. gregaria and S. olbia, two rare endemics of the Var
and Maritime Alps regions [24].
In the last years the pollination strategy of S. lingua
has received more attention, and preliminary observations indicate that Ceratina cucurbitina males are the
main pollinators [14, 25]. While other Serapias species
offer insects a floral tube in which to rest or sleep (shelter
Pellegrino et al. BMC Plant Biology (2015) 15:222
imitation strategy), S. lingua seems to have evolved to
sexually deceive pollinators, analogous to what is observed
in Ophrys orchids [26], a phenomenon also supported by
the finding of large amounts of alkanes and alkenes in its
floral odour extracts [27, 28].
Study area and measures of population size and density
The research site is located in southern Italy (Calabria
region). It covers approximately 700 ha and consists of
calcareous, dry grasslands (Festuco-Brometalia); Spartium
junceum L., Cytisus sessilifolius L. and Cistus incanus L.
are frequent shrubs and Festuca circummediterranea
Patzke, Bromus erectus Huds. and Dactylis glomerata L.
are the dominant herbs.
Serapias lingua grows over the entire area, forming
populations of a few to thousands of individuals. We
define ‘a population’ here as a group of S. lingua individuals in a discrete area, each of which is separated from a
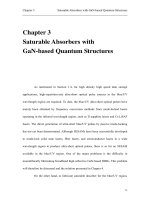
neighbouring population by at least 300 m (Fig. 1). A
total of 9 populations were identified; three (C, F, G) are
found in a highly anthropic landscape context enclosed by
busy roads and their intersections, while the remaining six
(A, B, D, E, H, I) are non-anthropic (natural) populations.
No other population is present in or around the study area
and the nearest population outside the study area is about
5 km north of population A.
In Spring 2014 the population size (i.e. the total number of individuals in a specific area) and population
density (i.e. the population size divided by total area)
was determined for each population. For population
size, we individually marked and counted the number
of all (flowering and vegetative) individuals in the three
smaller populations (C, F, G), while within each other
Page 3 of 10
populations we marked and counted the number of
individuals in five selected square grid (10 by 10 m size)
separated by 30–50 m. The measurements resulting
from the five plots for each population were grouped
and used to calculated population size. For population
density, we calculated the area of the population (in
square metres) identifying the boundaries of each population using the outermost individuals (Table 1). Voucher specimens were deposited at the herbarium at the
University of Calabria (CLU).
Measures of reproductive success
To test natural reproductive success, in the three smaller
populations and in five square grid for each of the
remaining six populations, the number of flowers that
produced fruits was counted and the fruit set was determined as the average of ratios (number of produced
fruits/number of available flowers) over the examined
plants. To ascertain the presence of viable embryos, at
least 1000 seeds from each fruit were removed from the
centre of the capsule and observed under an optical
microscope (100x). Seeds were assigned to two categories (viable and unviable seeds) due to the presence or
absence of viable embryos. The seed set [(the number
of filled seeds in sampled fruits/the number of observed
seeds) × 100] were calculated for every fruit.
In addition, in each population five individuals with
unopened flowers were bagged with a fine-meshed cloth
to exclude pollinators to test for spontaneous autogamy.
In June, the number of produced fruits was counted, and
the ratio between the number of fruits/treated flowers
was determined.
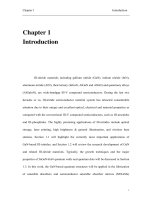
Fig. 1 Spatial distribution of Serapias lingua populations. Red areas indicate the nine populations defined by this study. Arrows represent pollen
flow and the numbers by the arrows indicate the numbers of pollen migration events. Figure was created by G. Pellegrino (the first author)
Pellegrino et al. BMC Plant Biology (2015) 15:222
Page 4 of 10
Table 1 Population size and density, fruit production rate, percentage of viable seeds, immigration rate by pollen per population
Population Pop area Pop size
(in square
meters)
Pop density Fruit set (%)
Viable seeds (%) Immigration rate Pollen source population
by pollen (%)
A
B
C D
E
A
3578.25
~2800
0.78
13.58
82.78 ± 3.73
28.68
553 6
B
2540.20
~2000
0.79
20.30
79.85 ± 2.44
32.02
22
C
64.20
302
4.70
5.20
78.55 ± 2.13
9.38
D
3451.22
~3000
0.87
14.23
81.21 ± 2.86
28.34
E
2962.40
~2500
0.84
15.60
85.35 ± 3.83
27.49
F
55.80
321
5.75
5.50
81.21 ± 3.27
11.11
G
65.54
284
4.31
5.10
82.24 ± 2.33
7.14
H
4585.30
~3200
0.70
14.68
82.54 ± 3.66
30.53
I
2542.60
~2200
0.86
16.75
79.65 ± 2.05
28.64
DNA extraction and microsatellite genotyping
One leaf from each individual in the three smaller populations and from each individual in the five selected
areas of other six populations was sampled and stored in
silica gel for subsequent DNA extraction and microsatellite (Short Sequence Repeat, SSR) genotyping. Genomic
DNA was extracted using a slight modification of the
CTAB (cetyltrimethyl ammonium bromide) protocol of
Doyle and Doyle [29]. Approx. 0.5 g of each leaf were
separately pestled in a 2 ml-Eppendorf vial using 500 μL
of standard CTAB buffer, incubated at 60 °C for 30 min,
extracted twice by adding 500 μL chloroform-isoamyl
alcohol (24:1), precipitated with isopropanol and washed
with 250 μL of ethanol 70 %. The DNA was re-suspended
in 50 μL of distilled water.
To characterize the genetic structure of each population
and genotype, we performed microsatellite genotyping on
all the adult plants using five nuclear microsatellite loci
previously isolated and tested on Serapias sp. [19, 30]. All
PCR reactions of 100 μl final volume contained 40 ng of
genomic DNA, 100 μM of each dNTP, 0.3 μM of each
primer, 2 units of Taq polymerase, 2 μM MgCl2 and 10 μl
of reaction buffer. The amplification conditions were:
1 cycle of 94 °C for 3 min;30 cycles 30 s at 94 °C, 45 s at
the locus specific annealing temperature (55 or 58 °C),
and 30 s at 72 °C using a Perkin Elmer thermal cycler.
One of the PCR primers for each locus was labeled with
fluorescent dye (FAM, TET). Labelled PCR products were
run together with the internal size standard GeneScan
ROX400 on an ABI 3110 (Perkin Elmer, Biosystems), and
individuals were genotyped using Genescan Analysis software and Genotyper software (Perkin Elmer, Biosystems).
Clonality rates
Multilocus genotypes (MLGs) were assigned manually.
Because individuals with the same MLG found in populations with both sexual and vegetative reproduction can
be either ramets of the same genet or derive by chance
from distinct events of sexual reproduction, we used the
571
1
151
102 8
F
114
I
112
29 1
610 8
15
1
565
11
81
84
32
2
12
H
203 24
2
40
G
6
2
26
209
182 9
609 6
1
535
program GIMLET 1.3.2 [31] to estimate the probability
that two individuals, randomly sampled from a population, shared the same MLG by chance (probability of
identity: PI).
Two different genotypic diversity indexes were calculated. The first measure was G/N, the ratio between the
number of MLGs and the total number of individuals in a
population [32]. Values of this index vary from zero (strict
clonality) in which all individuals share the same MLG, to
one (sexual reproduction) in which each individual has a
distinct MLG. The second measure was MLG diversity
(DG) [33] which measures the probability that two individuals randomly selected from a population of N individuals
will have different MLGs. Similar to the first measure, DG
ranges from zero indicating that there is only one dominant clone, to one suggesting that every individual has a
different genotype.
Genetic variability
Population genetic analyses were based on a ‘corrected’
dataset in which all individuals with the same MLG were
considered as ramets of a single genet. For nSSRs, the
number of alleles, number of alleles per locus (Na) and
per population (Nap) [34], observed heterozygosity (HO),
gene diversity (HE) [35], and fixation index (FIS = 1 –
HO/HE) were calculated for each locus and each population using FSTAT version 2.9.3.2 [36]. Departures from
Hardy–Weinberg equilibrium at each locus and linkage
disequilibrium between loci were tested by an exact test
using a Markov chain method implemented in GENE
POP version 4.0 [37], with Bonferroni corrections. HT
and HS [35], and FST [38] were estimated using FSTAT.
HT is the gene diversity in the total population, HS is the
average gene diversity within populations, and FST is
the coefficient of genetic differentiation among populations under an infinite allele model. Pairwise FST values
were tested for significance by permuting genotypes
among populations. To test for the presence of isolation
by distance, a Mantel test between population-pairwise
Pellegrino et al. BMC Plant Biology (2015) 15:222
geographic distance and FST/(1 – FST) was applied [37].
Null allele (alleles that did not give a polymerase chain
reaction product) frequencies were estimated using the
maximum-likelihood (ML) estimator based on the EM
algorithm and implemented by default in GENEPOP 4.0
[37]. Based on microsatellite allele frequencies, recent
population bottlenecks were checked by BOTTLENECK
[39], employing the Two Phase Mutation model (TPM)
with a 95 % Stepwise Mutation Model (SMM) and 5 %
multistep mutations. Significance was assessed using
the Wilcoxon test. The bottleneck program [40] was
used as an alternative measure of genetic bottlenecks to
test for excess gene diversity relative to that expected
under mutation-drift equilibrium. The heterozygosity
excess method exploits the fact that allele diversity is
reduced faster than heterozygosity during a bottleneck,
because rare alleles are lost rapidly and have little effect
on heterozygosity, thus producing a transient excess in
heterozygosity relative to that expected in a population
of constant size with the same number of alleles [39].
Paternity assignment
Microsatellite profiles for each fruit were also determined
to ascertain if fruit developed by plants in each population
could have been produced by pollen transferred by
individuals of the same population or different donors.
In June, capsules were collected and seeds in the central part were used for molecular analysis. Seeds were
observed under a binocular microscope and approx. 50
viable seeds (which means seeds with an embryo) from
each capsule were collected and transferred into single
2 ml-Eppendorfs to extract their DNA. Nuclear microsatellite loci were amplified and analyzed following the protocol described above. Paternity analysis was performed by a
likelihood-based approach based on multilocus genotypes
for all adult genets and offspring using CERVUS version
2.0 [41]. In this study, the simulation parameters required
by the program were set as follows: 10 000 cycles, 4956
candidate parents (= all fruits collected across the study
population), 0.99 as the proportion of candidate parents
sampled, and 1.00 and 0.001 as the proportions of loci
typed and mistyped, respectively.
According to the assigned paternity data, we categorized the fruit as derived from selfing, outcrossing within
the study area, and outcrossing with a paternal parent
that was not present in the study area. We defined the
selfing rate as the number of selfed fruits divided by the
number of examined fruits from each population.
Page 5 of 10
distance between S. lingua populations ranged from
300 m to 2.5 km). Three populations (C, F, G) showed
significantly lower values of population size and higher
values of population density than the other six populations, such as they had lower population areas (Table 1).
Reproductive success
Significant differences were detected among the populations in their fruit production rate. Indeed, the populations differed significantly in their fruit sets, which
varied from 5.10 % to 20.30 % and was 14.53 % for the
nine populations on average. More specifically, the three
smallest populations in term of population size (C, F, G)
showed lower values than the other populations, which
showed values four times higher (Table 1). In contrast,
the populations did not differ significantly in their percentage of viable seeds, which varied from 78.55 (±2.13)
for population C to 85.35 (±3.83) for population E
(Table 1). The best explanation for the variation in the
fruit production rate is the positive correlation between
fruit set and population size. Indeed, the estimated parameter for the population size was positive, suggesting
that larger populations have higher outcrossing rates.
None of the 45 individuals (five per population) bagged
with a fine-meshed cloth to exclude pollinators showed
any spontaneous autogamy.
Presence and extent of clonal propagation
All populations were affected by different levels of
clonality. The population with the lowest G/N ratio
was C (0.067), and slightly higher values were shown
by the other two (F and G) small populations
(Table 2). Higher G/N values were found in the other
populations, ranging from 0.812 (population A) to
0.892 (population H). Similar results were found for
Table 2 Measures of clonal propagation: ratio between the
number of multilocus genotypes and the total number of
individuals (G/N), and multilocus genotype diversity (DG) in
nine populations of S. lingua
Population
G/N
DG
A
0.812
0.721
B
0.885
0.748
C
0.067
0.038
D
0.862
0.740
E
0.854
0.725
F
0.085
0.040
Results
G
0.088
0.041
Population size and density
H
0.892
0.794
I
0.886
0.784
mean
0.603
0.515
The stands differed in population size, ranging from
284 to ~3200 individuals, in population density (0.70–5.75
individuals/m2) (Table 1) and degree of isolation (the
Pellegrino et al. BMC Plant Biology (2015) 15:222
Page 6 of 10
multilocus genotype diversity (DG), which ranged from
close to zero (population C) to 0.794 (population H),
with a mean value of 0.215 (Table 2).
Genetic diversity and differentiation among populations
PCR products were successfully obtained from all examined individuals, their fragment lengths fit into the
predicted size ranges, and all examined loci were polymorphic across the nine populations. No significant linkage disequilibrium between loci was observed for any
population, so all loci were used for further analyses.
The total number of alleles per population ranged
between 4 and 15 (average 9.6 alleles) and the number
of alleles per locus ranged between 8 and 20 (data not
shown). Three populations (C, F, G) had a lower mean
allele number per population than the other populations, and possessed all alleles exhibited by natural
populations. Moreover, in anthropic populations the
observed heterozygosity was much less than expected
(HO = 0.38-0.42;HE = 0.52-0.60), while the other populations possessed higher heterozygosity (HO ranging from
0.77 to 0.80) that was close to expected values (HE
ranging from 0.75 to 0.79) (Table 3). Inbreeding
coefficients (FIS) calculated at each nSSR locus in each
population (45 values) varied among populations. Six
populations showed a low heterozygote excess ranging
from FIS = −0.02 (pop E) to FIS = −0.12 (pop A), while
three others showed a significant heterozygote deficit
(FIS = 0.22-0.28) at all five loci (Table 3). Few private
alleles were found in each population. The coefficient
of genetic differentiation among populations (FST) was
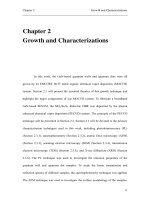
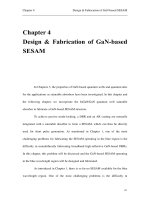
estimated to be 0.053 for nSSRs. Pairwise FST/(1 – FST)
was significantly correlated with the geographical distance between populations for nSSRs (P < 0.05, Fig. 2).
Bottleneck analysis revealed that three populations
had a significantly higher observed gene diversity than
expected under the 95 % Stepwise Mutation Model,
Table 3 Measures of number of alleles per population (Nap),
observed (HO) and exptected (HE) heterozygosity, and fixation
index FIS in nine populations of S. lingua
while no deviation from mutation-drift equilibrium was
found for any other population. In a population at
mutation-drift equilibrium (i.e., the effective size has
remained constant in the recent past), there is an
approximately equal probability that a locus shows
either a gene diversity excess or a gene diversity deficit.
Populations that have experienced a recent reduction in
their effective population size exhibit a correlative reduction in the number of alleles and gene diversity at polymorphic loci. But the number of alleles is reduced faster
than the gene diversity. Thus, in a recently bottlenecked
population, the observed gene diversity is higher than the
expected equilibrium gene diversity computed from the
observed number of alleles, under the assumption of a
constant-size (equilibrium) population [42].
Paternity assignment of seeds
In the paternity assignment experiments, 4967 fruits were
obtained from 5176 plants in nine populations (Table 1).
DNA extraction failed for 21 samples, but the paternity of
the remaining 4956 was examined and identified at a 95 %
confidence level. There was significant differentiation by
the paternity test among populations in term of the percentage of immigration rate, which varied from 7.14 %
(population G) to 32.02 % (population B). Indeed, in six
populations (A, B, D, E, H and I) the pollen parents of
approx 30 % of the fruit were located outside each
population, and the remaining 70 % within the population, while in three populations (C, F, G) the pollen parents of ~90 % and ~10 % of the fruit were located
within and outside each population, respectively. The
mother plants of populations A, B, D, E, H and I received
pollen widely from other populations. The maximum
pollen dispersal distance within the whole population was
1100 m. Interestingly, there was a positive correlation
between the percentage of received pollen and the distance between populations (Fig. 1). Indeed, greater gene
flow occurred between the nearest populations, while gene
flow was close to zero among the most distant populations. No fruits were produced by selfing.
Population
Nap
HO
HE
FIS
Discussion
A
15
0.784
0.774
−0.12
Population genetic structure
B
9
0.774
0.752
−0.04
C
4
0.418
0.594
0.25
D
10
0.789
0.755
−0.07
E
11
0.776
0.762
−0.02
F
6
0.422
0.524
0.28
G
5
0.382
0.516
0.22
H
14
0.782
0.789
−0.08
I
12
0.777
0.778
−0.04
Average
9.6
0.656
0.694
0.04
In this study analysis of microsatellite DNA variation in
Serapias revealed clear and significant genetic differentiation among populations, suggesting different levels
of gene flow between them.
In our investigations the number of alleles per locus
(8–18) and the mean of 9.6 alleles per population are
higher values than the alleles per locus (4–10) and
alleles per population (3.6-5.6) detected by Pellegrino et
al. [19, 43] in populations of other Serapias species (S.
parviflora, S. politisii and S. vomeracea). But these values
are similar to or slightly lower than those reported to date
Pellegrino et al. BMC Plant Biology (2015) 15:222
Page 7 of 10
Fig. 2 The correlation between pairwise FST/(1 – FST) and geographical distance
for other Mediterranean orchid genera, Dactylorhiza
[44], Gymnadenia [45, 46], and Ophrys [47, 48].
The five markers included in this study showed
medium levels of genetic variation (HE ranging from
0.69 to 0.79, average 0.694) compared with other microsatellite studies on orchids [47].
The low value of genetic differentiation among populations (FST=0.053) is due to the small geographic range of
the S. lingua populations studied. Indeed, similar genetic
differentiation values based on microsatellites have been
reported in other small orchid populations of Caladenia
huegelii [49] and Gastrodia elata [50], showing geographic
distances of 150 and 250 km, respectively.
Patterns of population genetic diversity and viability
may vary greatly across populations due to a multitude
of possible variables [51]. Populations may lose most of
their genetic diversity if they become very small and isolated [52]. Accordingly, we detected two distinct groups;
first group formed by the three smallest S. lingua populations (C, F, G) showed a substantial deficit in genetic
diversity, the largest difference between observed and
expected heterozygosity, and higher values of inbreeding coefficients (FIS), while the second group formed by
the other populations possessed observed heterozygosity close to expected heterozygosity values and lower
values of inbreeding coefficients (Table 3). The genetic
poorness of smaller populations often derives from limited connections to other populations [53].
Paternity test and gene flow
Data from the paternity test of seeds showed that there
were high frequencies of short-distance and low frequencies of long-distance pollen dispersal events. In the study
populations, greater gene flow occurred between the
nearest populations (distance from 300 to 500 m), while
the rate of gene flow decreased in populations farther
from each other (distance from 1000 to 1500 m) and
there was little or no inter-population gene flow between
the three smallest and most isolated populations (Fig. 2).
In addition, these three populations showed that the
flowers were pollinated in 90 % of cases by the pollen of
the same population and only 10 % by pollen from other
populations, which in contrast showed a greater flow of
pollen input. Pollination events between populations
increased with the geographical separation of the populations, suggesting that most movements of pollinators
occur within populations. This is probably a consequence
of inadequate pollinator visitation to small populations,
resulting in strong gene flow limitation [2, 54]. The greater
flow of pollen between the nearest populations is in agreement with the behaviour of pollinators. Indeed, recent
work based on the capture and recapture of pollinating
insects showed that the average distance travelled by pollinators was 300 m, and only a few insects were recaptured
at distances of approximately 1000 m [55]. But this does
not explain the lower pollen flow from outside the smaller
populations in comparison with the larger populations,
independent of the distance between the populations.
Probably, there are other factors that determine this
reduction. For example, one factor may be the population size, since the examined populations showed that
proportions of out-of-plot pollen flow were positively
correlated with the number of adult plants within the
population. Larger populations of plants are likely to be
more attractive to pollinators, resulting in higher visitation rates, whereas small fragmented populations may
be less attractive [56]. In addition, a population with a
longer perimeter will likely have more insects (i.e. pollinators) encounter it, resulting in increased pollination.
Moreover, a higher population density can result in
greater pollination between individuals in the same
population or an increase in the selfing rate [57]. In our
Pellegrino et al. BMC Plant Biology (2015) 15:222
case, as the species is self-compatible, but not capable
of producing fruits via spontaneous autogamy, the detected patterns can only be the result of active pollen
transfer by pollinators, and thus the pollination success
of S. lingua was significantly and positively related to
population size. This is in accordance with the outcome
of several studies on orchids that have already shown
that gene flow is often positively affected by increasing
population size [58]. In addition to the population size,
our study indicated that the population density of flowering plants also affected pollinia removal, which increased
when the local density decreased. This data is in apparent
contrast with many previous papers on food-deceptive orchids, and in agreement with studies on sexually deceptive
orchids. Indeed, Vandewoestijne et al. [59] showed that
pollinator activity generally increased with decreasing
population density in three Ophrys species, suggesting that
pollinator availability, rather than pollinator learning, is
the most limiting factor in successful pollination for sexually deceptive orchids. Moreover, in sexually deceptive orchids, insects rarely switch from one individual to another
close individual immediately after the first attempted
copulation, preferring to fly off at a greater distance from
the first individual [60], suggesting that the apparent
avoidance of multiple copulations within a small population will promote pollen flow over a greater distance [61].
Sexual reproductive success and clonality rates
The results reported here showed that clonality represents a common reproductive strategy in all analysed
populations, but clonality did not affect the different
populations of S. lingua equally. Six larger S. lingua populations showed higher levels of clonality (DG = 0.71-0.79),
for example, similar to those found in the endangered species Cypripedium calceolus (DG = 0.97; [62]), while the
lowest clonal diversity (G/N index) and reduced heterozygosity (HO = 0.38-0.42) in smaller populations, similar to
those found in polish Epipactis atrorubens [63] and
Cephalantera rubra populations [64], was a consequence
of particularly intensive vegetative reproduction. According to our data, the C, F, and G populations
showed a higher rate of clonality, while in other populations sexual strategies seemed to contribute more to
reproduction. A hypothesis that may explain the pattern of clonality that we found in smaller populations is
low sexual reproduction in these populations due to
pollinator limitation, as evidenced by the small number
of fruits produced. The balance between sex and clonal
growth varies between and within species and is mainly
driven by biotic and environmental factors [65]. Although
vegetative propagation has ecological costs related to
greater resource uptake, reduced pollen dispersal, or increased geitonogamous pollination [66], species showing
higher rates of clonality have several potential ecological
Page 8 of 10
and evolutionary advantages. In our case, S. lingua can
persist in small, isolated populations where conditions
are not favourable for sexual reproduction, providing a
form of reproductive assurance by guaranteeing the
survival of the species in case of limited pollinator
service [15]. Thus, the combination of the availability of
pollinators and the fruit set related to population size
characterizing each population and the distance between
neighbouring populations of S. lingua can explain the
different levels of clonal propagation we found in different populations. In particular, a higher rate of asexual
reproduction was found in C, F, and G than in other
populations, the former consisting of a few hundred
individuals located in a restricted area (about 70 m2)
closed to a crossroads, the latter comprising a thousand
individuals in a larger area (~0.5 ha). Populations subjected to more environmental stress and fragmentation
by roads, railroads, fields, buildings and other human
activities show higher levels of clonality [15, 67].
Conclusions
This study represents one of the few analyses of the effects
of population structure on the pollen flow and clonal
growth of a deceptive Mediterranean orchid. Population
fragmentation is likely to reduce reproductive success due
to reductions in population sizes and increases in the
geographic distance between populations. We found that
clonality offers an advantage in small and isolated populations of S. lingua, whereby clones may have a greater
ability to persist than sexually reproducing individuals
[61]. Since clonal growth is associated with a progressive
reduction in genotypic diversity, sexual reproduction
might be indispensable to the long-term success of a
species and clonal growth may play an important role
in prolonging the time to extinction when sex is
reduced or absent.
Abbreviations
CTAB: Cetyltrimethyl ammonium bromide; DG: Multilocus genotype diversity;
FIS: Fixation index; FST: Coefficient of genetic differentiation among populations;
HE: Gene diversity; HO: Observed heterozygosity; HS: Average gene diversity
within populations; HT: Gene diversity in the total population; ML: Maximumlikelihood; MLG: Multilocus genotypes; Na: Number of alleles per locus;
Nap: Number of alleles per population; PI: Probability of identity; SMM: Stepwise
mutation model; SSR: Short sequence repeat; TPM: Two phase mutation.
Competing interests
The authors declare that they have no competing interests.
Authors’ contributions
GP conceived of the study, and participated in its design and coordination
and was the key person writing the manuscript. FB carried out the
molecular genetic studies. AMP performed the statistical analysis and
participated in writing of the manuscript. All authors read and approved
the final manuscript.
Authors’ information
All authors belong to the Department of Biology, Ecology and Earth
Sciences, University of Calabria, I-87036 Rende (CS), Italy
Pellegrino et al. BMC Plant Biology (2015) 15:222
Acknowledgements
This work was supported by grants to GP and AMP from the University of
Calabria, Department of Biology, Ecology and Earth Sciences.
Received: 27 April 2015 Accepted: 2 September 2015
References
1. Newman BJ, Ladd P, Brundrett M, Dixon KW. Effects of habitat
fragmentation on plant reproductive success and population viability at the
landscape and habitat scale. Biol Conserv. 2013; 159:16–23.
2. Pellegrino G, Bellusci F. The effects of human disturbance on the
demography and reproductive success of Serapias cordigera (Orchidaceae).
Bot J Linn Soc. 2014; 176:408–20.
3. Aguirre A, Dirzo R. Effects of fragmentation on pollinator abundance and
fruit set of an abundant understory palm in a Mexican tropical forest. Biol
Conserv. 2008; 141:375–84.
4. Öckinger E, Dannestam Å, Smith HG. The importance of fragmentation and
habitat quality of urban grasslands for butterfly diversity. Landsc Urban Plan.
2009; 93:31–7.
5. Vranckx G, Jacquemyn H, Mergeay J, Cox K, Janssens P, Gielen BAS, et al.
The effect of drought stress on heterozygosity–fitness correlations in
pedunculate oak (Quercus robur). Ann Bot-London. 2014; 113:1057–69.
6. Nayak KG, Davidar P. Pollinator limitation and the effect of breeding systems
on plant reproduction in forest fragments. Acta Oecol. 2010;36:191–6.
7. Tremblay R, Ackerman JD, Zimmerman JK, Calvo RN. Variation in sexual
reproduction in orchids and its evolutionary consequences: a spasmodic
journey to diversification. Biol J Linn Soc. 2005; 84:1–54.
8. Busch JW. The evolution of self-compatibility in geographically peripheral
populations of Leavenworthia alabamica (Brassicaceae). Am J Bot. 2005;
92:1503–12.
9. Cheptou PO, Avendano V, Lyz G. Pollination processes and the Allee effect
in highly fragmented populations: consequences for the mating system in
urban environments. New Phytol. 2006; 172:774–83.
10. Gamish A, Fischer GA, Comes HP. Recurrent polymorphic mating type
variation in Madagascan Bulbophyllum species (Orchidaceae) exemplifies a
high incidence of auto-pollination in tropical orchids. Bot J Linn Soc. 2014;
175:242–58.
11. Zhou X, Lin H, Fan X-L, Gao J-Y. Autonomous self-pollination and insect
visitation in a saprophytic orchid, Epipogium roseum (D.Don) Lindl. Aust J Bot.
2012; 60:154–9.
12. Theologidis I, Chelo IM, Goy C, Teotònio H. Reproductive assurance drives
transitions to self-fertilization in experimental Caenorhabditis elegans. BMC
Biol. 2014; 12:93.
13. Peter CI, Johnson SD. Reproductive biology of Acrolophia cochlearis
(Orchidaceae): estimating rates of cross-pollination in epidendroid orchids.
Ann Bot-London. 2009; 104:573–81.
14. van der Cingel NA. An atlas of orchid pollination: European orchids.
London, UK: CRC Press; 2001.
15. Meloni M, Reid A, Caujapé-Castells J, Marrero Á, Fernández-Palacios JM,
Mesa-Coelo RA, et al. Effects of clonality on the genetic variability of rare,
insular species: the case of Ruta microcarpa from the Canary Islands. Ecol
Evol. 2013; 3:1569–79.
16. Tatarenko IV, Vakhrameeva MG. Vegetative propagation in orchids (in
Russian). Bulletin Botanicheskogo Sada imeni I.S. Kosenko Kubanskogo
Gosagrouniversiteta. 1998; 7:155–8.
17. Gifford E, Foster A. Morphology and Evolution of Vascular Plants. San
Francisco: W.H. Freeman & Co.; 1989.
18. Arditti J. Aspects of the physiology of orchids. Advances in botanical
research: Academic Press, London; 1979.
19. Pellegrino G, Musacchio A, Noce ME, Palermo AM, Widmer A. Reproductive
versus floral isolation among morphologically similar Serapias L. species
(Orchidaceae). J Hered. 2005; 96:15–23.
20. Baumann H, Künkele S. Die Gattung Serapias L. - eine taxonomische
übersicht. Mitteilungsblatt Beiträge zur Erhaltung Erforschung heimischer.
Orchideen. 1989; 21:701–946.
21. D’Emerico S, Pignone D, Scrugli A. Giemsa C-banded kary-otypes in Serapias
L. (Orchidaceae). Bot J Linn Soc. 2000; 133:485–92.
22. Barone Lumaga MR, Pellegrino G, Bellusci F, Perrotta E, Perrotta I, Musacchio
A. Comparative floral micromorphology in four sympatric species of
Serapias (Orchidaceae). Bot J Linn Soc. 2012; 169:714–24.
Page 9 of 10
23. Delforge P. Orchids of Europe. North Africa and the Middle East: Timber
Press, Portland, Oregon (USA); 2006.
24. Bellusci F, Pellegrino G, Palermo AM, Musacchio A. Phylogenetic
relationships in the orchid genus Serapias L. based on non-coding regions
of the chloroplast genome. Mol Phylogenet Evol. 2008; 47:986–91.
25. Vereecken NJ, Dafni A, Cozzolino S. Pollination syndromes in Mediterranean
orchids-implication for speciation, taxonomy and conservation. Bot Rev.
2010; 76:220–40.
26. Jersáková J, Johnson SD, Kindlmann P. Mechanisms and evolution of
deceptive pollination in orchids. Biol Rev. 2006; 81:219–35.
27. Schiestl FP, Cozzolino S. Evolution of sexual mimicry in the Orchidinae: the
role of preadaptations in the attraction of male bees as pollinators. BMC
Evol Biol. 2008; 8:27.
28. Pellegrino G, Luca A, Bellusci F, Musacchio A. Comparative analysis of floral
scents in four sympatric species of Serapias L. (Orchidaceae): clues on their
pollination strategies. Plant Syst Evol. 2012; 298:1837–43.
29. Doyle JJ, Doyle JL. A rapid DNA isolation procedure for small quantities of
fresh leaf tissue. Phytochem Bull. 1987; 19:11–5.
30. Pellegrino G, Cafasso D, Widmer A, Soliva M, Musacchio A, Cozzolino S.
Isolation and characterization of microsatellite loci from the orchid Serapias
vomeracea (Orchidaceae) and cross-priming to other Serapias species. Mol
Ecol Notes. 2001; 1:279–80.
31. Valièr N. GIMLET: a computer program for analysing genetic individual
identification data. Mol Ecol Notes. 2002; 2:377–9.
32. Halkett F, Simon JC, Balloux F. Tackling the population genetics of clonal
and partially clonal organisms. Trends Ecol Evol. 2005; 20:194–201.
33. Pielou EC. An introduction to mathematical ecology. New York:
Wiley-Interscience; 1969.
34. Kalinowski ST. Counting alleles with rarefaction: Private alleles and
hierarchical sampling designs. Conserv Genet. 2004; 5:539–43.
35. Nei M. Mutation-Driven Evolution. Oxford: Oxford University Press; 2013.
36. Goudet J. FSTAT (Version 1.2): A Computer Program to Calculate F-Statistics.
J Hered. 1995; 86:485–6.
37. Rousset F. Inferences from spatial population genetics. In: Balding DJ,
Bishop M, Cannings C, editors. Handbook of statistical genetics. Chichester,
U.K.: Wiley; 2007. p. 945–79.
38. Weir BS, Cockerham CC. Estimating F-Statistics for the analysis of population
structure. Evolution. 1984; 38:1358–70.
39. Cornuet JM, Luikart G. Description and power analysis of two tests for
detecting recent population bottlenecks from allele frequency data.
Genetics. 1997; 144:2001–14.
40. Piry S, Luikart G, Cornuet JM. BOTTLENECK: a computer program for
detecting recent reductions in the effective population size using allele
frequency data. J Hered. 1999; 90:502–3.
41. Marshall TC, Slate J, Kruuk LEB, Pemberton JM. Statistical confidence for
likelihood-based paternity inference in natural populations. Mol Ecol. 1998;
7:639–55.
42. Luikart G, Sherwin WB, Steele BM, Allendorf FW. Usefulness of molecular
markers for detecting population bottlenecks via monitoring genetic
change. Mol Ecol. 1998; 7:963–74.
43. Pellegrino G, Palermo AM, Noce ME, Bellusci F, Musacchio A. Genetic
population structure in the Mediterranean Serapias vomeracea, a
nonrewarding orchid group. Interplay of pollination strategy and stochastic
forces? Plant Syst Evol. 2007; 263:145–57.
44. Hedrén M, Nordström S, Ståhlberg D. Geographical variation and
systematics of the tetraploid marsh orchid Dactylorhiza majalis subsp.
sphagnicola (Orchidaceae) and closely related taxa. Bot J Linn Soc. 2012;
168:174–93.
45. Gustafsson S, Lönn M. Genetic differentiation and habitat preference of
flowering-time variants within Gymnadenia conopsea. Heredity. 2003; 91:284–92.
46. Stark C, Michalski SG, Babik W, Winterfeld G, Durka W. Strong genetic
differentiation between Gymnadenia conopsea and G. densiflora despite
morphological similarity. Plant Syst Evol. 2011; 293:213–26.
47. Soliva M, Widmer A. Gene flow across species boundaries in sympatric, sexually
deceptive Ophrys (Orchidaceae) species. Evolution. 2003; 57:2252–61.
48. Mant J, Peakall R, Schiestl FP. Does selection on floral odor promote
differentiation among populations and species of the sexually deceptive
orchid genus Ophrys? Evolution. 2005; 59:1449–63.
49. Swarts ND, Sinclair EA, Krauss SL, Dixon KW. Genetic diversity in fragmented
populations of the critically endangered spider orchid Caladenia huegelii:
implications for conservation. Conserv Genet. 2009; 10:1199–208.
Pellegrino et al. BMC Plant Biology (2015) 15:222
Page 10 of 10
50. Chen YY, Bao Z-X, Qu Y, Li W, Li Z-Z. Genetic diversity and population
structure of the medicinal orchid Gastrodia elata revealed by microsatellite
analysis. Biochem Syst Ecol. 2014;54:182–9.
51. Abeli T, Gentili R, Mondoni A, Orsenigo S, Rossi G. Effects of marginality on
plant population performance. J Biogeogr. 2014; 41:239–49.
52. Leimu R, Mutikainen P, Koricheva J, Fischer M. How general are positive
relationships between plant population size, fitness and genetic variation?
J Ecol. 2006; 94:942–52.
53. Palstra FP, Ruzzante DE. Genetic estimates of contemporary effective
population size: what can they tell us about the importance of genetic
stochasticity for wild population persistence? Mol Ecol. 2008; 17:3428–47.
54. Davies SJ, Cavers S, Finegan B, White A, Breed MF, Lowe AJ. Pollen flow in
fragmented landscapes maintains genetic diversity following standreplacing disturbance in a neotropical pioneer tree, Vochysia ferruginea Mart.
Heredity. 2013; 1–5.
55. Lind H, Franzén M, Pettersson B, Nilsson LA. Metapopulation pollination in
the deceptive orchid Anacamptis pyramidalis. Nord J Bot. 2007; 25:176–82.
56. Mustajärvi K, Siikamäki P, Rytkönen S, Lammi A. Consequences of plant
population size and density for plant–pollinator interactions and plant
performance. J Ecol. 2001; 89:80–7.
57. Setsuko S, Nagamitsu T, Tomaru N. Pollen flow and effects of population
structure on selfing rates and female and male reproductive success in
fragmented Magnolia stellata populations. BMC Biol. 2013; 13:10.
58. Aguilar R, Ashworth L, Galetto L, Aizen MA. Plant reproductive susceptibility
to habitat fragmentation: review and synthesis through a meta-analysis.
Ecol Lett. 2006; 9:968–80.
59. Vandewoestijne S, Róis AS, Caperta A, Baguette M, Tyteca D. Effects of
individual and population parameters on reproductive success in three
sexually deceptive orchid species. Plant Biol. 2009; 11:454–63.
60. Schiestl FP. Floral evolution and pollinator mate choice in a sexually
deceptive orchid. J Evol Biol. 2004; 17:255–64.
61. Wong BBM, Salzmann C, Schiestl FP. Pollinator attractiveness increases with
distance from flowering orchids. Proc R Soc Lond. 2004; 271:S212–4.
62. Brzosko E, Wroblewska A, Ratkiewicz M. Spatial genetic structure and clonal
diversity of island populations of lady’s slipper (Cypripedium calceolus) from
the Biebrza National Park (northeast Poland). Mol Ecol. 2002; 11:2499–509.
63. Brzosko E, Talalaj I, Wroblewska A. Genetic structure of rare Epipactis
atrorubens populations from two national parks in Northeast Poland.
Pol Bot St. 2006; 22:71–80.
64. Brzosko E, Wroblewska A. Genetic variation and clonal diversity in island
Cephalanthera rubra populations from the Biebrza National Park. Poland Bot
J Linn Soc. 2003; 143:99–108.
65. Silvertown JW. The evolutionary maintenance of sexual reproduction:
evidence from the ecological distribution of asexual reproduction in clonal
plants. Int J Plant Sci. 2008; 169:157–68.
66. Vallejo-Marín M, Dorken ME, Barrett SCH. The ecological and evolutionary
consequences of clonality for plants mating. Annu Rev Ecol Syst. 2010;
41:193–213.
67. Lhuillier E, Butaud JF, Bouvet JM. Extensive clonality and strong
differentiation in the insular Pacific tree Santalum insulare: implications for
its conservation. Ann Bot. 2006; 98:1061–72.
Submit your next manuscript to BioMed Central
and take full advantage of:
• Convenient online submission
• Thorough peer review
• No space constraints or color figure charges
• Immediate publication on acceptance
• Inclusion in PubMed, CAS, Scopus and Google Scholar
• Research which is freely available for redistribution
Submit your manuscript at
www.biomedcentral.com/submit